
Spatiotemporal evolution characteristics of extreme precipitation events on the Loess Plateau from 1960 to 2023
Received date: 2024-08-03
Revised date: 2024-09-21
Online published: 2026-03-11
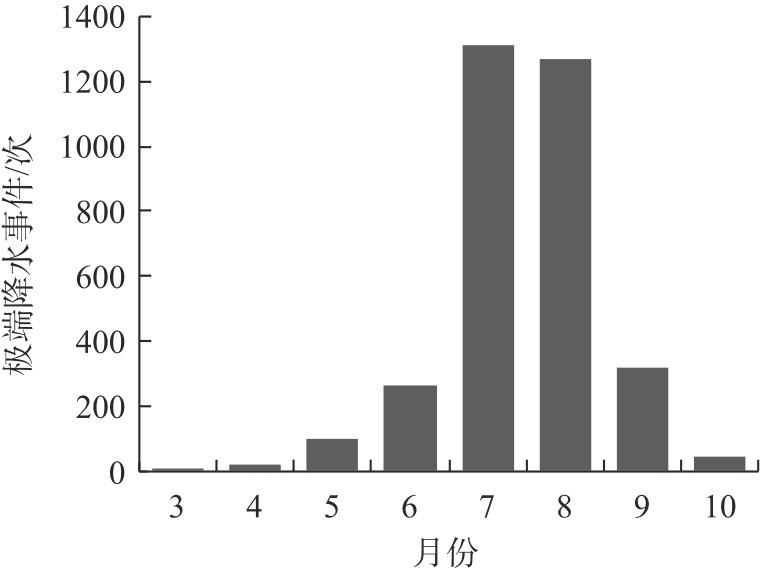
The Loess Plateau of China has been experiencing an increase in extreme climate events due to global warming. Understanding the spatiotemporal characteristics of extreme precipitation events in this region is crucial for disaster prevention. This study analyzes daily precipitation data from 111 meteorological stations across the Loess Plateau, spanning the years 1960 to 2023. Using detrended fluctuation analysis (DFA), we established thresholds for extreme precipitation events and examined their spatiotemporal characteristics through the Mann-Kendall test and other methods. The findings reveal the following. (1) Extreme precipitation thresholds at meteorological stations vary between 27.4 mm and 89.1 mm, with 54% of the stations exceeding a threshold of 50 mm. The average threshold values across different ecological regions range from 35.0 mm to 59.6 mm, exhibiting a gradient that is lower in the northwest and higher in the southeast. (2) The amount and intensity of extreme precipitation events increase from 10.6 mm·a-1 and 33.0 mm·d-1 in the northwest to 71.5 mm·a-1 and 133.0 mm·d-1 in the southeast, respectively. The frequency of their occurrence increases from 0.3 d·a-1 in the north to 0.8 d·a-1 in the south. The number of extreme precipitation days closely aligns with heavy rain days, particularly in the loess hilly gully B2 sub-region. (3) The loess tableland gully, earth-rocky mountainous, and river valley plain regions are identified as high-risk areas for extreme precipitation events and should be prioritized for disaster prevention and control. (4) Over the past 64 years, extreme precipitation events have shown distinct interannual variability, with an overall increase observed, particularly in July and August. (5) In the last decade, the loess tableland gully and loess hilly gully regions have seen increased precipitation amounts and frequencies of extreme events. By contrast, the declining trend of extreme precipitation events in the sandy land and irrigated agricultural regions has slowed, whereas both the earth-rocky mountainous and river valley plain regions experienced a sudden spike in extreme precipitation events in 2020. This study serves as a reference for disaster prevention and mitigation regarding extreme precipitation events across the different ecological regions of the Loess Plateau.
Xinhan ZHANG , Wenting ZHAO , Juying JIAO , Xiaowu MA , Bo YANG , Qi LING . Spatiotemporal evolution characteristics of extreme precipitation events on the Loess Plateau from 1960 to 2023[J]. Arid Land Geography, 2025 , 48(7) : 1153 -1166 . DOI: 10.12118/j.issn.1000-6060.2024.461
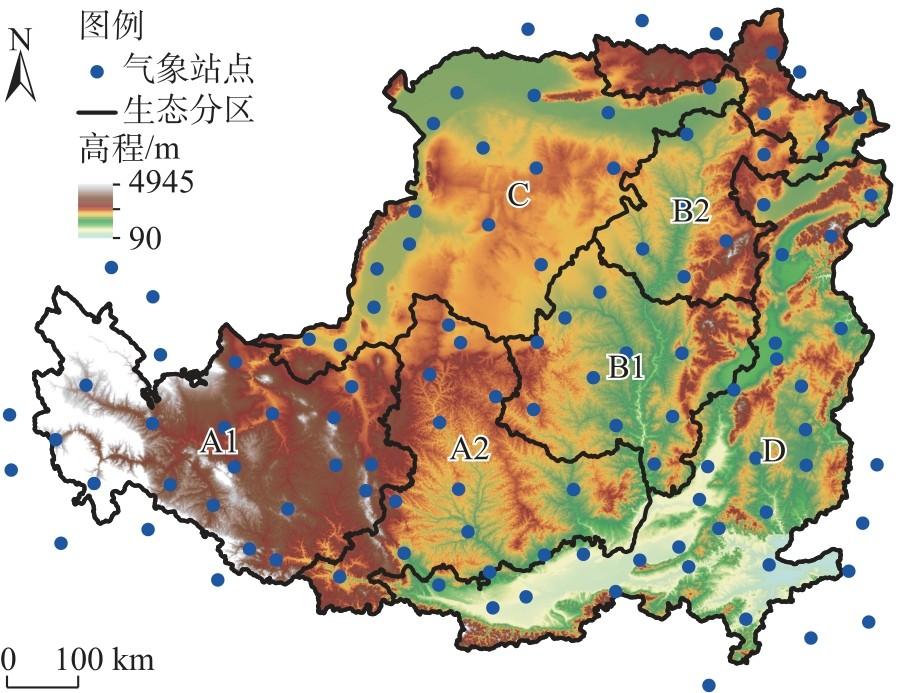
图1 黄土高原生态分区及气象站点分布注:基于资源环境科学与数据平台(https://www.resdc.cn/data.aspx?DATAID=140)的黄土高原空间范围数据制作。A1为黄土高塬沟壑区A1副区;A2为黄土高塬沟壑区A2副区;B1为黄土丘陵沟壑区B1副区;B2为黄土丘陵沟壑区B2副区;C为沙地和农灌区; D为土石山区及河谷平原区。下同。 Fig. 1 Ecological regionalizations and distribution of meteorological stations on the Loess Plateau |
表1 极端降水指标及定义Tab. 1 Extreme precipitation indicators and definitions |
| 极端降水指标 | 定义 | 单位 | |
|---|---|---|---|
| 极端降水事件指标 | 极端降水量 | 年内超过极端降水阈值的降水量总和 | mm |
| 极端降水日数 | 年内发生极端降水事件的日数 | d | |
| 极端降水强度 | 极端降水量与极端降水天数的比值 | mm·d-1 | |
| 极端降水指数 | 连续降水日数(CWD) | 年内日降水量≥1 mm的最长持续时间 | d |
| 大雨日数(R25mm) | 年内日降水量>25 mm的总日数 | d | |
| 暴雨日数(R50mm) | 年内日降水量>50 mm的总日数 | d | |
| 日最大降水量(RX1day) | 年内日降水量最大值 | mm | |
| 连续5 d最大降水量(RX5day) | 年内连续5 d降水量最大值 | mm | |
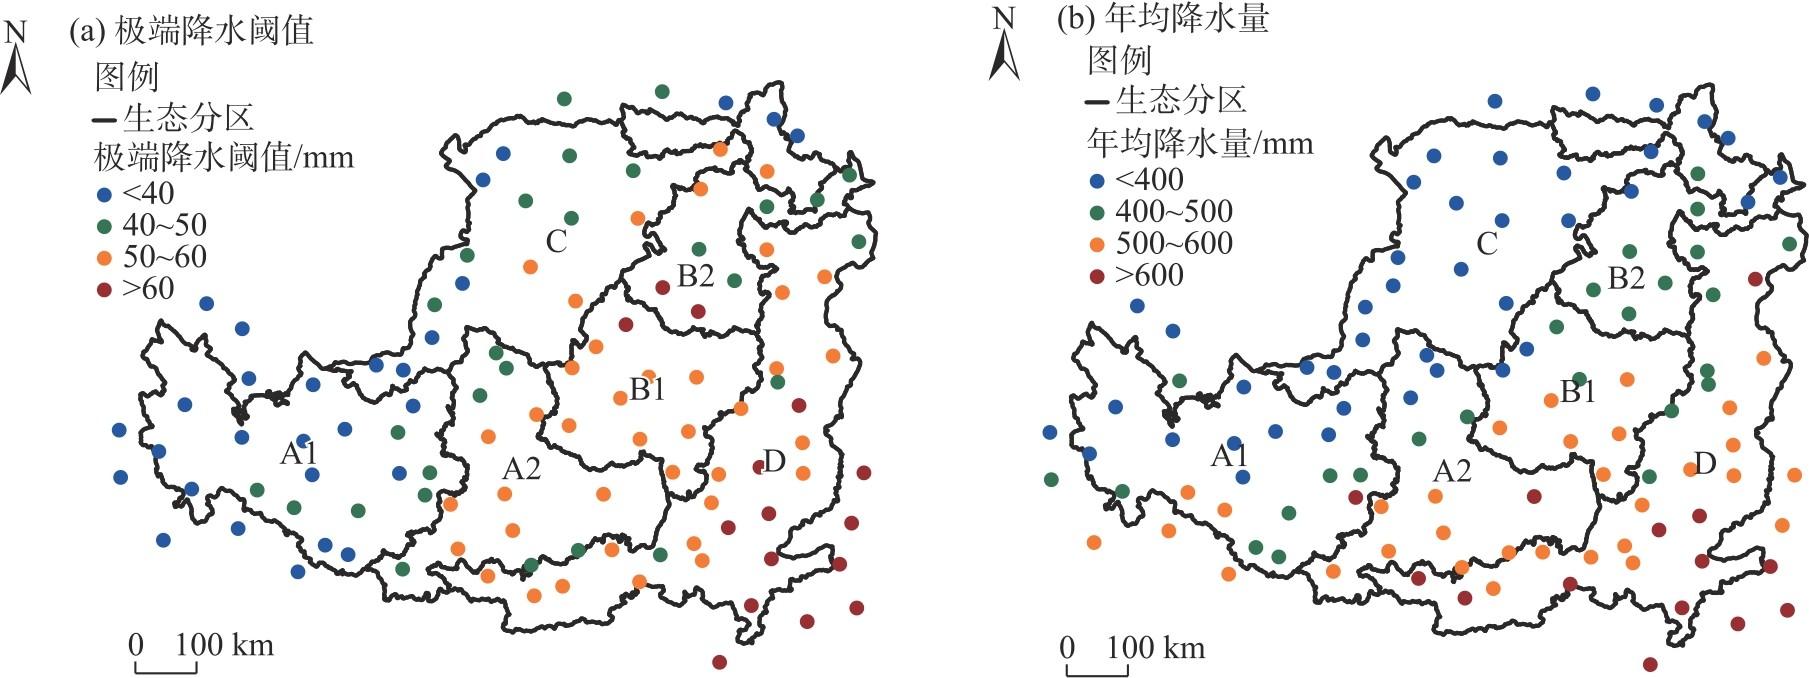
图2 黄土高原各站点极端降水阈值及年均降水量的空间分布Fig. 2 Spatial distributions of extreme precipitation thresholds and annual average precipitation at each station on the Loess Plateau |
表2 不同生态分区的极端降水阈值Tab. 2 Extreme precipitation thresholds in different ecological regionalizations |
| 分区 | 雨量站数量/站 | 阈值范围/mm | 平均值±标准误/mm |
|---|---|---|---|
| A1 | 26 | 27.4~49.1 | 35.0±1.1 |
| A2 | 12 | 42.4~59.0 | 51.6±1.5 |
| B1 | 10 | 53.3~61.2 | 57.1±0.7 |
| B2 | 8 | 41.8~62.6 | 50.6±2.8 |
| C | 17 | 34.1~57.2 | 44.5±1.8 |
| D | 38 | 35.7~89.1 | 59.6±2.2 |
注:A1为黄土高塬沟壑区A1副区;A2为黄土高塬沟壑区A2副区;B1为黄土丘陵沟壑区B1副区;B2为黄土丘陵沟壑区B2副区;C为沙地和农灌区;D为土石山区及河谷平原区。下同。 |
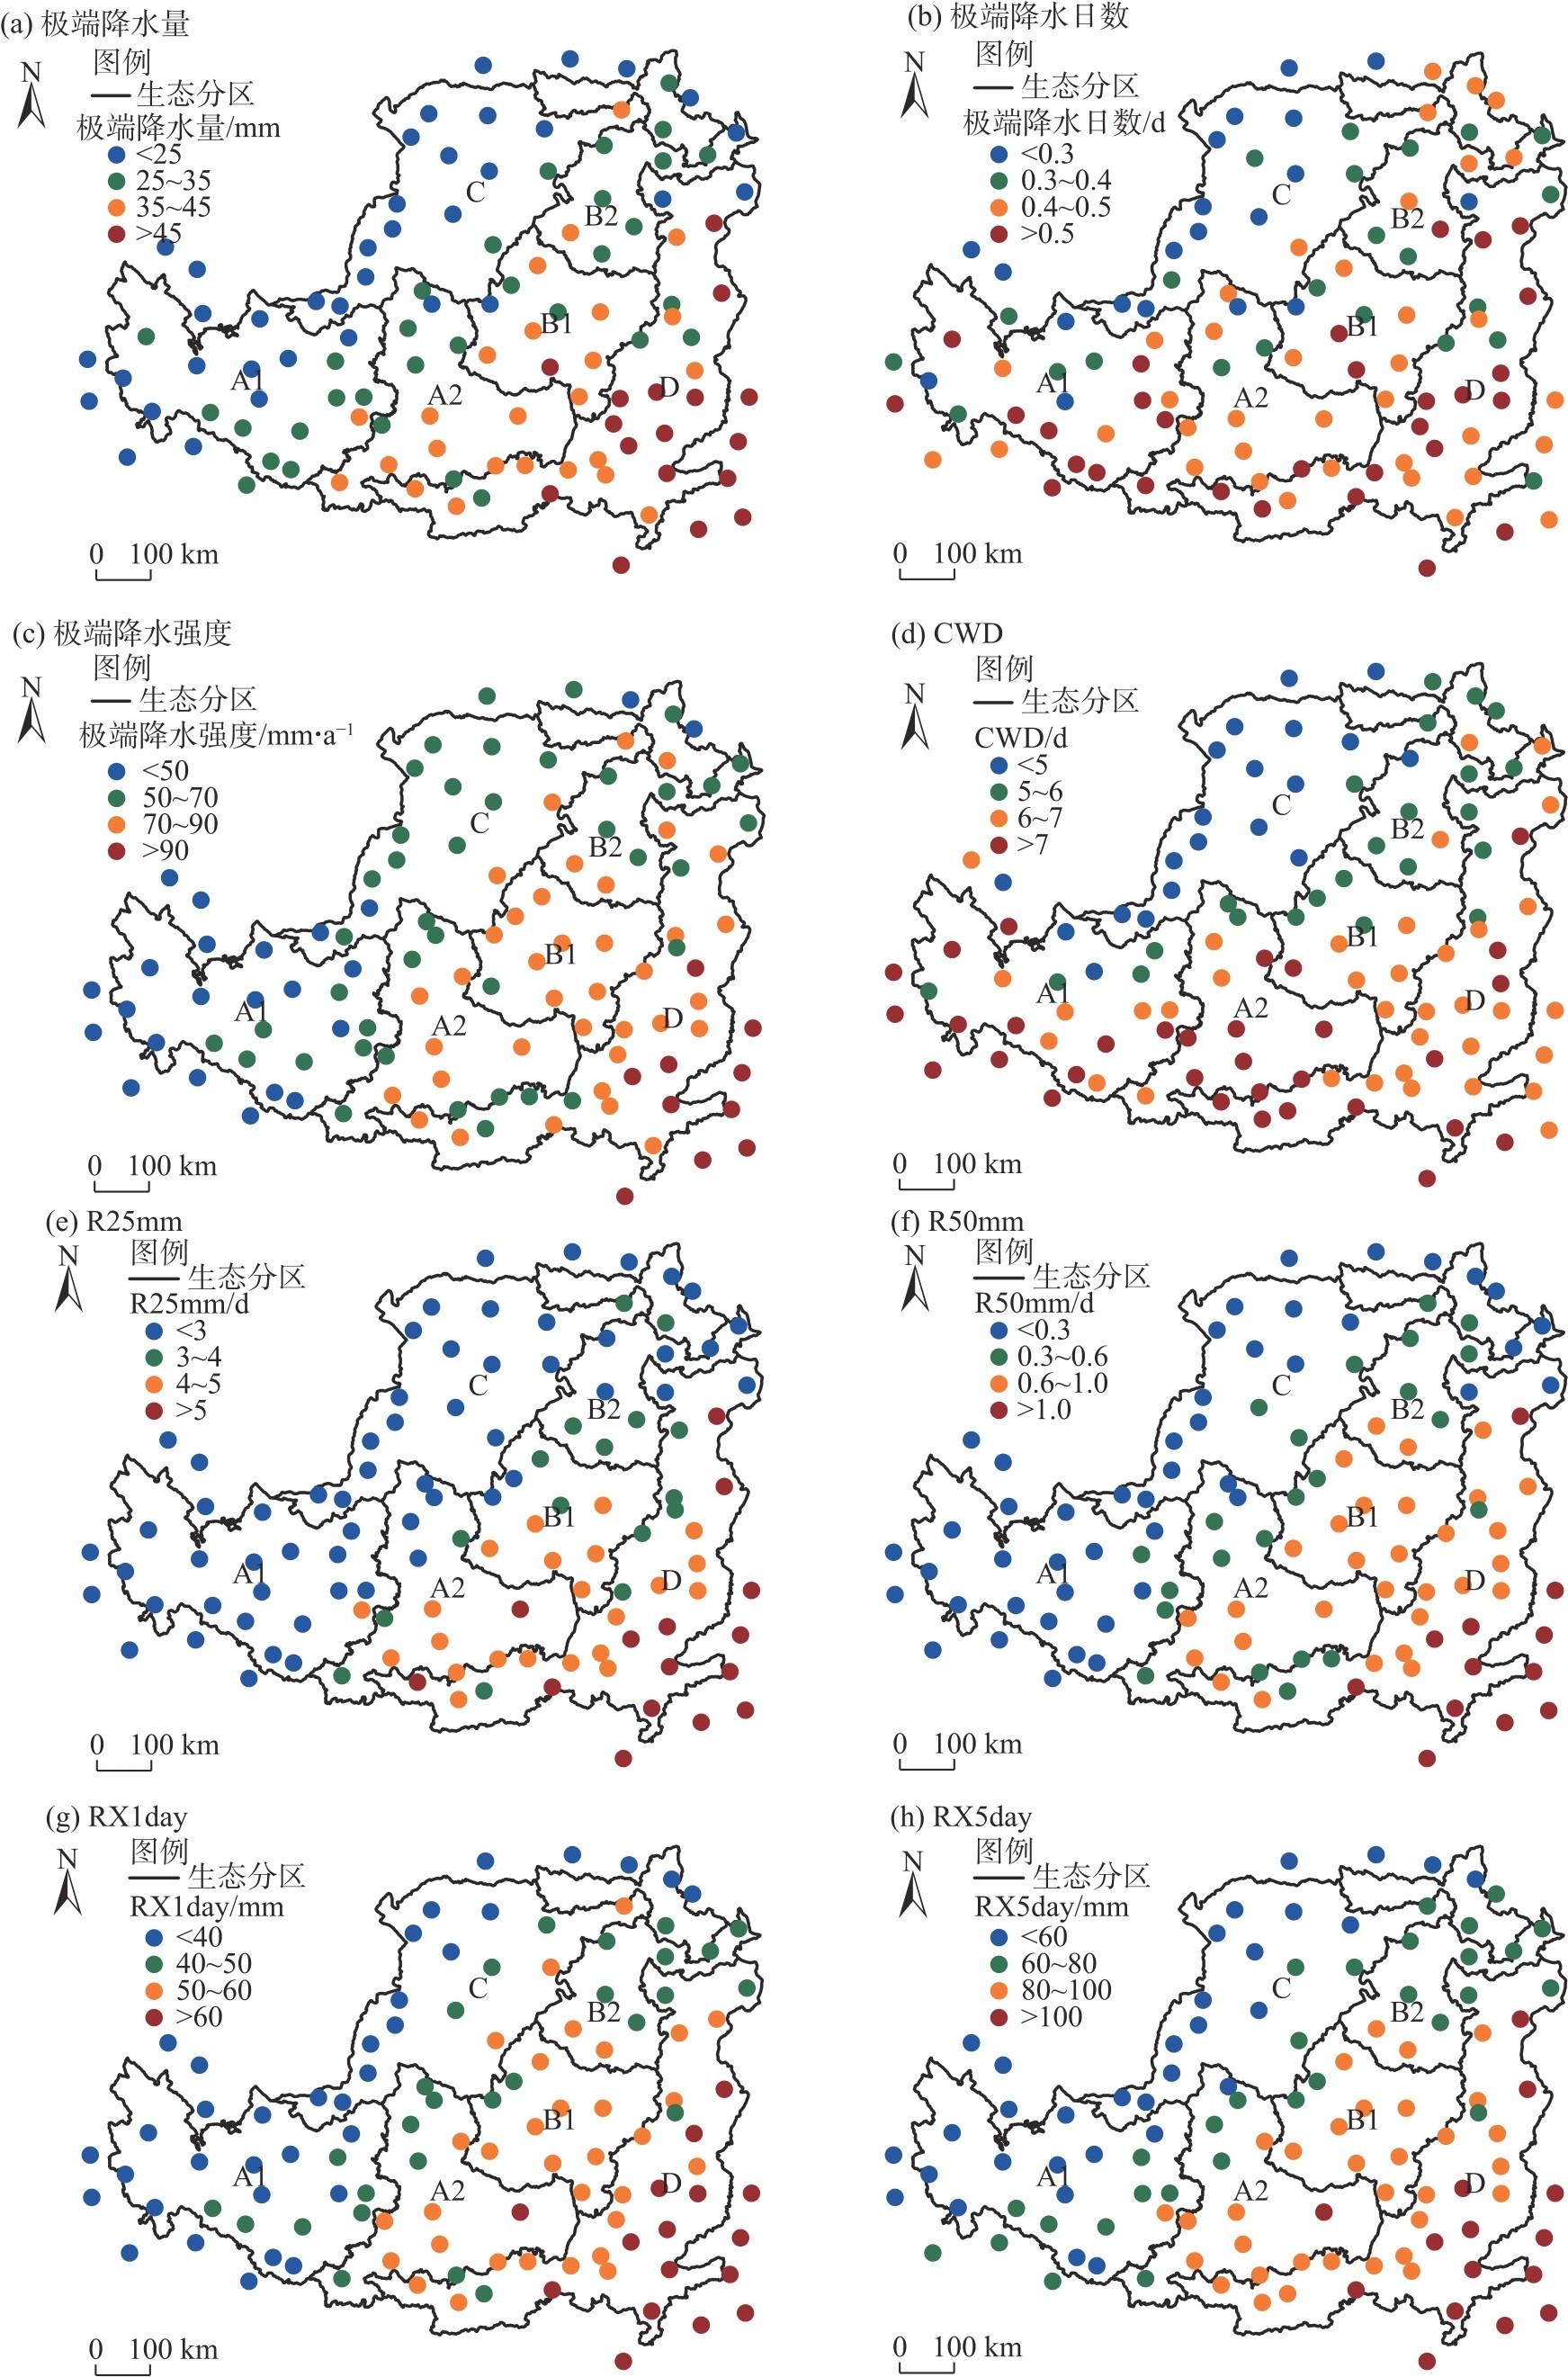
表3 不同生态分区的极端降水指标值Tab. 3 Extreme precipitation indicator values in different ecological regionalizations |
| 极端降水指标 | 生态分区 | ||||||
|---|---|---|---|---|---|---|---|
| A1 | A2 | B1 | B2 | C | D | ||
| 极端降水事件指标 | 极端降水量/mm | 22.83±1.71 | 33.75±2.22 | 35.37±2.18 | 30.09±1.74 | 21.08±1.81 | 42.94±2.34 |
| 极端降水日数/d | 0.50±0.03 | 0.49±0.03 | 0.48±0.03 | 0.46±0.03 | 0.34±0.02 | 0.53±0.02 | |
| 极端降水强度/mm·d-1 | 45.17±1.68 | 68.35±2.11 | 74.99±1.23 | 66.40±4.24 | 59.91±2.40 | 79.91±3.33 | |
| 极端降水指数 | CWD/d | 7.22±0.34 | 7.06±0.27 | 6.27±0.18 | 5.73±0.17 | 4.35±0.13 | 6.80±0.14 |
| R25mm/d | 1.64±0.19 | 3.59±0.34 | 3.84±0.20 | 2.94±0.15 | 1.48±0.19 | 4.77±0.29 | |
| R50mm/d | 0.14±0.03 | 0.58±0.06 | 0.70±0.05 | 0.50±0.06 | 0.26±0.04 | 0.96±0.10 | |
| RX1day/mm | 33.81±1.41 | 50.53±1.89 | 54.27±1.27 | 48.30±2.12 | 38.10±1.91 | 59.64±2.43 | |
| RX5day/mm | 54.92±2.58 | 79.56±4.11 | 85.16±3.10 | 74.51±3.18 | 52.18±3.25 | 95.92±3.83 | |
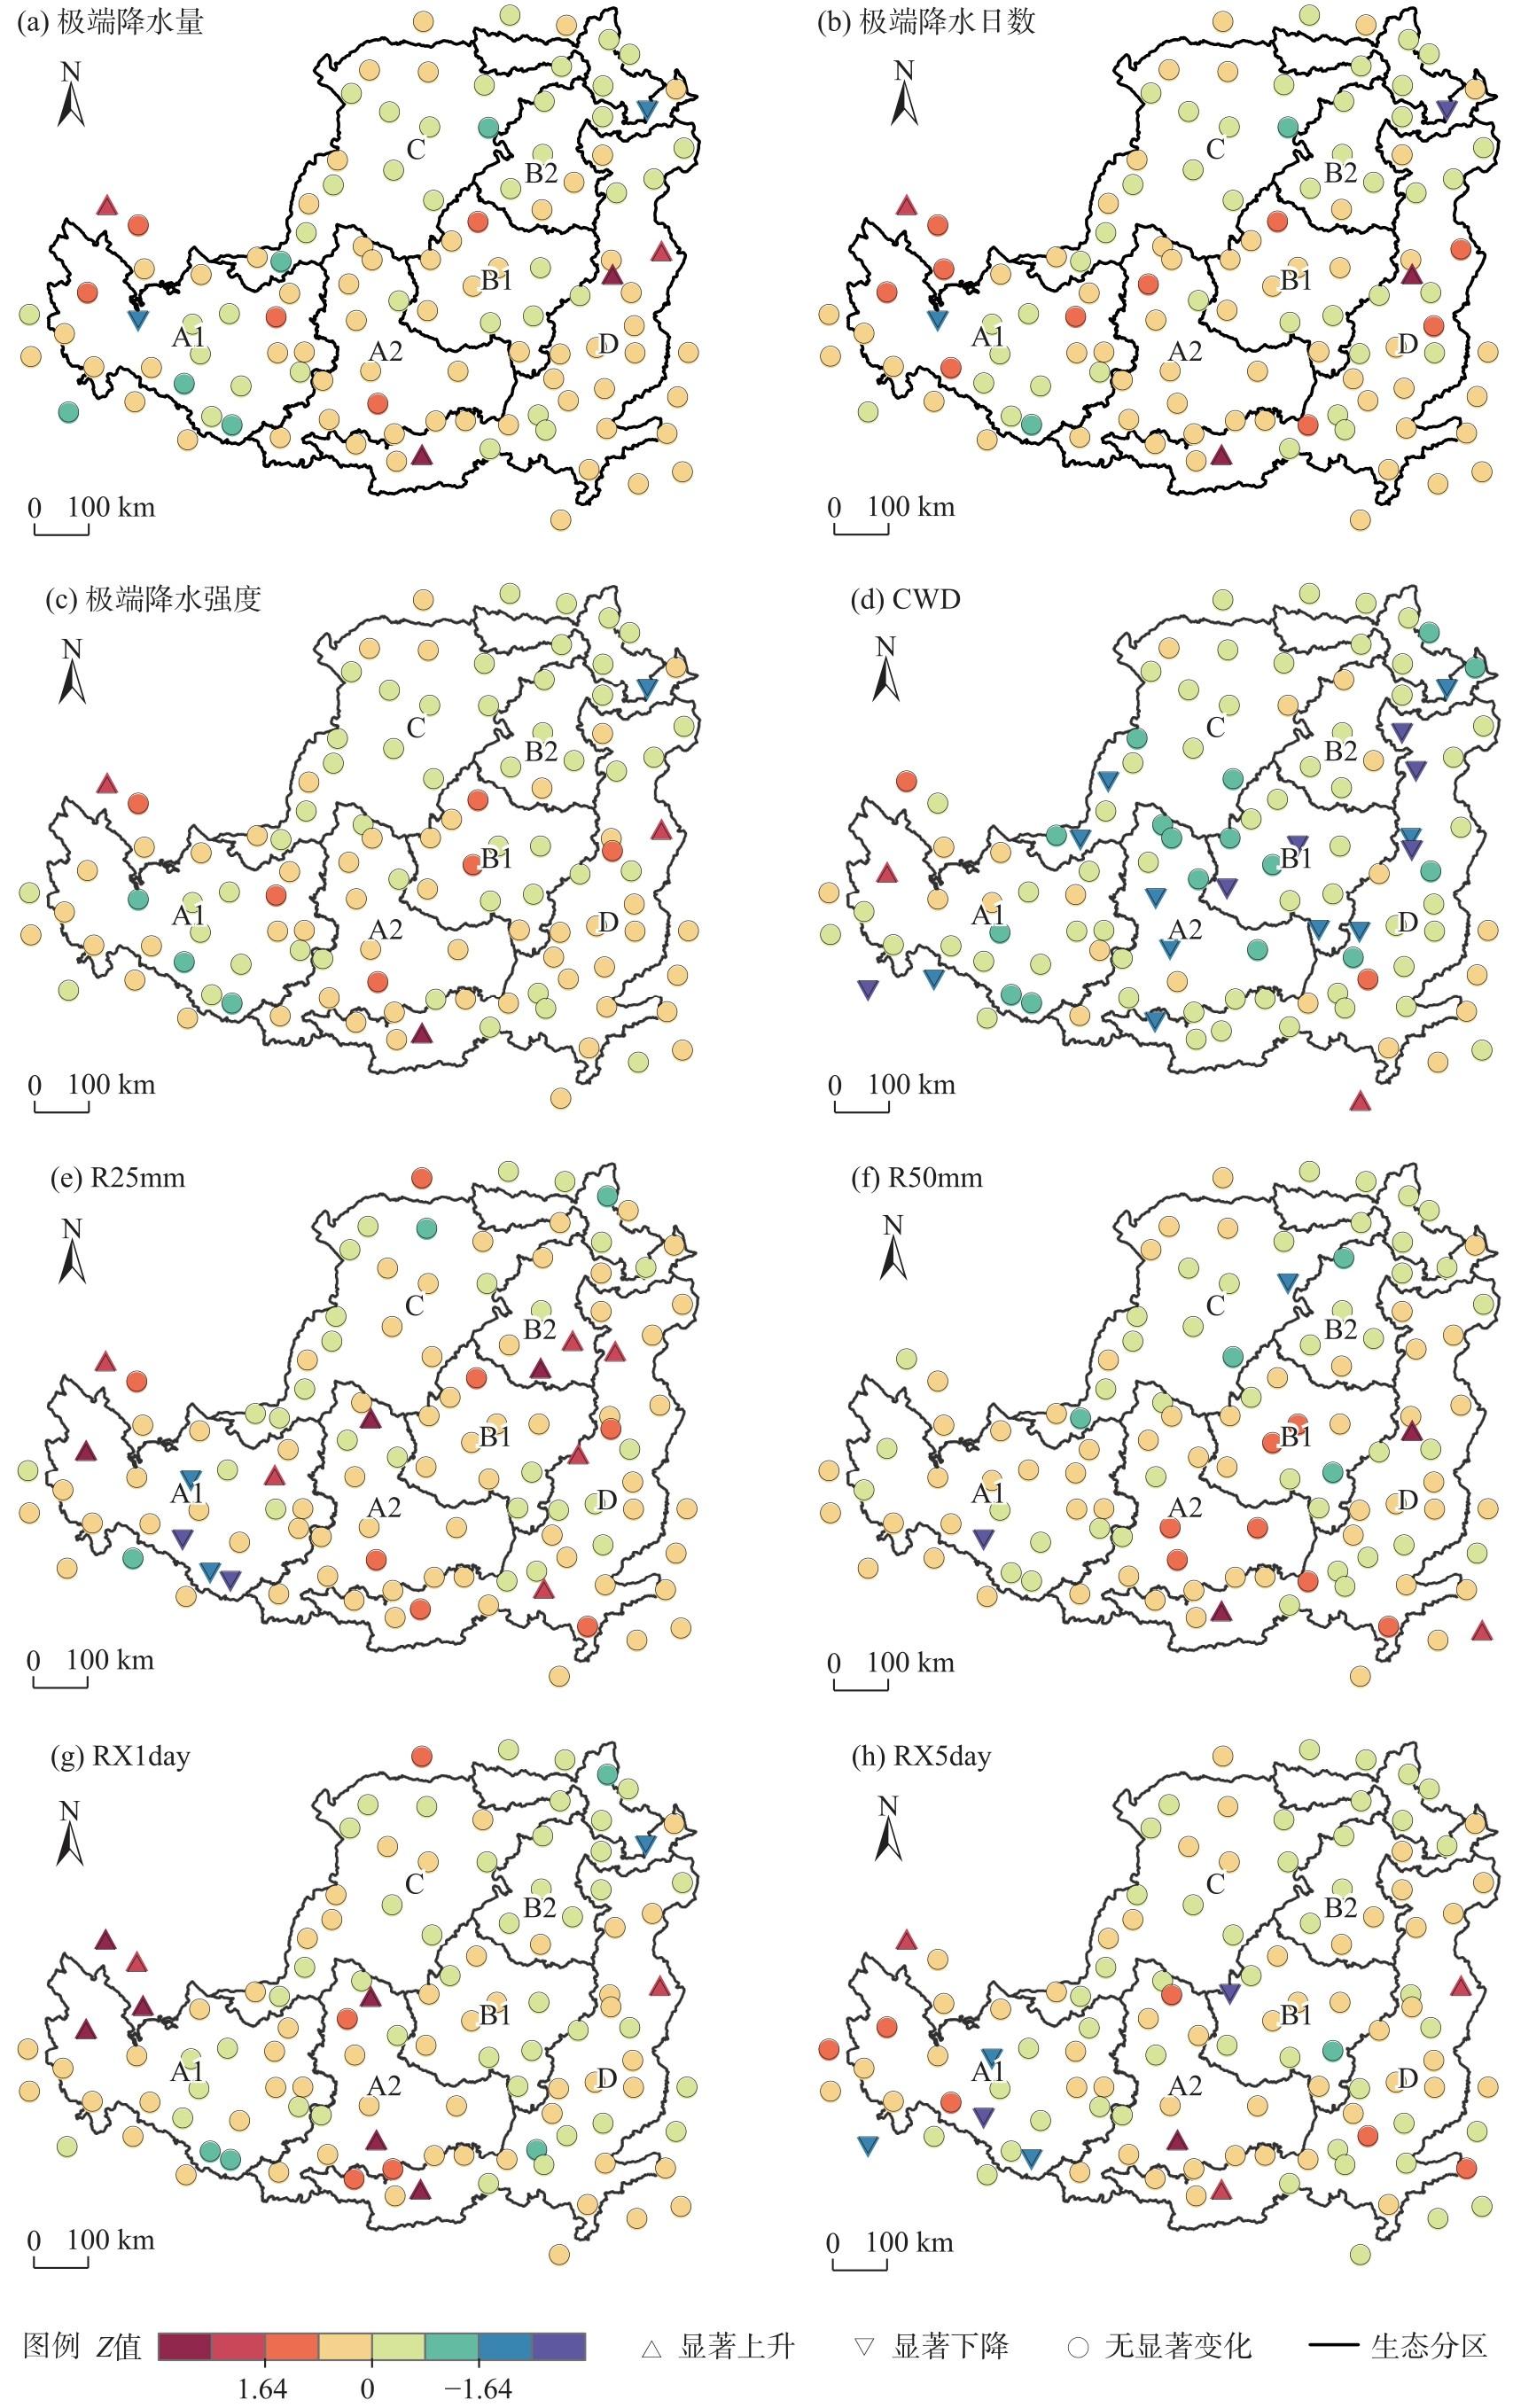
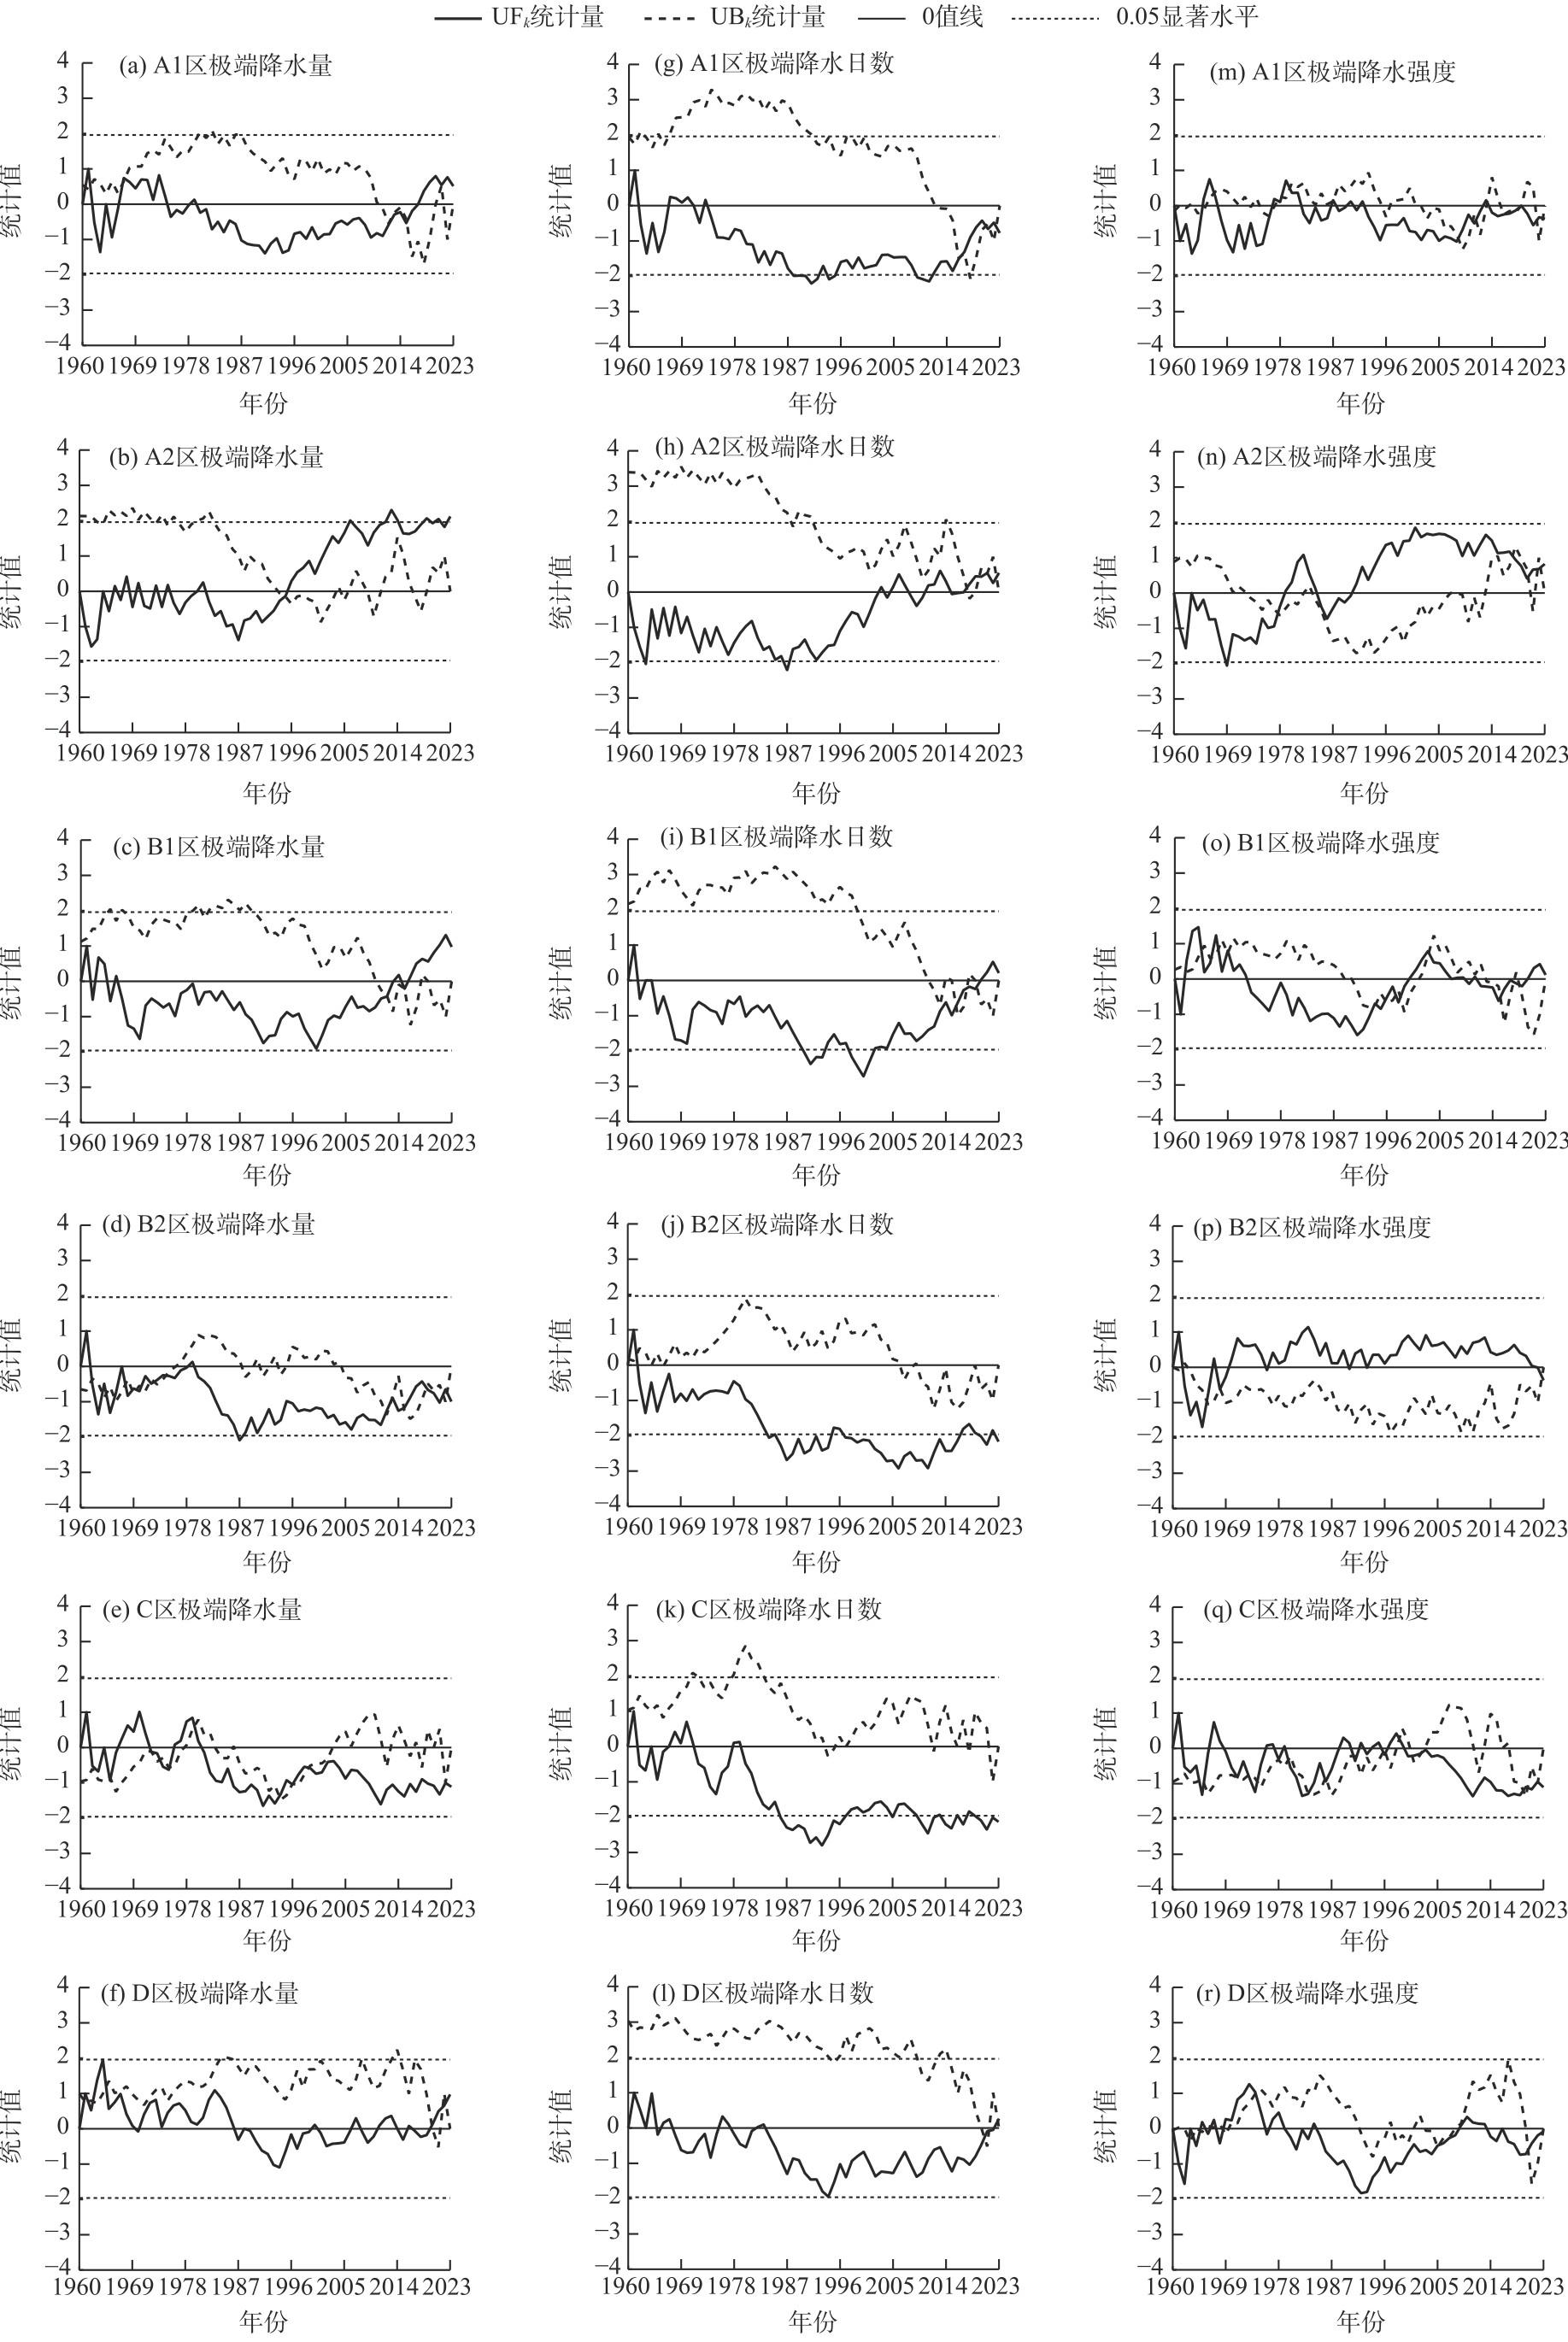
图4 各气象站点极端降水指标的变化趋势Fig. 4 Variation trends of extreme precipitation indicators at each meteorological station |
表4 黄土高原全区的极端降水指标统计检验结果Tab. 4 Statistical test results of extreme precipitation indicators on the whole Loess Plateau |
| 极端降水指标 | 平均值 | 最大值 | 最小值 | 变异系数 | Z值 | Sen斜率 | |
|---|---|---|---|---|---|---|---|
| 极端降水事件指标 | 极端降水量/mm | 32.4 | 76.7 | 7.5 | 0.40 | 1.40 | 0.128 |
| 极端降水日数/d | 0.5 | 0.9 | 0.1 | 0.39 | 1.49 | 0.001 | |
| 极端降水强度/mm·d-1 | 66.9 | 90.9 | 54.5 | 0.10 | 0.25 | 0.009 | |
| 极端降水指数 | CWD/d | 6.4 | 9.5 | 5.0 | 0.13 | -1.63 | -0.009 |
| R25mm/d | 3.2 | 5.1 | 1.4 | 0.22 | 1.85 | 0.010 | |
| R50mm/d | 0.6 | 1.2 | 0.2 | 0.35 | 1.37 | 0.001 | |
| RX1day/mm | 48.0 | 61.3 | 32.2 | 0.12 | 0.74 | 0.035 | |
| RX5day/mm | 75.3 | 90.7 | 47.5 | 0.14 | 0.57 | 0.036 | |
| [1] |
江志红, 丁裕国, 陈威霖. 21世纪中国极端降水事件预估[J]. 气候变化研究进展, 2007, 3(4): 202-207.
[
|
| [2] |
袁文德, 郑江坤, 董奎. 1962—2012年西南地区极端降水事件的时空变化特征[J]. 资源科学, 2014, 36(4): 766-772.
[
|
| [3] |
|
| [4] |
|
| [5] |
杨萍, 侯威, 封国林. 基于去趋势波动分析方法确定极端事件阈值[J]. 物理学报, 2008, 57(8): 5333-5342.
[
|
| [6] |
刘丙军, 伍丽丽, 陆文秀. 基于DFA方法的珠江流域极端降水阈值研究[J]. 中山大学学报(自然科学版), 2013, 52(1): 136-141.
[
|
| [7] |
郑祚芳, 张秀丽, 曹鸿兴, 等. 用去趋势涨落分析研究北京气候的长程变化特征[J]. 地球物理学报, 2007(2): 420-424.
[
|
| [8] |
郑腾飞, 郭建茂, 尹继福, 等. 基于DFA法的江苏省极端降水时空分布特征研究[J]. 自然灾害学报, 2012, 21(4): 76-83.
[
|
| [9] |
|
| [10] |
|
| [11] |
新华网. 山西严重洪涝灾害已致175万余人受灾[EB/OL]. [2021-10-10].
[ Xinhua News Agency. Severe floods and waterlogging in Shanxi have affected more than 1.75 million people[EB/OL]. [2021-10-10].
|
| [12] |
|
| [13] |
|
| [14] |
卢珊, 胡泽勇, 王百朋, 等. 近56年中国极端降水事件的时空变化格局[J]. 高原气象, 2020, 39(4): 683-693.
[
|
| [15] |
景丞, 陶辉, 王艳君, 等. 基于区域气候模式CCLM的中国极端降水事件预估[J]. 自然资源学报, 2017, 32(2): 266-277.
[
|
| [16] |
王志福, 钱永甫, 林惠娟, 等. 区域海气耦合模式对我国极端降水模拟分析[J]. 高原气象, 2008, 27(1): 113-121.
[
|
| [17] |
|
| [18] |
卢珊, 胡泽勇, 付春伟, 等. 黄土高原夏季极端降水及其成因分析[J]. 高原气象, 2022, 41(1): 241-254.
[
|
| [19] |
李志, 郑粉莉, 刘文兆. 1961—2007年黄土高原极端降水事件的时空变化分析[J]. 自然资源学报, 2010, 25(2): 291-299.
[
|
| [20] |
王国桢, 晏宏, 刘成程, 等. 1960—2017年黄土高原极端降水的时空演化及其对环流变化的响应[J]. 地球环境学报, 2023, 14(5): 588-602.
[
|
| [21] |
周晓红, 赵景波. 黄土高原气候变化与植被恢复[J]. 干旱区研究, 2005, 22(1): 116-119.
[
|
| [22] |
裴宏泽, 赵亚超, 张廷龙. 2000—2020年黄土高原NEP时空格局与驱动力[J]. 干旱区研究, 2023, 40(11): 1833-1844.
[
|
| [23] |
杨艳芬, 王兵, 王国梁, 等. 黄土高原生态分区及概况[J]. 生态学报, 2019, 39(20): 7389-7397.
[
|
| [24] |
|
| [25] |
|
| [26] |
井乐, 李建平, 张翼, 等. 黄土高原不同土地利用方式下土壤干层差异[J]. 草业科学, 2018, 35(8): 1829-1835.
[
|
| [27] |
赵安周, 朱秀芳, 潘耀忠. 1965—2013年黄土高原地区极端降水事件时空变化特征[J]. 北京师范大学学报(自然科学版), 2017, 53(1): 43-50.
[
|
| [28] |
王万忠, 焦菊英, 魏艳红, 等. 近半个世纪以来黄土高原侵蚀产沙的时空分异特征[J]. 泥沙研究, 2015, 40(2): 9-16.
[
|
| [29] |
张光辉. 从土壤侵蚀角度诠释泥沙连通性[J]. 水科学进展, 2021, 32(2): 295-308.
[
|
| [30] |
央视网. 陕西大荔持续降雨致49.1万亩农田被淹紧急转移1.8万余名群众[EB/OL]. [2021-10-10].
[ CCTV network. Continuous rainfall in Dali, Shaanxi Province has caused 491000 mu of farmland to be flooded and urgently evacuated over 18000 people[EB/OL]. [2021-10-10].
|
| [31] |
杜世雄, 吴瑞英, 孙怀卫, 等. 中巴经济走廊极端降水事件分析[J]. 农业工程学报, 2022, 38(增刊1): 152-160.
[
|
| [32] |
杨东, 程军奇, 李小亚, 等. 甘肃黄土高原各级降水和极端降水时空分布特征[J]. 生态环境学报, 2012, 21(9): 1539-1547.
[
|
| [33] |
李双双, 孔锋, 韩鹭, 等. 陕北黄土高原区极端降水时空变化特征及其影响因素[J]. 地理研究, 2020, 39(1): 140-151.
[
|
| [34] |
黎珩, 朱冰冰, 边熇, 等. 1970—2020年黄土高原水蚀风蚀交错区极端降水时空变化研究及驱动因素分析[J]. 干旱区地理, 2024, 47(4): 539-548.
[
|
| [35] |
高涛, 谢立安. 近50年来中国极端降水趋势与物理成因研究综述[J]. 地球科学进展, 2014, 29(5): 577-589.
[
|
| [36] |
刘国彬, 上官周平, 姚文艺, 等. 黄土高原生态工程的生态成效[J]. 中国科学院院刊, 2017, 32(1): 11-19.
[
|
| [37] |
张宝庆, 田磊, 赵西宁, 等. 植被恢复对黄土高原局地降水的反馈效应研究[J]. 中国科学: 地球科学, 2021, 51(7): 1080-1091.
[
|
| [38] |
安彬, 肖薇薇, 刘宇峰, 等. 1955—2021年黄土高原地区相对湿度时空演变规律[J]. 干旱区地理, 2023, 46(12): 1939-1950.
[
|
| [39] |
|
| [40] |
卢燕. 2021年全球气候不能承受之变[J]. 绿色中国, 2021(23): 16-21.
[
|
/
| 〈 |
|
〉 |