
Vegetation dynamics and their responses to climate change in the Yellow River Basin: Based on climatic wet and dry zoning scales
Received date: 2024-07-10
Revised date: 2024-11-27
Online published: 2026-03-11
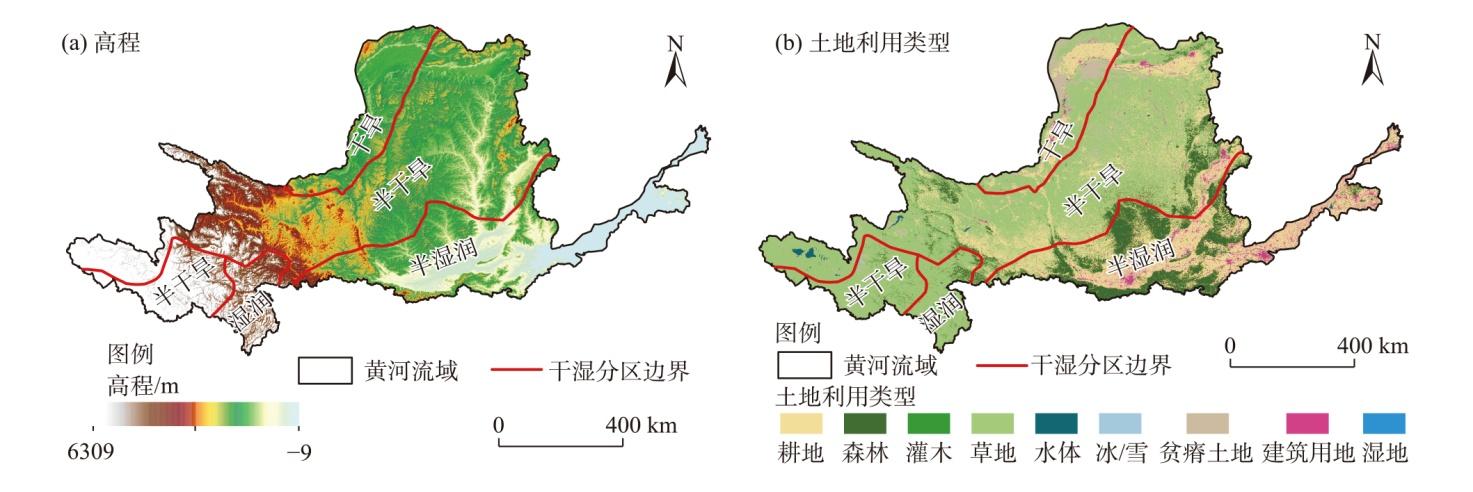
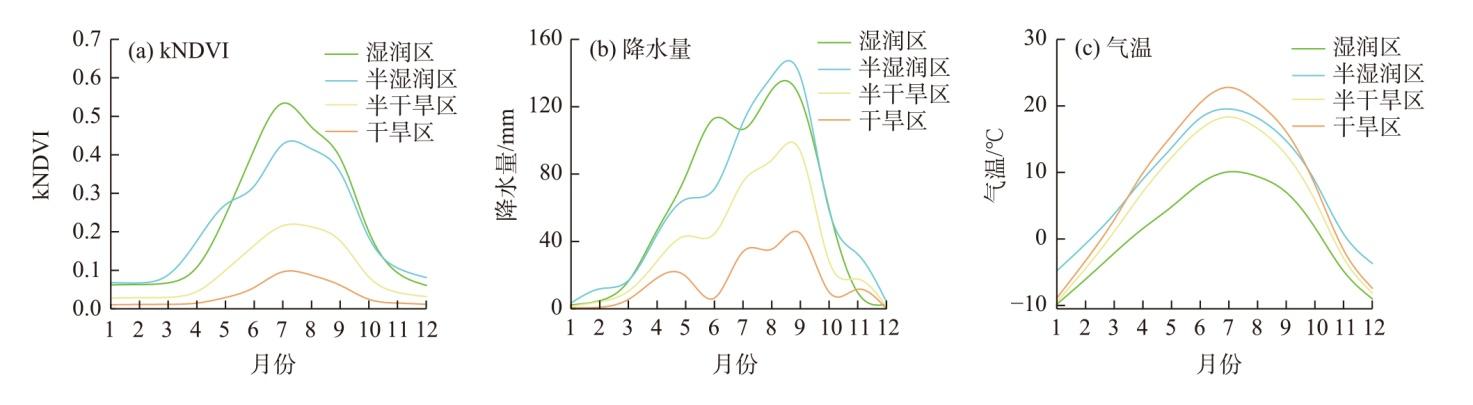
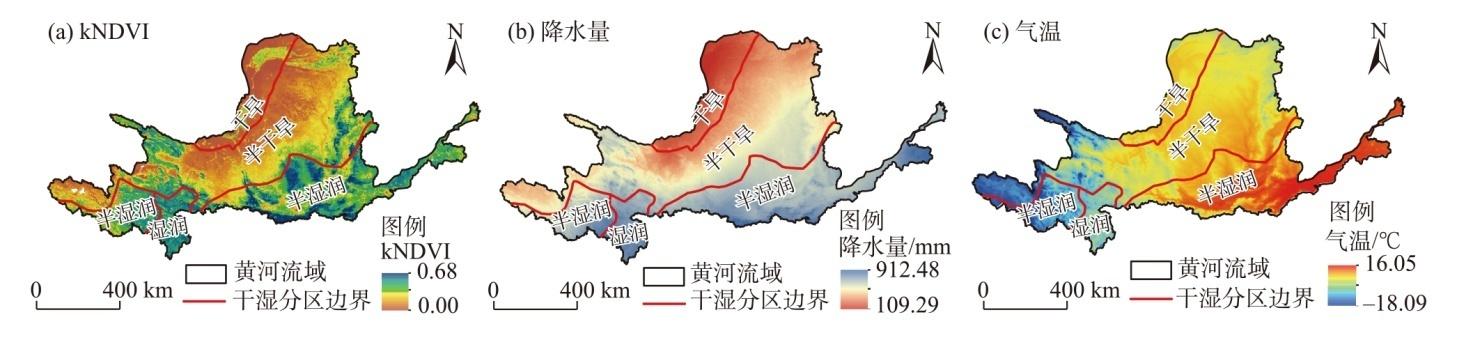
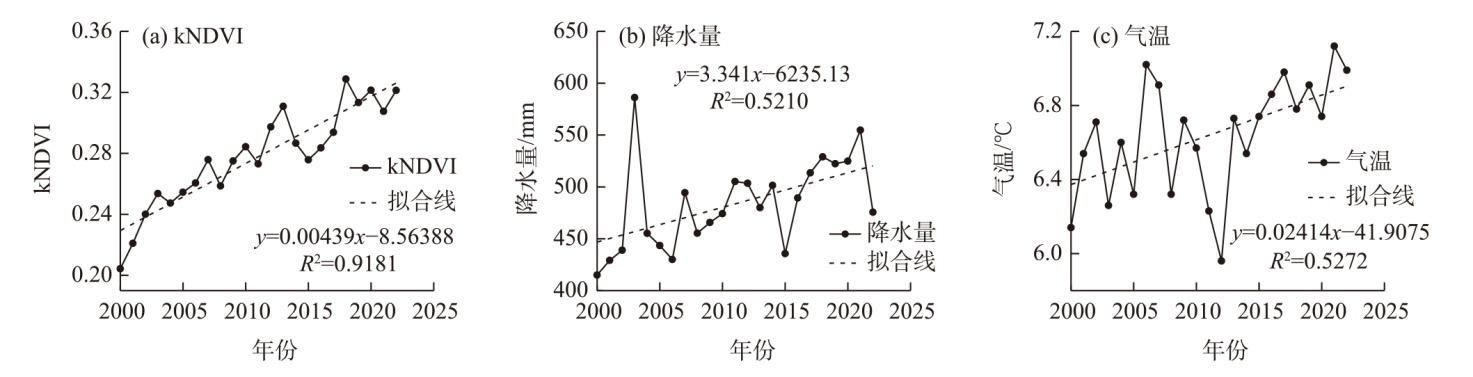
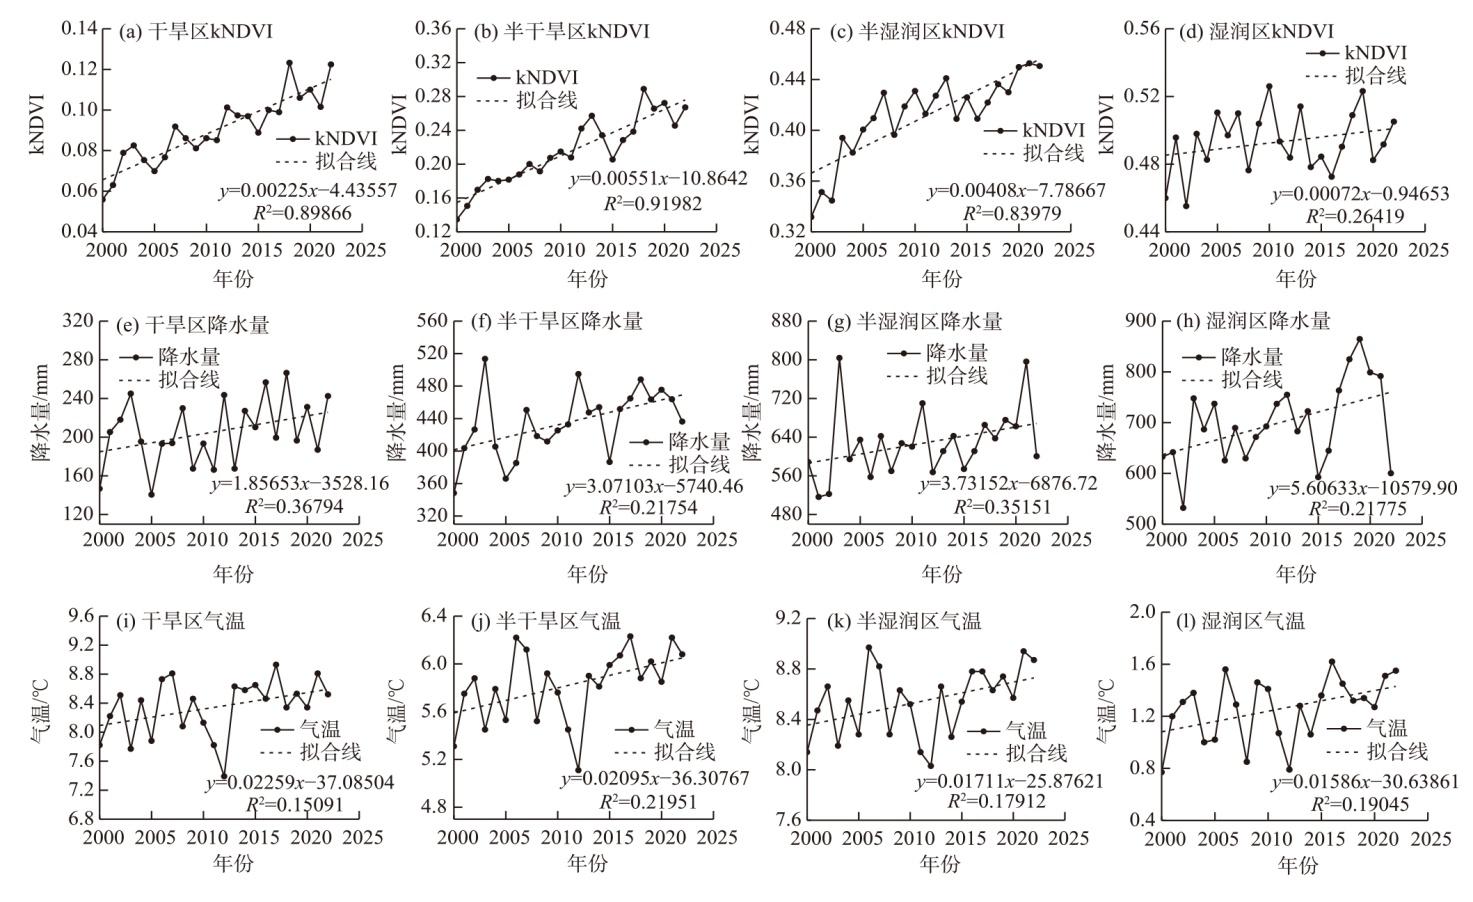
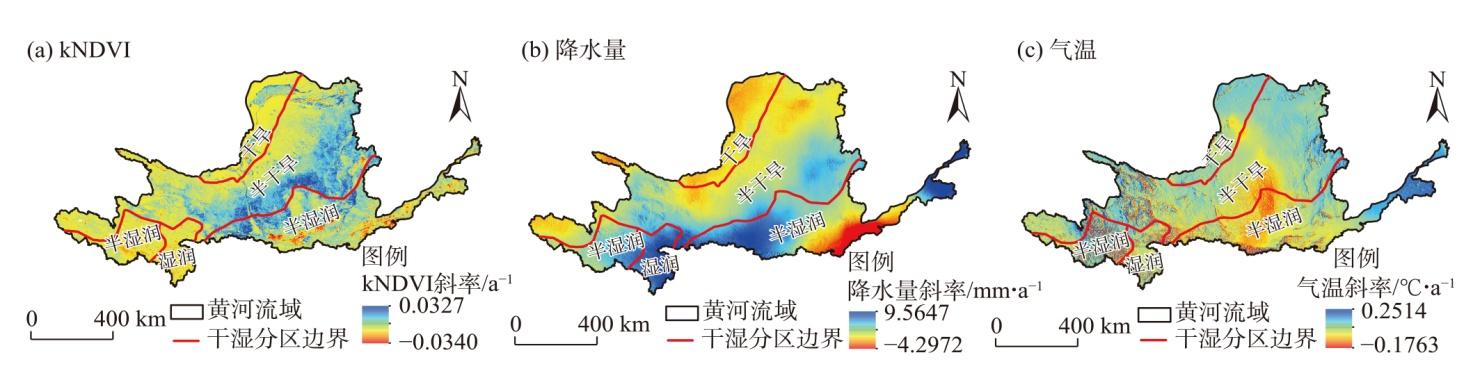
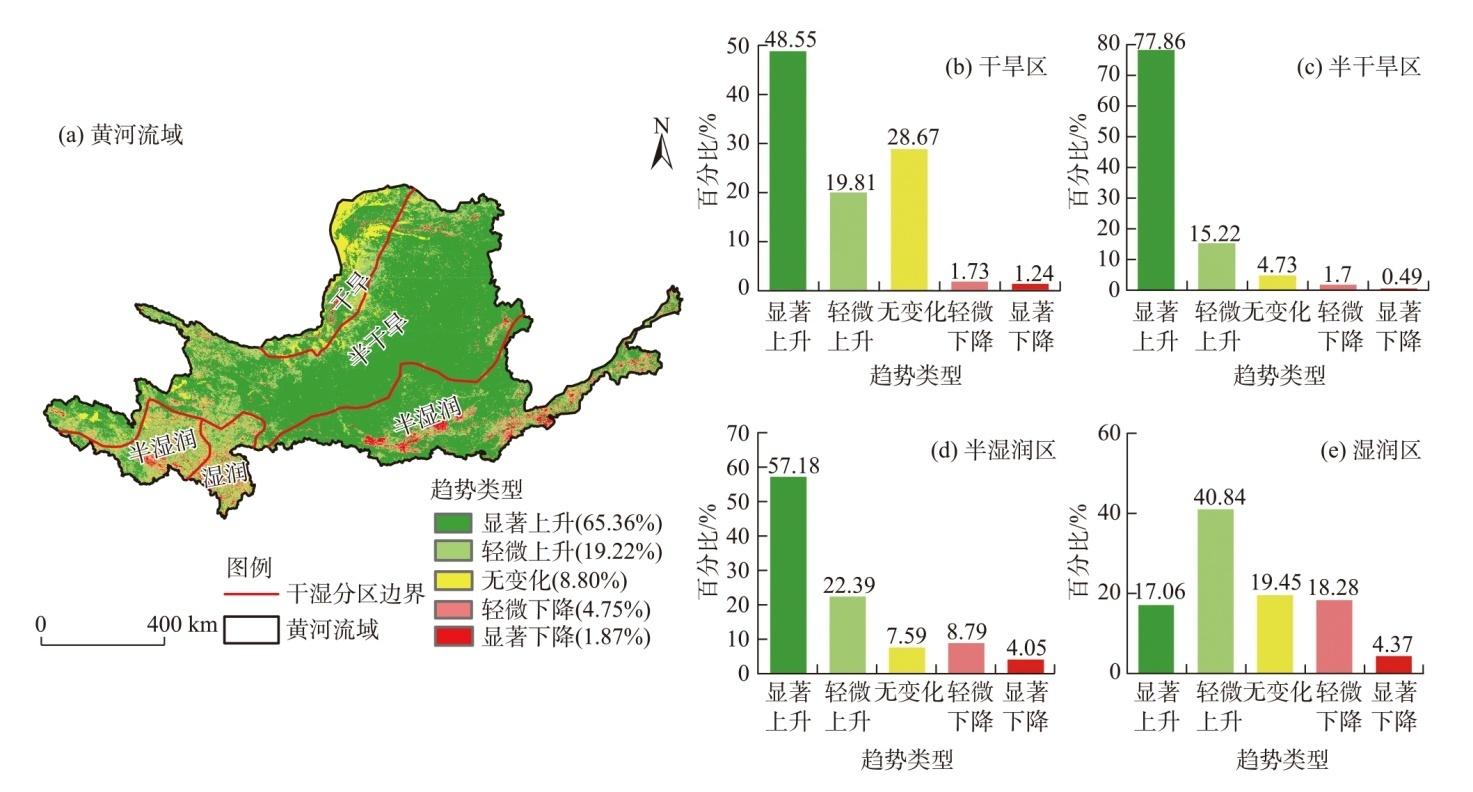
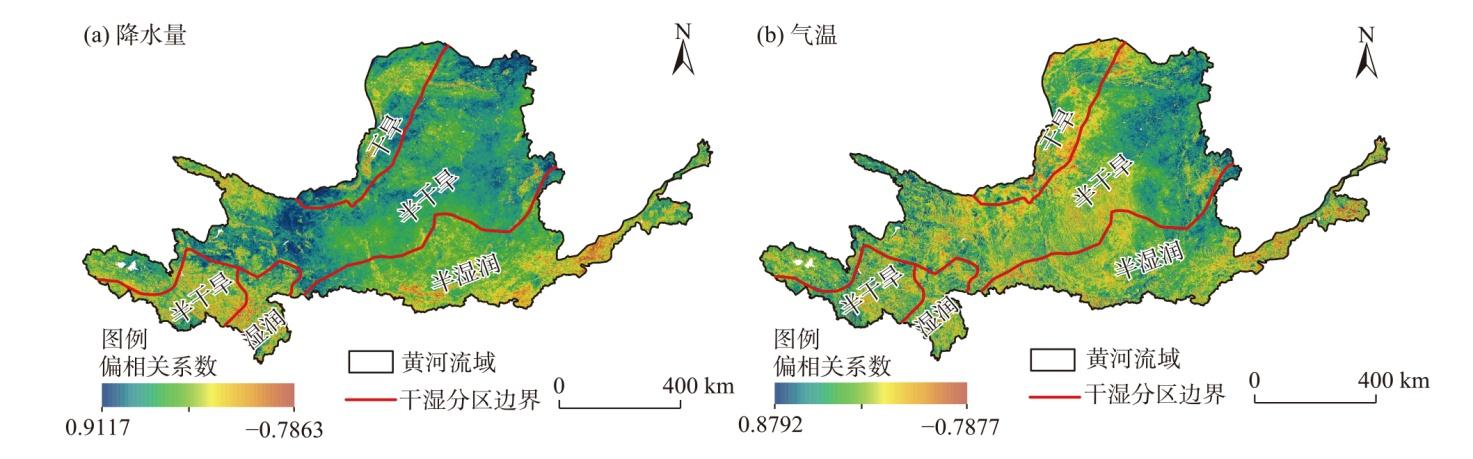
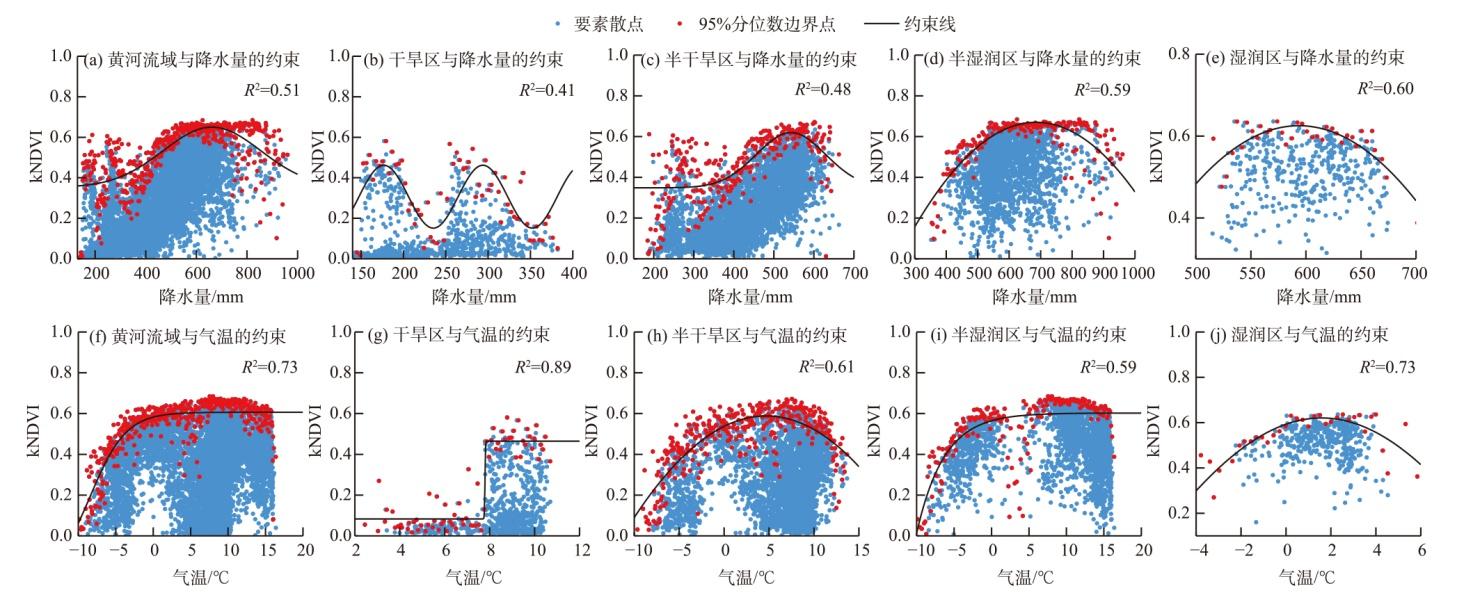
The Yellow River Basin, as a significant ecological protection and economic development area in China, exploring the characteristics of vegetation changes in different dry and wet zones within the basin is crucial for adjusting ecological restoration to address potential threats brought by environmental changes. Based on the kernel normalized difference vegetation index (kNDVI) and key meteorological factors [precipitation (PRE) and temperature (TEM)] from 2000 to 2022, this study utilized multivariate statistical methods to analyze the spatiotemporal patterns of vegetation dynamics in different dry and wet zones within the basin. Additionally, the Geodetector model and constrained effect method were employed to analyze the driving factors of vegetation changes in the Yellow River Basin, and to identify the commonalities and differences in the responses of vegetation changes to meteorological factors in different dry and wet zones. The results show that: (1) The kNDVI values of vegetation in the Yellow River Basin are latitudinally distributed, with the humid zone having the highest average annual kNDVI (0.49). During 2000—2022, 84.58% of the basin showed an upward trend, with the most significant improvements in the arid zone (68.36%) and semi-arid zone (93.08%). (2) Precipitation generally has a stronger influence on vegetation than temperature in the Yellow River Basin, with partial correlation coefficients of 0.36 and 0.19 at the basin scale, respectively. This difference is particularly pronounced in the semi-arid zone, where the partial correlation coefficients of precipitation and temperature reach 0.43 and 0.22, respectively. (3) In terms of spatial heterogeneity, the q value of precipitation (0.5338) is greater than that of temperature (0.2283) at the basin scale. Moreover, the q value of precipitation is highest in the semi-arid zone (0.4519), while the q value of temperature is highest in the semi-humid zone (0.2491). The responses of vegetation dynamics to various meteorological factors in different dry and wet zones exhibit distinct constraint lines. The research findings can provide important references for adjusting and formulating ecological protection strategies in the basin and are of great significance for promoting high-quality development in the Yellow River Basin.
Ruifang WANG , Baoqi LYU , Wenjing ZHANG . Vegetation dynamics and their responses to climate change in the Yellow River Basin: Based on climatic wet and dry zoning scales[J]. Arid Land Geography, 2025 , 48(6) : 973 -984 . DOI: 10.12118/j.issn.1000-6060.2024.416
表1 驱动因子数据来源Tab. 1 Data sources of driving factors |
| 数据集 | 数据类型 | 分辨率/m | 年份 | 数据来源 |
|---|---|---|---|---|
| 降水量 | 栅格 | 1000 | 2000—2022 | 资源环境数据云平台(https://www.resdc.cn/) |
| 气温 | 栅格 | 1000 | 2000—2022 | 资源环境数据云平台(https://www.resdc.cn/) |
| 高程 | 栅格 | 90 | 2019—2021 | 地理空间数据云(https://www.gscloud.cn/) |
| 土地利用类型 | 栅格 | 30 | 2000—2022 | 国家地球系统科学数据中心(https://www.geodata.cn/) |
表2 植被变化分类Tab. 2 Classification of vegetation change |
| SkNDVI | Zs值 | kNDVI趋势 | 面积占比/% |
|---|---|---|---|
| ≥0.0005 | ≥1.96 | 显著上升 | 65.36 |
| ≥0.0005 | -1.96~1.96 | 轻微上升 | 19.22 |
| -0.0005~0.0005 | -1.96~1.96 | 无变化 | 8.80 |
| ≤-0.0005 | -1.96~1.96 | 轻微下降 | 4.75 |
| ≤-0.0005 | ≤-1.96 | 显著下降 | 1.87 |
注: SkNDVI为kNDVI的Theil-Sen斜率估计值;Zs为2000—2022年kNDVI的Mann-Kendall(M-K)趋势检验值。 |
表3 黄河流域不同干湿区下气象因子作用强度q值Tab. 3 q values of meteorological factors in dry and wet zones of different climates in the Yellow River Basin |
| 气象因子 | 黄河流域 | 干旱区 | 半干旱区 | 半湿润区 | 湿润区 |
|---|---|---|---|---|---|
| 降水量 | 0.5338 | 0.0063 | 0.4519 | 0.0798 | 0.0831 |
| 气温 | 0.2283 | 0.0624 | 0.1507 | 0.2491 | 0.1105 |
| 气温与降水量交互影响 | 0.6057 | 0.1472 | 0.5285 | 0.3220 | 0.1904 |
| [1] |
马小红, 林菲, 原黎明, 等. 2000—2020年汾河流域植被覆盖度变化及其对生态工程的响应[J]. 中国沙漠, 2023, 43(3): 86-95.
[
|
| [2] |
罗敏, 孟凡浩, 王云倩, 等. 气候变化下中国植被GPP与土壤水的互馈关系[J]. 地理学报, 2024, 79(1): 218-239.
[
|
| [3] |
吴伶, 刘湘南, 刘美玲, 等. 融合遥感时间序列时空谱信息的森林扰动检测与归因研究进展[J]. 遥感学报, 2024, 28(3): 558-575.
[
|
| [4] |
|
| [5] |
|
| [6] |
韩万强, 靳瑰丽, 岳永寰, 等. 伊犁绢蒿荒漠草地3种主要植物光谱及植被指数改进[J]. 新疆农业科学, 2020, 57(5): 950-957.
[
|
| [7] |
|
| [8] |
康尧, 郭恩亮, 王永芳, 等. 温度植被干旱指数在蒙古高原干旱监测中的应用[J]. 应用生态学报, 2021, 32(7): 2534-2544.
[
|
| [9] |
|
| [10] |
|
| [11] |
|
| [12] |
|
| [13] |
李志杰, 黄贵超, 马訾懿, 等. 基于土地利用变化的城市生境质量时空分异格局及影响因素[J]. 中国城市林业, 2024, 22(2): 135-143.
[
|
| [14] |
宋进喜, 齐贵增, 佘敦先, 等. 中国植被生产力对干湿变化的响应[J]. 地理学报, 2023, 78(7): 1764-1778.
[
|
| [15] |
孙善磊, 孙杰, 李洪利, 等. 典型干湿区植被与气候因子的相互响应关系研究[J]. 安徽农业科学, 2010, 38(9): 4713-4716.
[
|
| [16] |
韩云环, 马柱国, 李明星, 等. 中国不同干湿区植被变化及其与气候因子的关系[J]. 大气科学, 2023, 47(6): 1680-1692.
[
|
| [17] |
田茜, 杨芳, 王召欢, 等. 陆地生态系统土壤CO2排放对模拟增温的响应特征及影响因素[J]. 生态学报, 2024, 44(5): 1928-1939.
[
|
| [18] |
|
| [19] |
|
| [20] |
|
| [21] |
傅楷翔, 贾国栋, 余新晓, 等. 基于改进遥感生态指数的吐鲁番-哈密地区生态环境质量评价及驱动机制分析[J]. 生态学报, 2024, 44(9): 3911-3923.
[
|
| [22] |
刘泽, 陈建平. 北京植被时空变化与气候因子相关性[J]. 地质通报, 2021, 40(12): 2159-2166.
[
|
| [23] |
吴大放, 马佩芳, 李龙, 等. 基于地理探测器的区域土地利用转型时空演变及因子探测——以珠海市为例[J]. 华南师范大学学报(自然科学版), 2023, 55(4): 50-61.
[
|
| [24] |
|
| [25] |
|
| [26] |
薛联青, 肖颖, 刘远洪, 等. 黄河流域植被水分利用效率对干旱的时空累积响应[J]. 水资源保护, 2023, 39(4): 32-41.
[
|
| [27] |
|
| [28] |
郭富印, 刘晓煌, 张文博, 等. 2000—2040年黄河流域(河南段)生境质量时空格局演变及驱动力分析[J]. 现代地质, 2024, 38(3): 599-611.
[
|
| [29] |
|
| [30] |
|
| [31] |
姜凯升, 刘宇, 刘英, 等. 西北地区植被覆盖度与气候因子响应关系探究[J]. 测绘科学, 2023, 48(6): 172-180.
[
|
| [32] |
|
| [33] |
王春雅, 王金牛, 崔霞, 等. 藏东南三江并流核心区植被时空动态变化及其气候驱动力分析[J]. 地理研究, 2021, 40(11): 3191-3207.
[
|
| [34] |
|
| [35] |
|
| [36] |
|
| [37] |
薛联青, 王文壮, 刘远洪, 等. 黄河流域植被总初级生产力对持续性干旱水分亏缺的响应[J]. 水资源保护, 2024, 40(3): 44-51.
[
|
| [38] |
|
| [39] |
|
/
| 〈 |
|
〉 |