
Spatiotemporal heterogeneity and its influencing factors of agricultural carbon emission efficiency in Xinjiang
Received date: 2024-06-03
Revised date: 2024-07-22
Online published: 2026-03-11
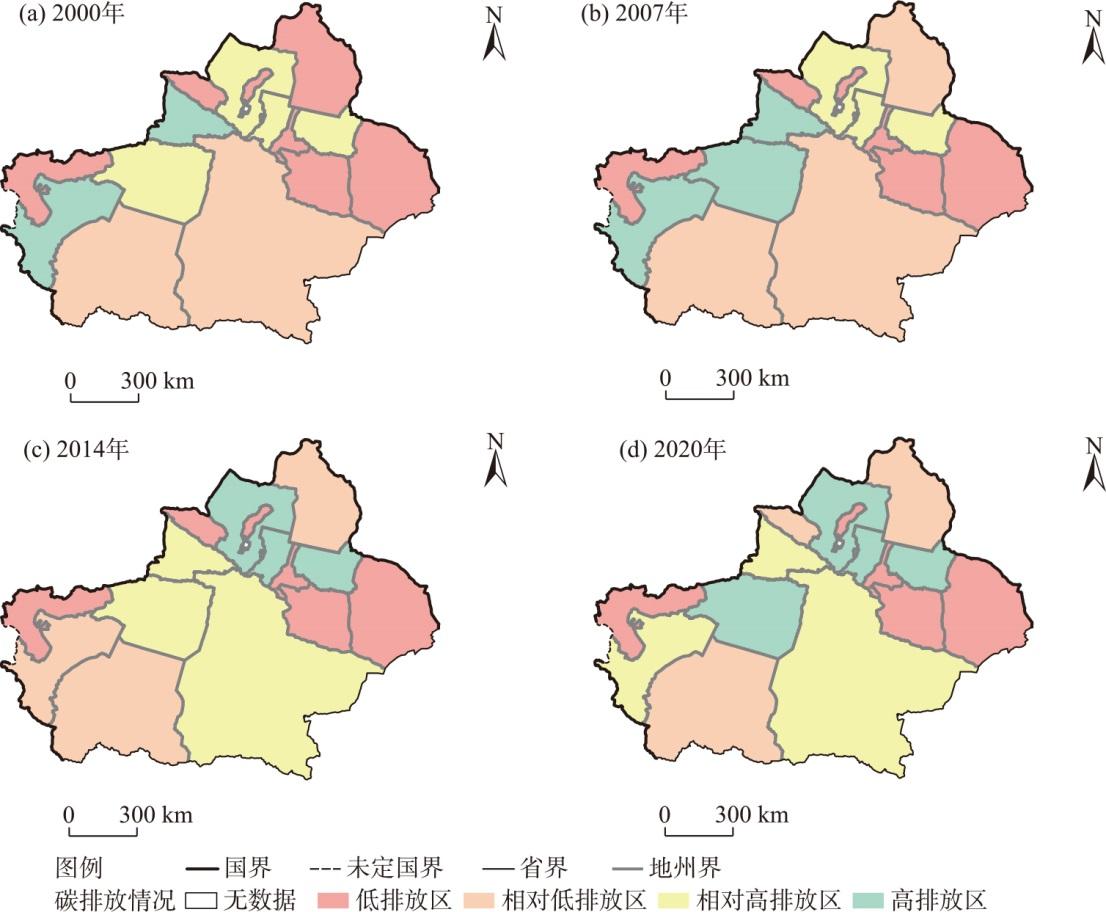
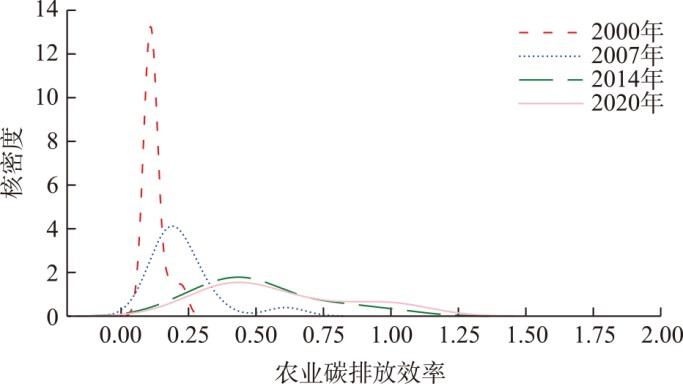
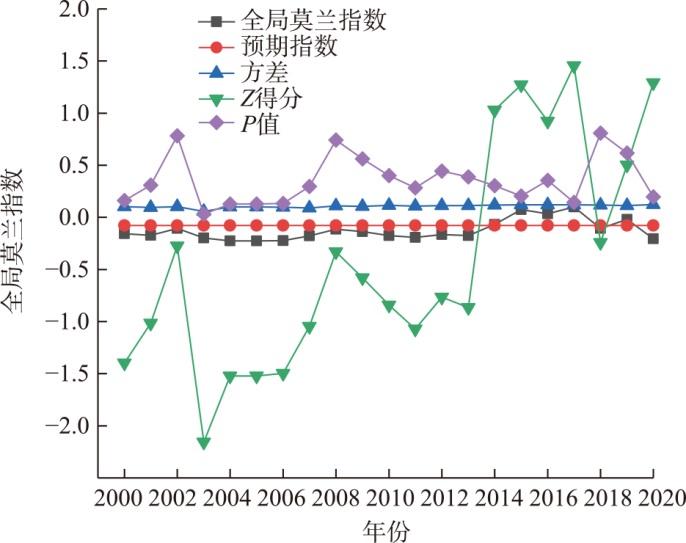
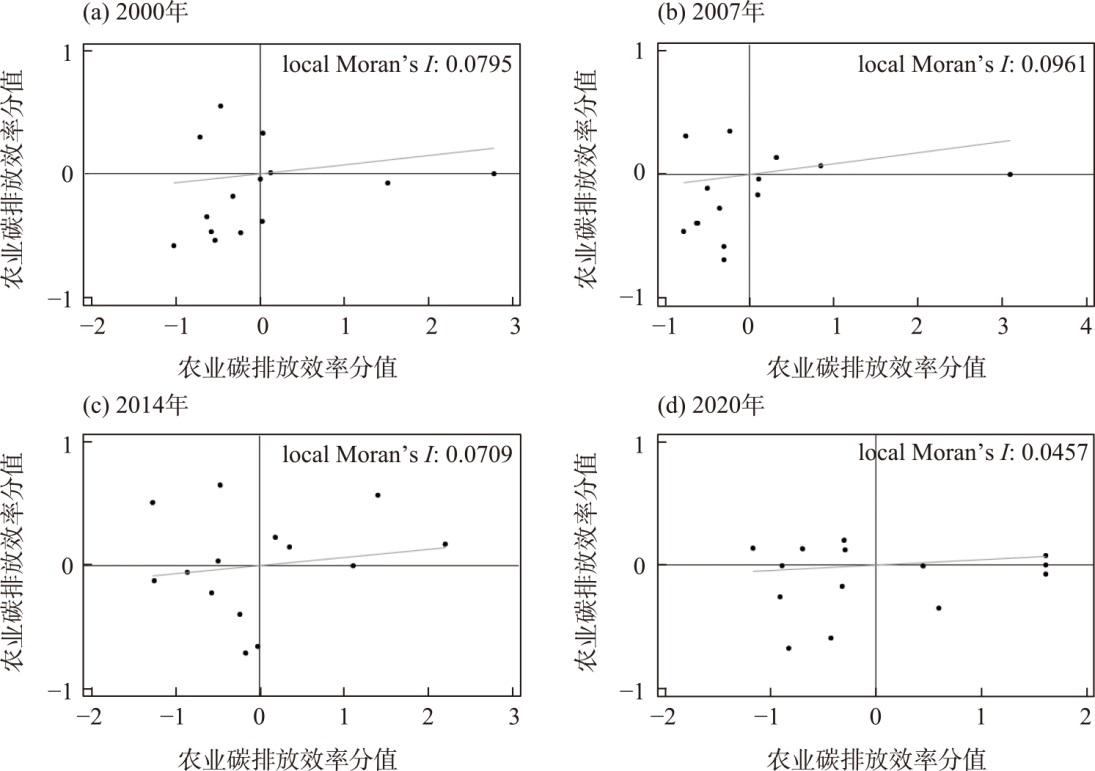
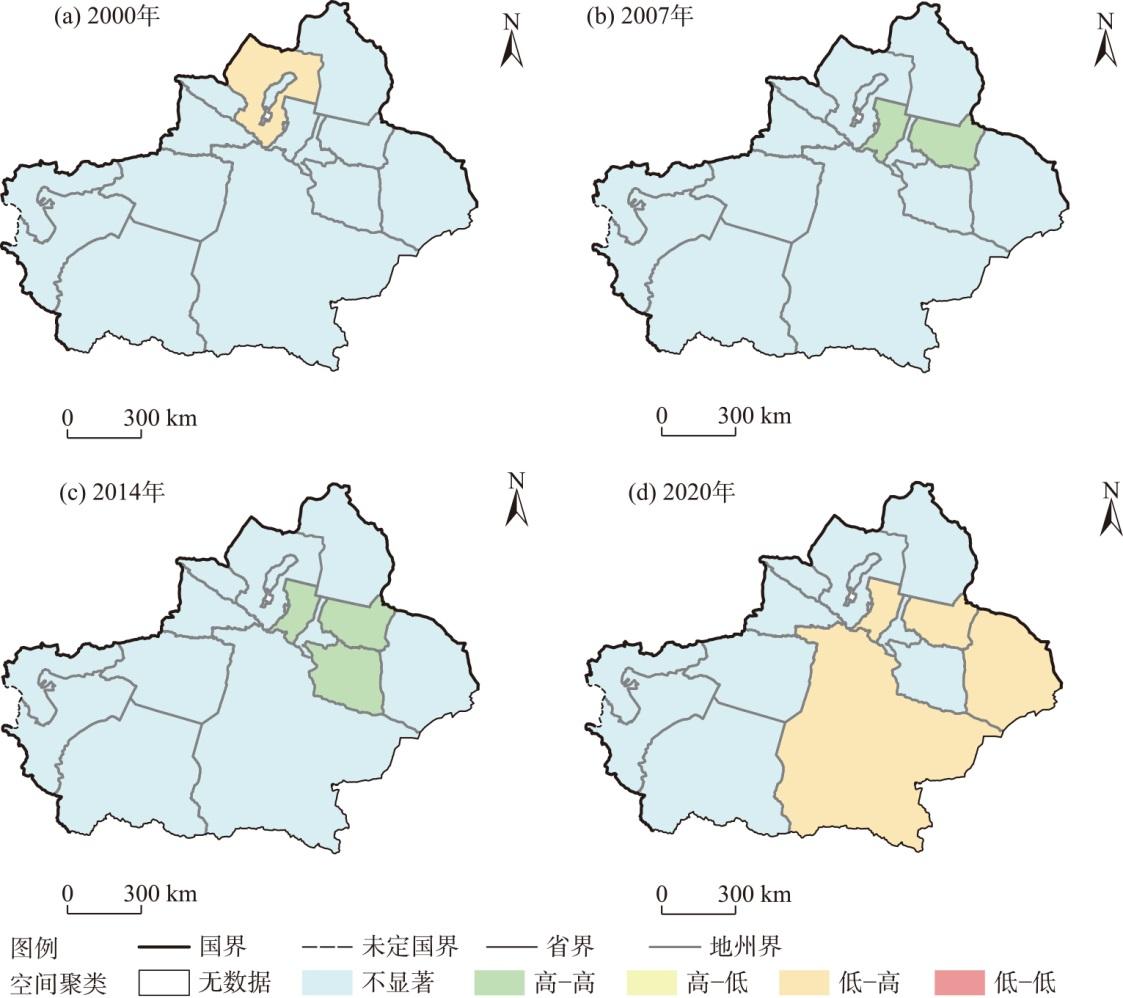
The promotion of low-carbon agricultural development necessitates in-depth research into the spatiotemporal heterogeneity of agricultural carbon emission efficiency and its influencing factors. This will facilitate the acceleration of Xinjiang’s agricultural economic development while driving the green transformation of agricultural production. This study focused on 14 prefectures and cities in Xinjiang from 2000 to 2020 to assess agricultural carbon emission efficiency. The analysis was conducted using the SBM model of nonexpected output and the Malmquist index. The spatial characteristics of agricultural carbon emission efficiency were further examined using the spatial autocorrelation model, and the Tobit model was applied to explore factors influencing efficiency. The findings suggested the following. (1) From 2000 to 2020, the agricultural carbon emission efficiency in Xinjiang followed a “slow-fast-slow” development pattern, with significant inter-regional disparities. (2) In 2000, the Tacheng Prefecture exhibited a low-high agglomeration pattern in case of agricultural carbon emission efficiency. By 2007, the Changji Hui Autonomous Prefecture transitioned to a high-high agglomeration pattern. Further, by 2014, Turpan City and the Changji Hui Autonomous Prefecture were both exhibited high-high agglomeration. In 2020, the Bayingol Mongolian Autonomous Prefecture, Hami City, and Changji Hui Autonomous Prefecture were situated in a low-high agglomeration. Thus, a general decline in regions exhibiting high-high agglomeration and an increase in those with low-high agglomeration was observed. (3) The extent of arable land scale and the overall advancement of the agricultural economy positively affected the agricultural carbon emission efficiency. Further, the agricultural industry structure, crop cultivation structure, and effective irrigation rate negatively affected the agricultural carbon emission efficiency. Thus, this study highlights the spatial and temporal heterogeneity of agricultural carbon emission efficiency and its influencing factors in Xinjiang. The findings are expected to provide theoretical support and empirical evidence for the sustainable development of agriculture in arid areas.
Haijun LIU , Haihong ZHANG , Junjie YAN , Xiang LI , Gaofeng LI . Spatiotemporal heterogeneity and its influencing factors of agricultural carbon emission efficiency in Xinjiang[J]. Arid Land Geography, 2025 , 48(5) : 866 -878 . DOI: 10.12118/j.issn.1000-6060.2024.345
表1 解释变量指标体系Tab. 1 Indicator system for explanatory variables |
| 指标 | 变量 | 变量说明 |
|---|---|---|
| 投入指标 | 化肥投入 | 化肥施用折纯量/104 t |
| 灌溉 | 有效灌溉面积/103 hm2 | |
| 机械投入 | 农用机械总动力/kW | |
| 牲畜投入 | 牛、羊数量采用各年末存 栏量/104头 | |
| 期望产出指标 | 农业总产值 | 农林牧渔总产值/104元 |
| 非期望产出指标 | 农业碳排放量 | 化肥、灌溉、动物养殖等的排放总量/104 t |
表3 新疆14个地州市农业碳排放量Tab. 3 Agricultural carbon emissions in 14 prefectures and cities in Xinjiang |
| 地州市 | 农业碳排放量/107 t | ||||
|---|---|---|---|---|---|
| 2000年 | 2007年 | 2014年 | 2020年 | 2000—2020年平均值 | |
| 乌鲁木齐市 | 7.35 | 11.24 | 0.80 | 2.36 | 5.44 |
| 克拉玛依市 | 0.96 | 2.57 | 5.24 | 4.73 | 3.38 |
| 昌吉州 | 71.33 | 80.49 | 92.08 | 116.06 | 89.99 |
| 伊犁州直 | 158.05 | 184.12 | 63.81 | 73.96 | 119.99 |
| 塔城地区 | 69.50 | 87.03 | 110.48 | 124.99 | 98.00 |
| 阿勒泰地区 | 26.64 | 32.45 | 47.54 | 59.58 | 41.55 |
| 博州 | 19.05 | 20.77 | 26.51 | 37.33 | 25.92 |
| 吐鲁番市 | 8.54 | 8.12 | 14.07 | 19.27 | 12.50 |
| 哈密市 | 11.76 | 11.74 | 18.26 | 16.10 | 14.47 |
| 巴州 | 35.54 | 52.48 | 81.30 | 79.78 | 62.28 |
| 阿克苏地区 | 89.59 | 92.56 | 64.35 | 116.24 | 90.69 |
| 克州 | 10.16 | 8.11 | 3.75 | 7.64 | 7.42 |
| 喀什地区 | 103.31 | 135.71 | 43.60 | 84.82 | 91.86 |
| 和田地区 | 42.87 | 43.98 | 34.66 | 47.86 | 42.34 |
| 平均值 | 46.76 | 55.10 | 43.32 | 56.48 | 50.42 |
| 总量 | 654.65 | 771.37 | 606.45 | 790.72 | 705.83 |
注:昌吉州、伊犁州直、博州、巴州和克州分别为昌吉回族自治州、伊犁哈萨克自治州直属县市、博尔塔拉蒙古自治州、巴音郭楞蒙古自治州和克孜勒苏柯尔克孜自治州的简称。下同。 |
表4 新疆14个地州市农业碳排放效率Tab. 4 Agricultural carbon emission efficiency in 14 prefectures and cities in Xinjiang |
| 地区 | 地州市 | 农业碳排放效率 | |||||
|---|---|---|---|---|---|---|---|
| 2000年 | 2007年 | 2014年 | 2020年 | 2000—2020年平均值 | 区平均值 | ||
| 北疆 | 乌鲁木齐市 | 0.124 | 0.270 | 1.000 | 1.000 | 0.599 | 0.370 |
| 克拉玛依市 | 0.226 | 0.610 | 0.758 | 1.000 | 0.649 | ||
| 昌吉州 | 0.127 | 0.244 | 0.553 | 0.404 | 0.332 | ||
| 伊犁州直 | 0.114 | 0.154 | 0.386 | 0.475 | 0.282 | ||
| 塔城地区 | 0.096 | 0.139 | 0.323 | 0.349 | 0.227 | ||
| 阿勒泰地区 | 0.110 | 0.170 | 0.232 | 0.355 | 0.217 | ||
| 博州 | 0.101 | 0.194 | 0.476 | 0.371 | 0.286 | ||
| 南疆 | 巴州 | 0.123 | 0.243 | 0.591 | 0.509 | 0.367 | 0.319 |
| 阿克苏地区 | 0.099 | 0.156 | 0.461 | 0.502 | 0.305 | ||
| 克州 | 0.084 | 0.135 | 0.235 | 0.283 | 0.184 | ||
| 喀什地区 | 0.102 | 0.194 | 0.508 | 0.739 | 0.386 | ||
| 和田地区 | 0.124 | 0.188 | 0.403 | 0.700 | 0.354 | ||
| 东疆 | 吐鲁番市 | 0.179 | 0.335 | 0.824 | 1.000 | 0.585 | 0.445 |
| 哈密市 | 0.105 | 0.203 | 0.409 | 0.507 | 0.306 | ||
| 平均值 | 0.122 | 0.231 | 0.511 | 0.585 | 0.363 | ||
| 总量 | 1.714 | 3.235 | 7.159 | 8.194 | 5.079 | ||
表5 新疆14个地州市农业碳排放效率的Malmquist指数分析Tab. 5 Malmquist index analysis of agricultural carbon emission efficiency in 14 prefectures and cities in Xinjiang |
| 地区 | 地州市 | 技术 效率 | 技术 进步 | 纯技术 效率 | 规模 效率 | 全要素 生产率 |
|---|---|---|---|---|---|---|
| 北疆 | 乌鲁木齐市 | 1.284 | 1.116 | 1.255 | 1.022 | 1.433 |
| 克拉玛依市 | 1.000 | 1.054 | 1.000 | 1.000 | 1.054 | |
| 昌吉州 | 1.134 | 0.997 | 1.000 | 1.134 | 1.131 | |
| 伊犁州直 | 1.162 | 1.024 | 1.000 | 1.162 | 1.189 | |
| 塔城地区 | 1.116 | 0.999 | 1.042 | 1.071 | 1.115 | |
| 阿勒泰地区 | 1.166 | 1.006 | 1.029 | 1.133 | 1.174 | |
| 博州 | 1.181 | 0.994 | 1.074 | 1.099 | 1.174 | |
| 南疆 | 巴州 | 0.974 | 1.102 | 1.000 | 0.974 | 1.074 |
| 阿克苏地区 | 1.156 | 1.041 | 1.156 | 1.001 | 1.204 | |
| 克州 | 0.936 | 1.139 | 0.875 | 1.070 | 1.067 | |
| 喀什地区 | 1.160 | 1.094 | 1.000 | 1.160 | 1.268 | |
| 和田地区 | 1.206 | 0.978 | 1.032 | 1.169 | 1.179 | |
| 东疆 | 吐鲁番市 | 1.000 | 1.047 | 1.000 | 1.000 | 1.047 |
| 哈密市 | 1.087 | 0.980 | 0.797 | 1.364 | 1.065 |
表6 农业碳排放效率影响因素指标选取Tab. 6 Selection of indicators for factors influencing agricultural carbon emission efficiency |
| 变量名称 | 指标解释 |
|---|---|
| 农业产业结构(X1) | 农业生产总值与农林牧渔总产值之比 |
| 作物种植结构(X2) | 粮食种植面积与作物播种面积之比 |
| 耕地规模化程度(X3) | 耕地面积与农业从业人员之比 |
| 有效灌溉率(X4) | 有效灌溉面积与耕地面积之比 |
| 农业经济发展水平(X5) | 农林牧渔总产值与农村人口之比 |
表7 变量相关性检验Tab. 7 Variable correlation tests |
| 变量 | Y | X1 | X2 | X3 | X4 | X5 |
|---|---|---|---|---|---|---|
| Y | 1.000 | -0.126 | -0.381 | 0.170 | -0.097 | 0.466 |
| X1 | -0.126 | 1.000 | -0.003 | -0.086 | 0.059 | -0.411 |
| X2 | -0.381 | -0.003 | 1.000 | -0.083 | -0.030 | -0.371 |
| X3 | 0.170 | -0.086 | -0.083 | 1.000 | -0.020 | 0.332 |
| X4 | -0.097 | 0.059 | -0.030 | -0.020 | 1.000 | -0.055 |
| X5 | 0.466 | -0.411 | -0.371 | 0.332 | -0.055 | 1.000 |
注:Y为农业碳排放效率。 |
表8 农业碳排放效率影响因素的Tobit回归结果Tab. 8 Tobit regression results of factors influencing agricultural carbon emission efficiency |
| 变量 | 系数 | 标准误差 | Z值 | P值 | 95%置信区间 |
|---|---|---|---|---|---|
| X1 | -0.346 | 0.188 | -1.840 | 0.066 | [-0.714, 0.022] |
| X2 | -0.245 | 0.081 | -3.030 | 0.002 | [-0.403, -0.087] |
| X3 | 0.013 | 0.020 | 0.670 | 0.504 | [-0.025, 0.051] |
| X4 | -0.008 | 0.004 | -1.900 | 0.058 | [-0.016, 0.000] |
| X5 | 0.011 | 0.002 | 6.040 | 0.000 | [0.008, 0.015] |
| 常数项 | 0.601 | 0.125 | 4.810 | 0.000 | [0.356, 0.845] |
| [1] |
张帆, 蔡颖, 邓祥征, 等. 作物-牲畜-生物能源综合系统对中国农业源温室气体的影响评估[J]. 地理学报, 2024, 79(1): 28-44.
[
|
| [2] |
赵先超, 彭竞霄, 胡艺觉, 等. 基于夜间灯光数据的湖南省县域碳排放时空格局及影响因素研究[J]. 生态科学, 2022, 41(1): 91-99.
[
|
| [3] |
马欣雨, 穆月英. 碳视角下的粮食生产环境技术效率评价——基于超效率SBM-Undesirable模型[J]. 中国农业资源与区划, 2024, 45(3): 26-35.
[
|
| [4] |
陈宇斌, 王森, 陆杉. 农产品贸易对农业碳排放的影响——兼议数字乡村发展的门槛效应[J]. 华中农业大学学报(社会科学版), 2022(6): 45-57.
[
|
| [5] |
李秋萍, 李长建, 肖小勇, 等. 中国农业碳排放的空间效应研究[J]. 干旱区资源与环境, 2015, 29(4): 30-35.
[
|
| [6] |
|
| [7] |
董红敏, 李玉娥, 陶秀萍, 等. 中国农业源温室气体排放与减排技术对策[J]. 农业工程学报, 2008, 24(10): 269-273.
[
|
| [8] |
|
| [9] |
张恒硕, 李绍萍, 彭民. 中国农村能源消费碳排放区域非均衡性及驱动因素动态识别[J]. 中国农村经济, 2022(1): 112-134.
[
|
| [10] |
田云, 李波, 张俊飚. 我国农地利用碳排放的阶段特征及因素分解研究[J]. 中国地质大学学报(社会科学版), 2011, 11(1): 59-63.
[
|
| [11] |
田云, 林子娟. 中国省域农业碳排放效率与经济增长的耦合协调[J]. 中国人口·资源与环境, 2022, 32(4): 13-22.
[
|
| [12] |
|
| [13] |
田云, 张俊飚, 吴贤荣, 等. 碳排放约束下的中国农业生产率增长与分解研究[J]. 干旱区资源与环境, 2015, 29(11): 7-12.
[
|
| [14] |
吴昊玥, 黄瀚蛟, 何宇, 等. 中国农业碳排放效率测度、空间溢出与影响因素[J]. 中国生态农业学报, 2021, 29(10): 1762-1773.
[
|
| [15] |
尚杰, 吉雪强, 石锐, 等. 中国农业碳排放效率空间关联网络结构及驱动因素研究[J]. 中国生态农业学报, 2022, 30(4): 543-557.
[
|
| [16] |
吴贤荣, 张俊飚, 田云, 等. 中国省域农业碳排放: 测算、效率变动及影响因素研究——基于DEA-Malmquist指数分解方法与Tobit模型运用[J]. 资源科学, 2014, 36(1): 129-138.
[
|
| [17] |
杜娅明, 白永平, 梁建设, 等. 黄河流域旅游业碳排放效率综合测度及影响因素研究[J]. 干旱区地理, 2023, 46(12): 2074-2085.
[
|
| [18] |
解春艳, 黄传峰, 徐浩. 环境规制下中国农业技术效率的区域差异与影响因素——基于农业碳排放与农业面源污染双重约束的视角[J]. 科技管理研究, 2021, 41(15): 184-190.
[
|
| [19] |
田云, 王梦晨. 湖北省农业碳排放效率时空差异及影响因素[J]. 中国农业科学, 2020, 53(24): 5063-5072.
[
|
| [20] |
朱巧娴, 梅昀, 陈银蓉, 等. 基于碳排放测算的湖北省土地利用结构效率的DEA模型分析与空间分异研究[J]. 经济地理, 2015, 35(12): 176-184.
[
|
| [21] |
李明, 肖海峰. 畜产品进口对畜牧业碳排放的影响及其空间效应[J]. 中国农业大学学报, 2024, 29(2): 176-191.
[
|
| [22] |
段华平, 张悦, 赵建波, 等. 中国农田生态系统的碳足迹分析[J]. 水土保持学报, 2011, 25(5): 203-208.
[
|
| [23] |
|
| [24] |
|
| [25] |
|
| [26] |
|
| [27] |
夏文浩, 王铭扬, 姜磊. 新疆农业碳排放强度时空变化趋势与收敛分析[J]. 干旱区地理, 2023, 46(7): 1145-1154.
[
|
| [28] |
王太祥, 王腾, 吴林海. 西北干旱区农地利用碳排放与农业经济增长的响应关系[J]. 中国农业资源与区划, 2017, 38(4): 170-176.
[
|
/
| 〈 |
|
〉 |