
Error analysis of multi-source land surface temperature products in the Heihe River Basin based on in-situ data
Received date: 2024-02-08
Revised date: 2025-02-14
Online published: 2026-03-11
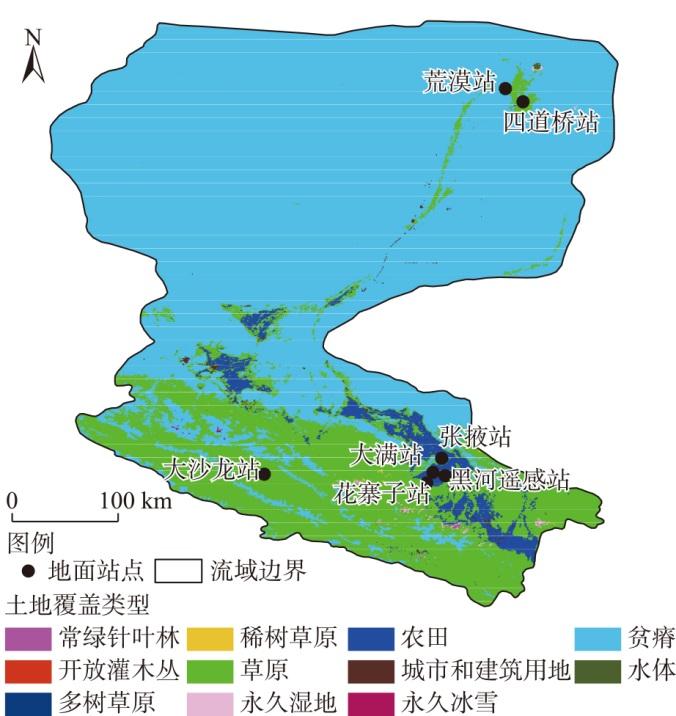
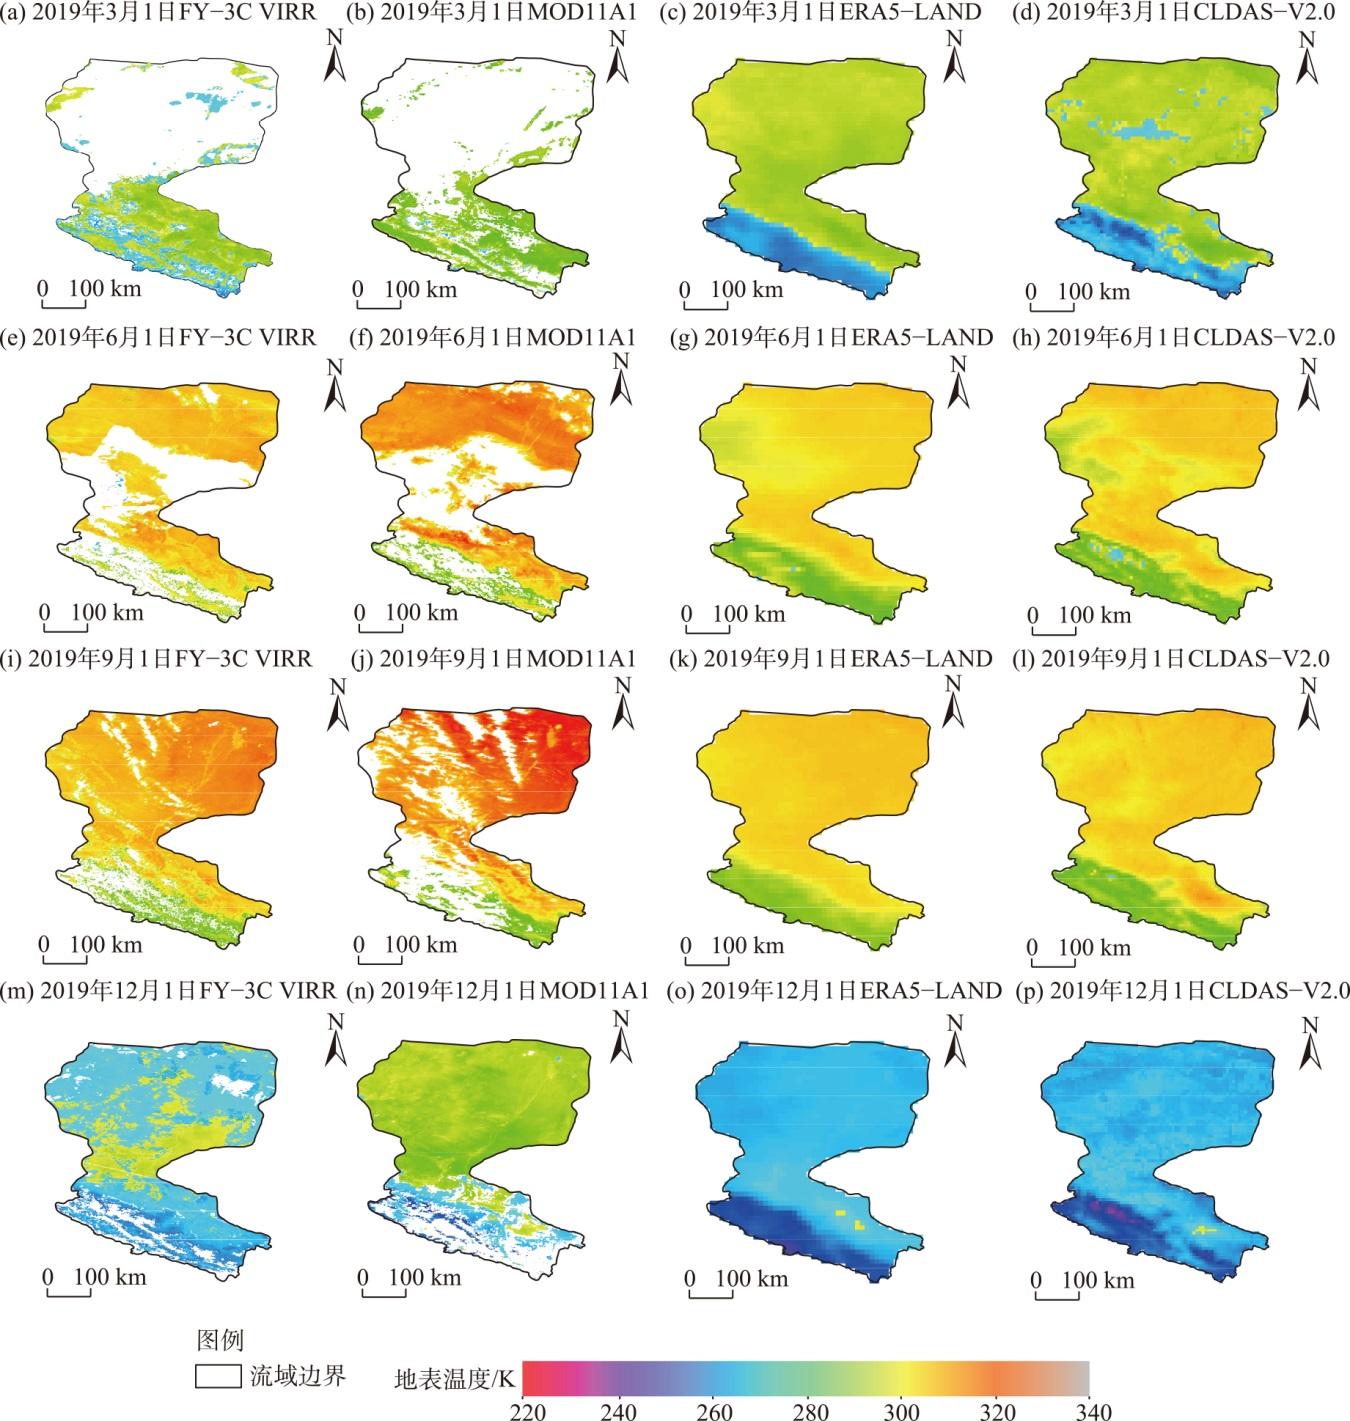
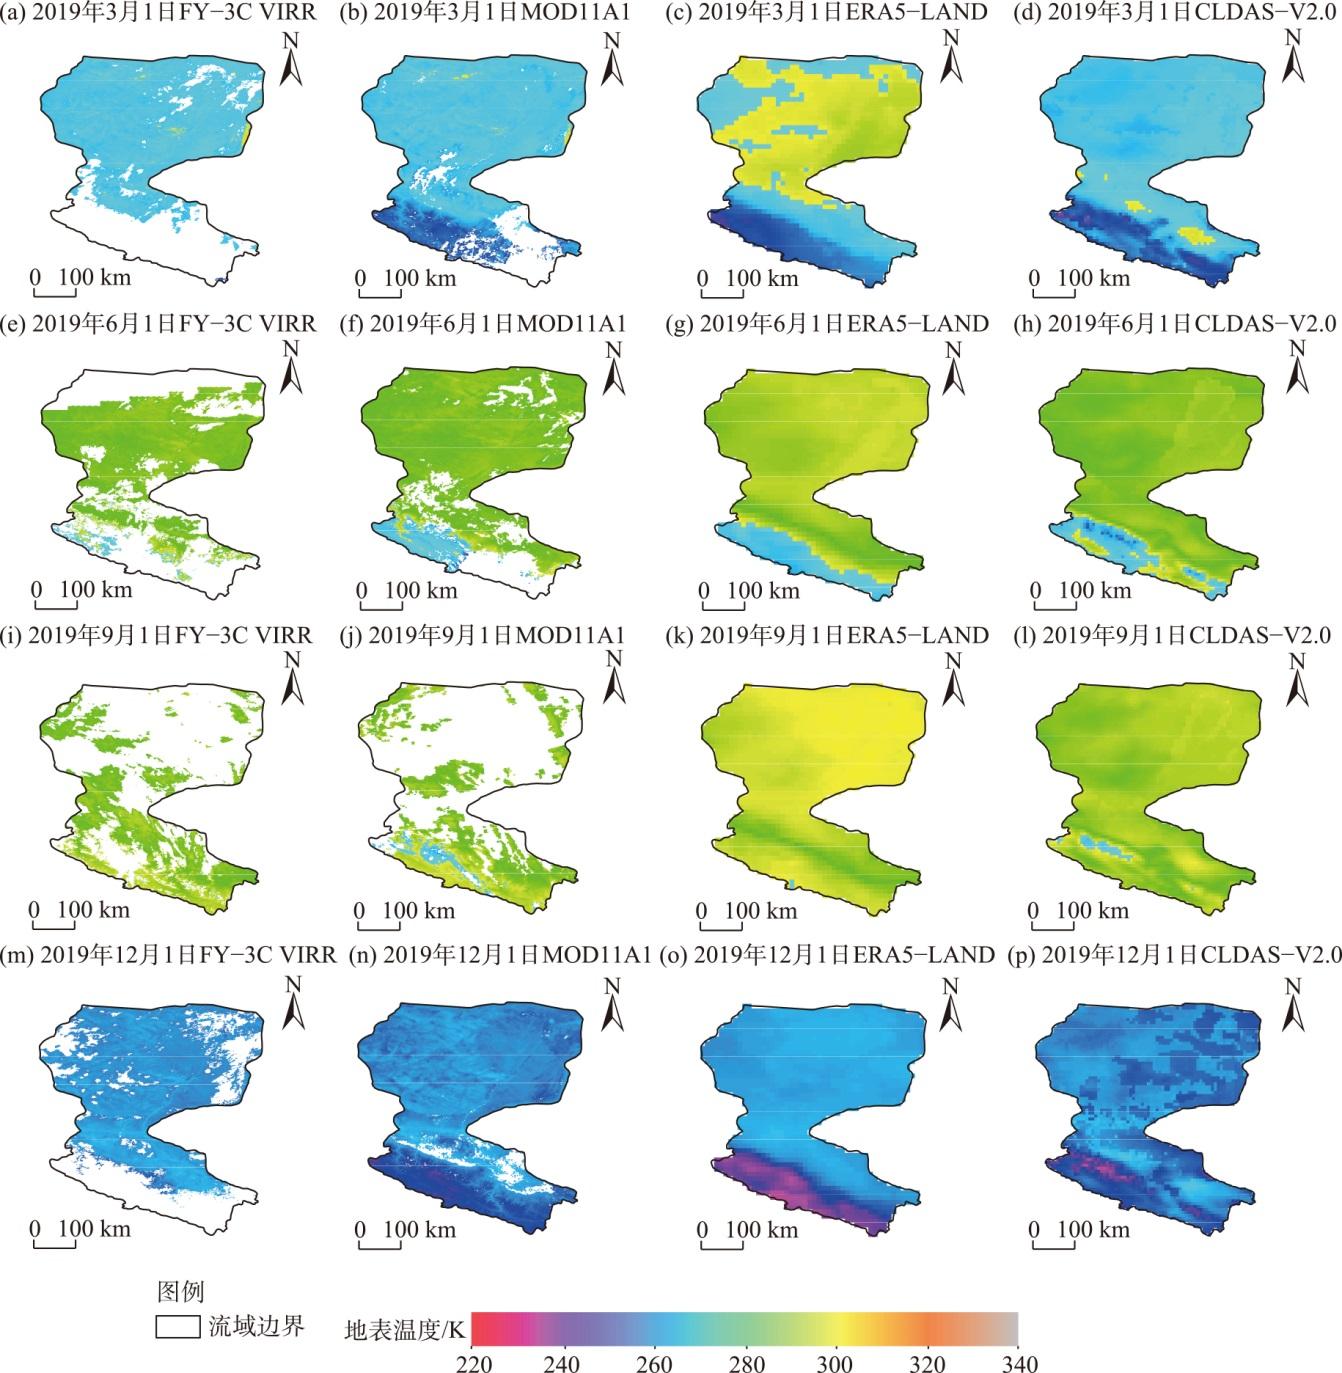
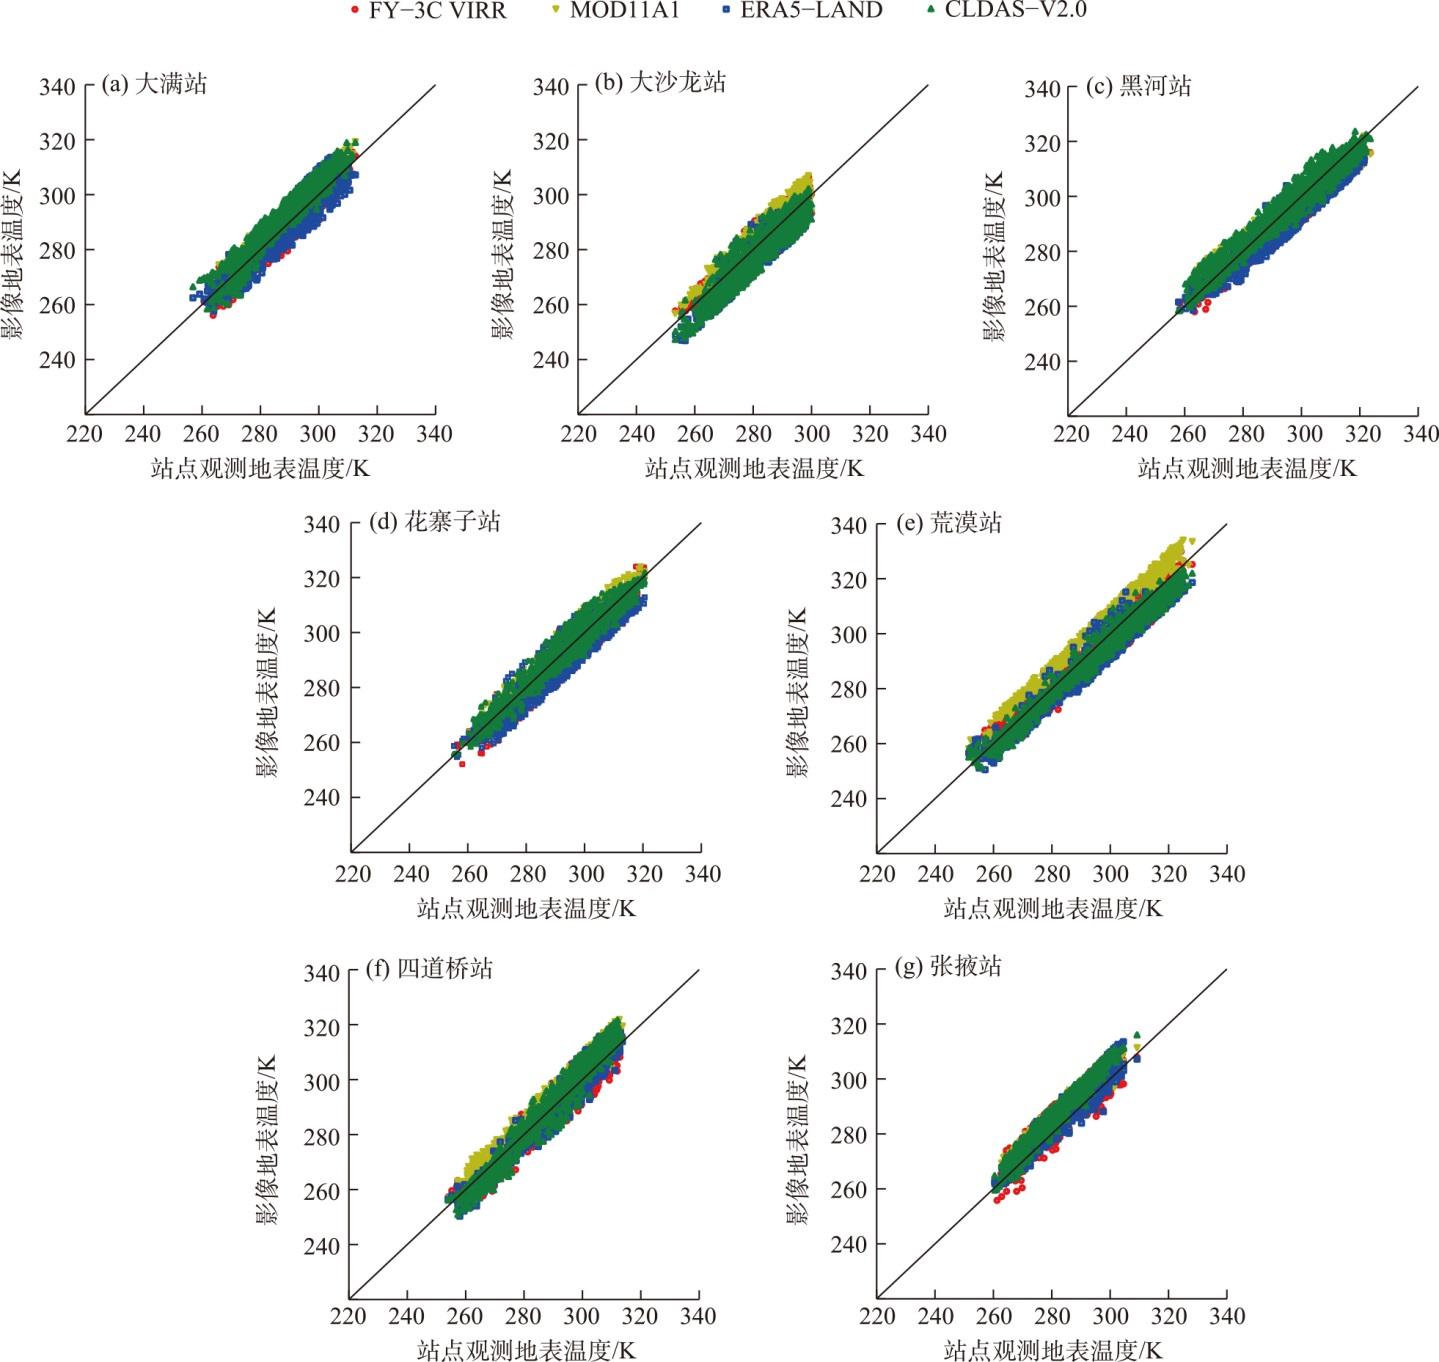
This study used in-situ land surface temperature observation data (from 2017 to 2019) from seven stations in the Heihe River Basin, northern Gansu Province, China, to evaluate the errors of four land surface temperature products: the Fengyun-3C visible and infrared radiometer (FY-3C VIRR) land surface temperature product, the Terra moderate resolution imaging spectroradiometer (MOD11A1/MOD11C3) land surface temperature product, the European Center for medium-range weather forecasts fifth-generation land surface reanalysis dataset (ERA5-LAND), and the China Meteorological Administration land data assimilation system (CLDAS-V2.0). Bias (BIAS), root mean square error (RMSE), correlation coefficient (CC), and ratio of standard deviation (RSD), were employed as statistical metrics for analyzing errors across different temporal scales. The results indicated the following. (1) All four land surface temperature products exhibited a general spatial pattern of higher temperature in the south and lower temperature in the north. However, the FY-3C VIRR and MOD11A1 products exhibited finer spatial details. (2) The FY-3C VIRR daytime land surface temperature product demonstrated relatively lower BIAS and RMSE values, indicating higher accuracy. Further, the MOD11A1 daytime land surface temperature product yielded the highest CC values, ranging across 0.957-0.987. However, it also produced larger errors. This was attributed to the tendency of the MOD11A1 daytime product to overestimate temperatures. (3) The MOD11A1 nighttime land surface temperature product outperformed the FY-3C VIRR, ERA5-LAND, and CLDAS-V2.0 nighttime products in terms of accuracy. Among these, the CLDAS-V2.0 nighttime product exhibited the largest errors. (4) For the FY-3C VIRR, MOD11A1, and ERA5-LAND products, the nighttime land surface temperature accuracy surpassed those of their respective daytime products. Conversely, the CLDAS-V2.0 daytime land surface temperature product exhibited higher accuracy than its nighttime counterparts.
Key words: land surface temperature; FY-3C VIRR; MODIS; ERA5-LAND; CLDAS-V2.0; Heihe River Basin
Xu LI , Hongnan JIANG , Jianhui XU . Error analysis of multi-source land surface temperature products in the Heihe River Basin based on in-situ data[J]. Arid Land Geography, 2025 , 48(5) : 765 -777 . DOI: 10.12118/j.issn.1000-6060.2024.087
表1 站点信息Tab. 1 Station information |
| 站点 | 土地覆盖类型 | 海拔/m | 可用年份 |
|---|---|---|---|
| 大满站(DM) | 农田 | 1556 | 2017—2019 |
| 大沙龙站(DSL) | 草原 | 3739 | 2017—2019 |
| 黑河遥感站(HH) | 农田 | 1560 | 2017—2019 |
| 花寨子站(HZZ) | 草原 | 1731 | 2017—2019 |
| 荒漠站(HM) | 贫瘠 | 1054 | 2017—2019 |
| 四道桥站(SDQ) | 草原 | 873 | 2017—2019 |
| 张掖站(ZY) | 农田 | 1460 | 2017—2019 |
图2 白天地表温度产品的空间分布注:FY-3C VIRR为风云三号C星可见光红外扫描辐射计;MOD11A1为Terra卫星中分辨率成像光谱仪;ERA5-LAND为欧洲中期天气预报中心第五代陆面再分析数据集;CLDAS-V2.0为中国气象局陆面数据同化系统。下同。 Fig. 2 Spatial distributions of daytime land surface temperature data |
表2 站点日尺度白天地表温度产品评价结果Tab. 2 Evaluation results of daytime land surface temperature data performance at the daily scale across stations |
| 站点 | FY-3C VIRR | MOD11A1 | |||||||
|---|---|---|---|---|---|---|---|---|---|
| BIAS/K | RMSE/K | CC | RSD | BIAS/K | RMSE/K | CC | RSD | ||
| 四道桥站 | 0.673 | 3.771 | 0.974 | 0.017 | 4.236 | 5.240 | 0.980 | 0.025 | |
| 大满站 | -0.686 | 3.337 | 0.968 | 0.030 | 3.638 | 4.391 | 0.977 | 0.000 | |
| 大沙龙站 | 0.871 | 3.422 | 0.962 | 0.035 | 3.557 | 4.804 | 0.957 | 0.027 | |
| 黑河站 | -2.171 | 4.695 | 0.975 | 0.145 | -0.174 | 4.391 | 0.978 | 0.208 | |
| 荒漠站 | -0.694 | 4.255 | 0.979 | 0.080 | 6.238 | 6.907 | 0.987 | 0.007 | |
| 花寨子站 | -1.198 | 3.981 | 0.970 | 0.016 | 2.773 | 4.062 | 0.979 | 0.030 | |
| 张掖站 | 3.028 | 4.831 | 0.956 | 0.035 | 4.745 | 5.322 | 0.978 | 0.031 | |
| 平均值 | -0.025 | 4.042 | 0.969 | 0.051 | 3.573 | 5.017 | 0.977 | 0.047 | |
| 站点 | ERA5-LAND | CLDAS-V2.0 | |||||||
| BIAS/K | RMSE/K | CC | RSD | BIAS/K | RMSE/K | CC | RSD | ||
| 四道桥站 | -0.851 | 3.951 | 0.983 | 0.146 | 1.362 | 4.444 | 0.983 | 0.191 | |
| 大满站 | -0.245 | 4.505 | 0.947 | 0.136 | 4.143 | 5.743 | 0.962 | 0.137 | |
| 大沙龙站 | -3.780 | 5.385 | 0.934 | 0.033 | -2.731 | 5.046 | 0.938 | 0.120 | |
| 黑河站 | -3.671 | 5.225 | 0.974 | 0.099 | 0.913 | 4.078 | 0.970 | 0.074 | |
| 荒漠站 | -4.269 | 5.560 | 0.983 | 0.051 | -2.545 | 3.872 | 0.989 | 0.056 | |
| 花寨子站 | -3.705 | 5.900 | 0.950 | 0.045 | 0.759 | 3.887 | 0.968 | 0.000 | |
| 张掖站 | 2.759 | 4.241 | 0.975 | 0.136 | 5.837 | 6.530 | 0.979 | 0.147 | |
| 平均值 | -1.966 | 4.967 | 0.964 | 0.092 | 1.105 | 4.800 | 0.970 | 0.104 | |
注:BISA为偏差;RMSE为均方根误差;CC为相关系数;RSD为标准偏差比。下同。 |
表3 站点日尺度夜间地表温度产品评价结果Tab. 3 Evaluation results of nighttime land surface temperature data performance at the daily scale across stations |
| 站点 | FY-3C VIRR | MOD11A1 | |||||||
|---|---|---|---|---|---|---|---|---|---|
| BIAS/K | RMSE/K | CC | RSD | BIAS/K | RMSE/K | CC | RSD | ||
| 四道桥站 | -1.115 | 2.928 | 0.982 | 0.047 | -1.668 | 2.678 | 0.990 | 0.052 | |
| 大满站 | -1.715 | 3.069 | 0.978 | 0.027 | -1.579 | 2.447 | 0.988 | 0.021 | |
| 大沙龙站 | -0.577 | 2.682 | 0.962 | 0.021 | -0.938 | 2.312 | 0.981 | 0.027 | |
| 黑河站 | -1.324 | 3.010 | 0.981 | 0.082 | -1.563 | 2.308 | 0.992 | 0.050 | |
| 荒漠站 | -2.161 | 3.096 | 0.988 | 0.033 | -1.575 | 2.402 | 0.993 | 0.027 | |
| 花寨子站 | -1.106 | 2.904 | 0.970 | 0.016 | -1.648 | 2.648 | 0.981 | 0.018 | |
| 张掖站 | -1.162 | 3.358 | 0.958 | 0.040 | -0.877 | 2.551 | 0.976 | 0.077 | |
| 平均值 | -1.309 | 3.007 | 0.974 | 0.038 | -1.407 | 2.478 | 0.986 | 0.039 | |
| 站点 | ERA5-LAND | CLDAS-V2.0 | |||||||
| BIAS/K | RMSE/K | CC | RSD | BIAS/K | RMSE/K | CC | RSD | ||
| 四道桥站 | 5.617 | 6.375 | 0.979 | 0.002 | 3.864 | 5.281 | 0.971 | 0.026 | |
| 大满站 | -0.081 | 2.818 | 0.975 | 0.066 | 5.676 | 6.272 | 0.980 | 0.076 | |
| 大沙龙站 | -3.411 | 4.817 | 0.973 | 0.171 | 0.972 | 3.573 | 0.944 | 0.049 | |
| 黑河站 | -0.187 | 3.259 | 0.979 | 0.154 | 5.351 | 5.926 | 0.980 | 0.027 | |
| 荒漠站 | 3.549 | 4.067 | 0.992 | 0.045 | 1.196 | 2.429 | 0.991 | 0.045 | |
| 花寨子站 | -1.499 | 3.217 | 0.969 | 0.025 | 5.184 | 5.680 | 0.985 | 0.087 | |
| 张掖站 | -0.472 | 2.953 | 0.968 | 0.077 | 3.175 | 4.519 | 0.978 | 0.200 | |
| 平均值 | 0.502 | 3.929 | 0.976 | 0.077 | 3.631 | 4.811 | 0.976 | 0.073 | |
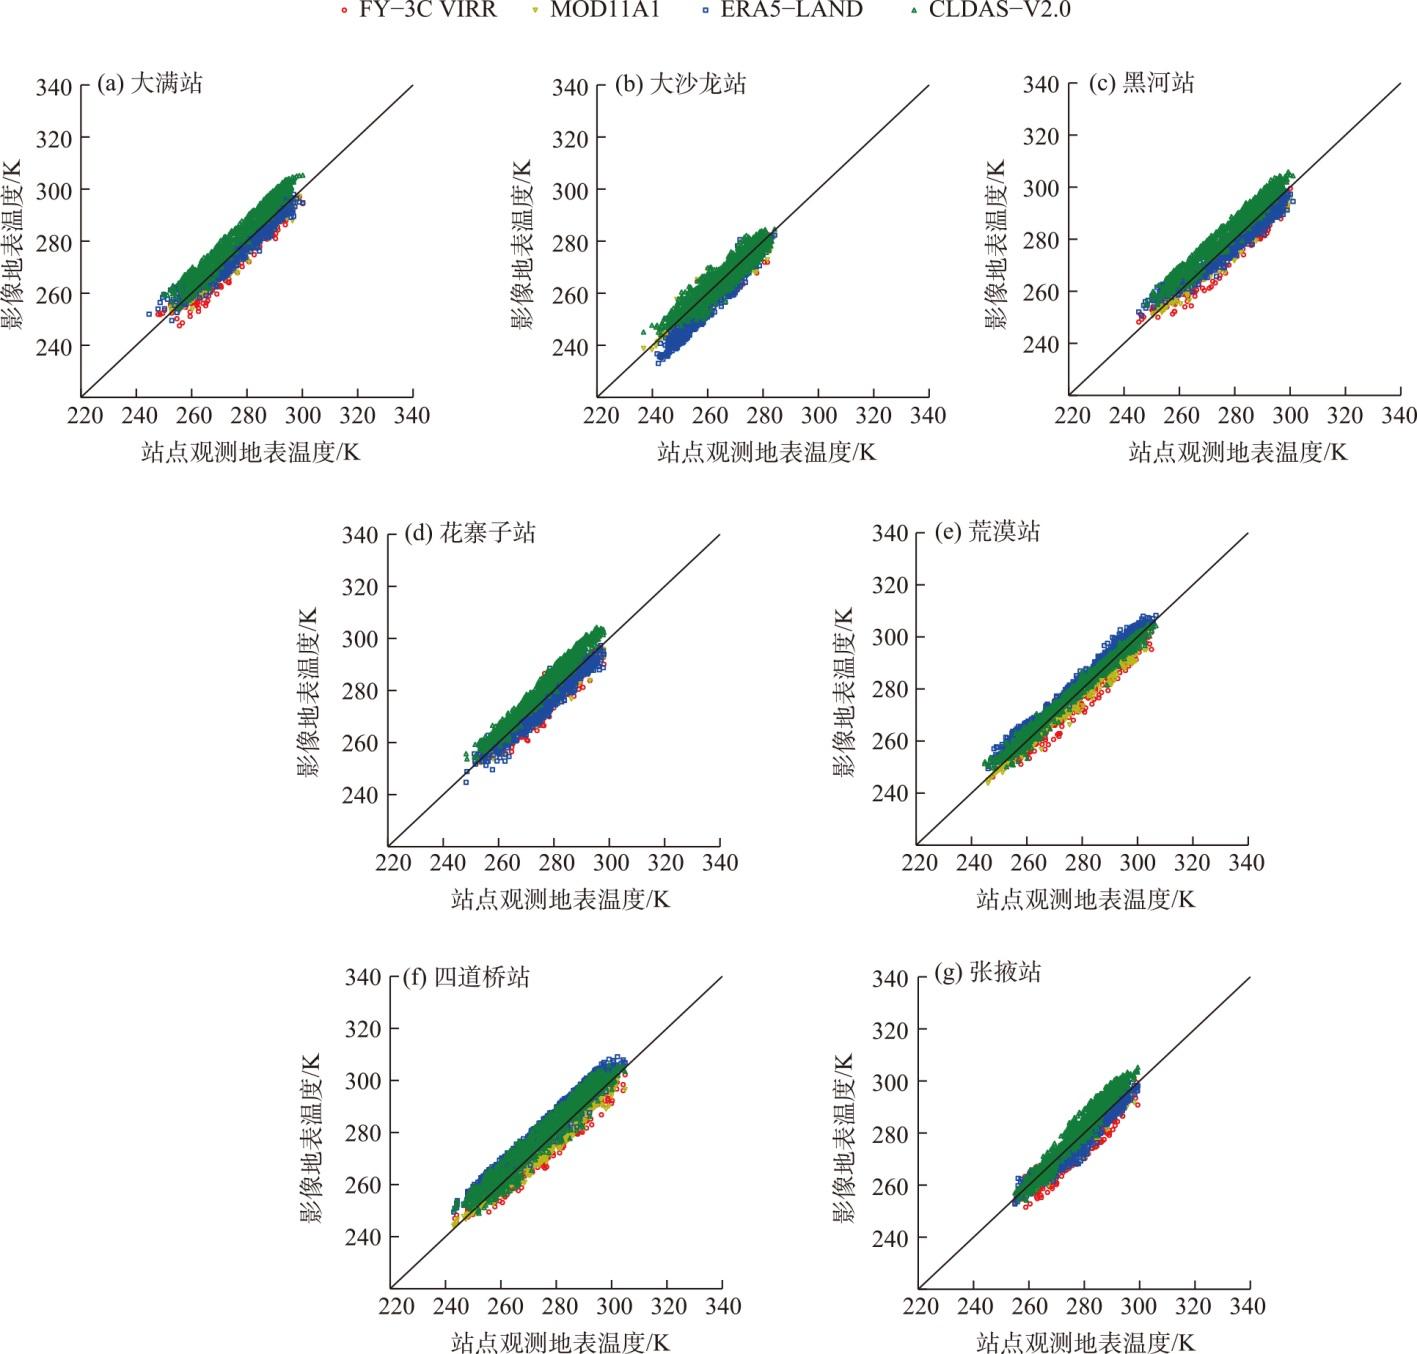
图4 白天影像地表温度和站点观测地表温度的比较Fig. 4 Comparison of daytime land surface temperature data with in-situ land surface temperature |
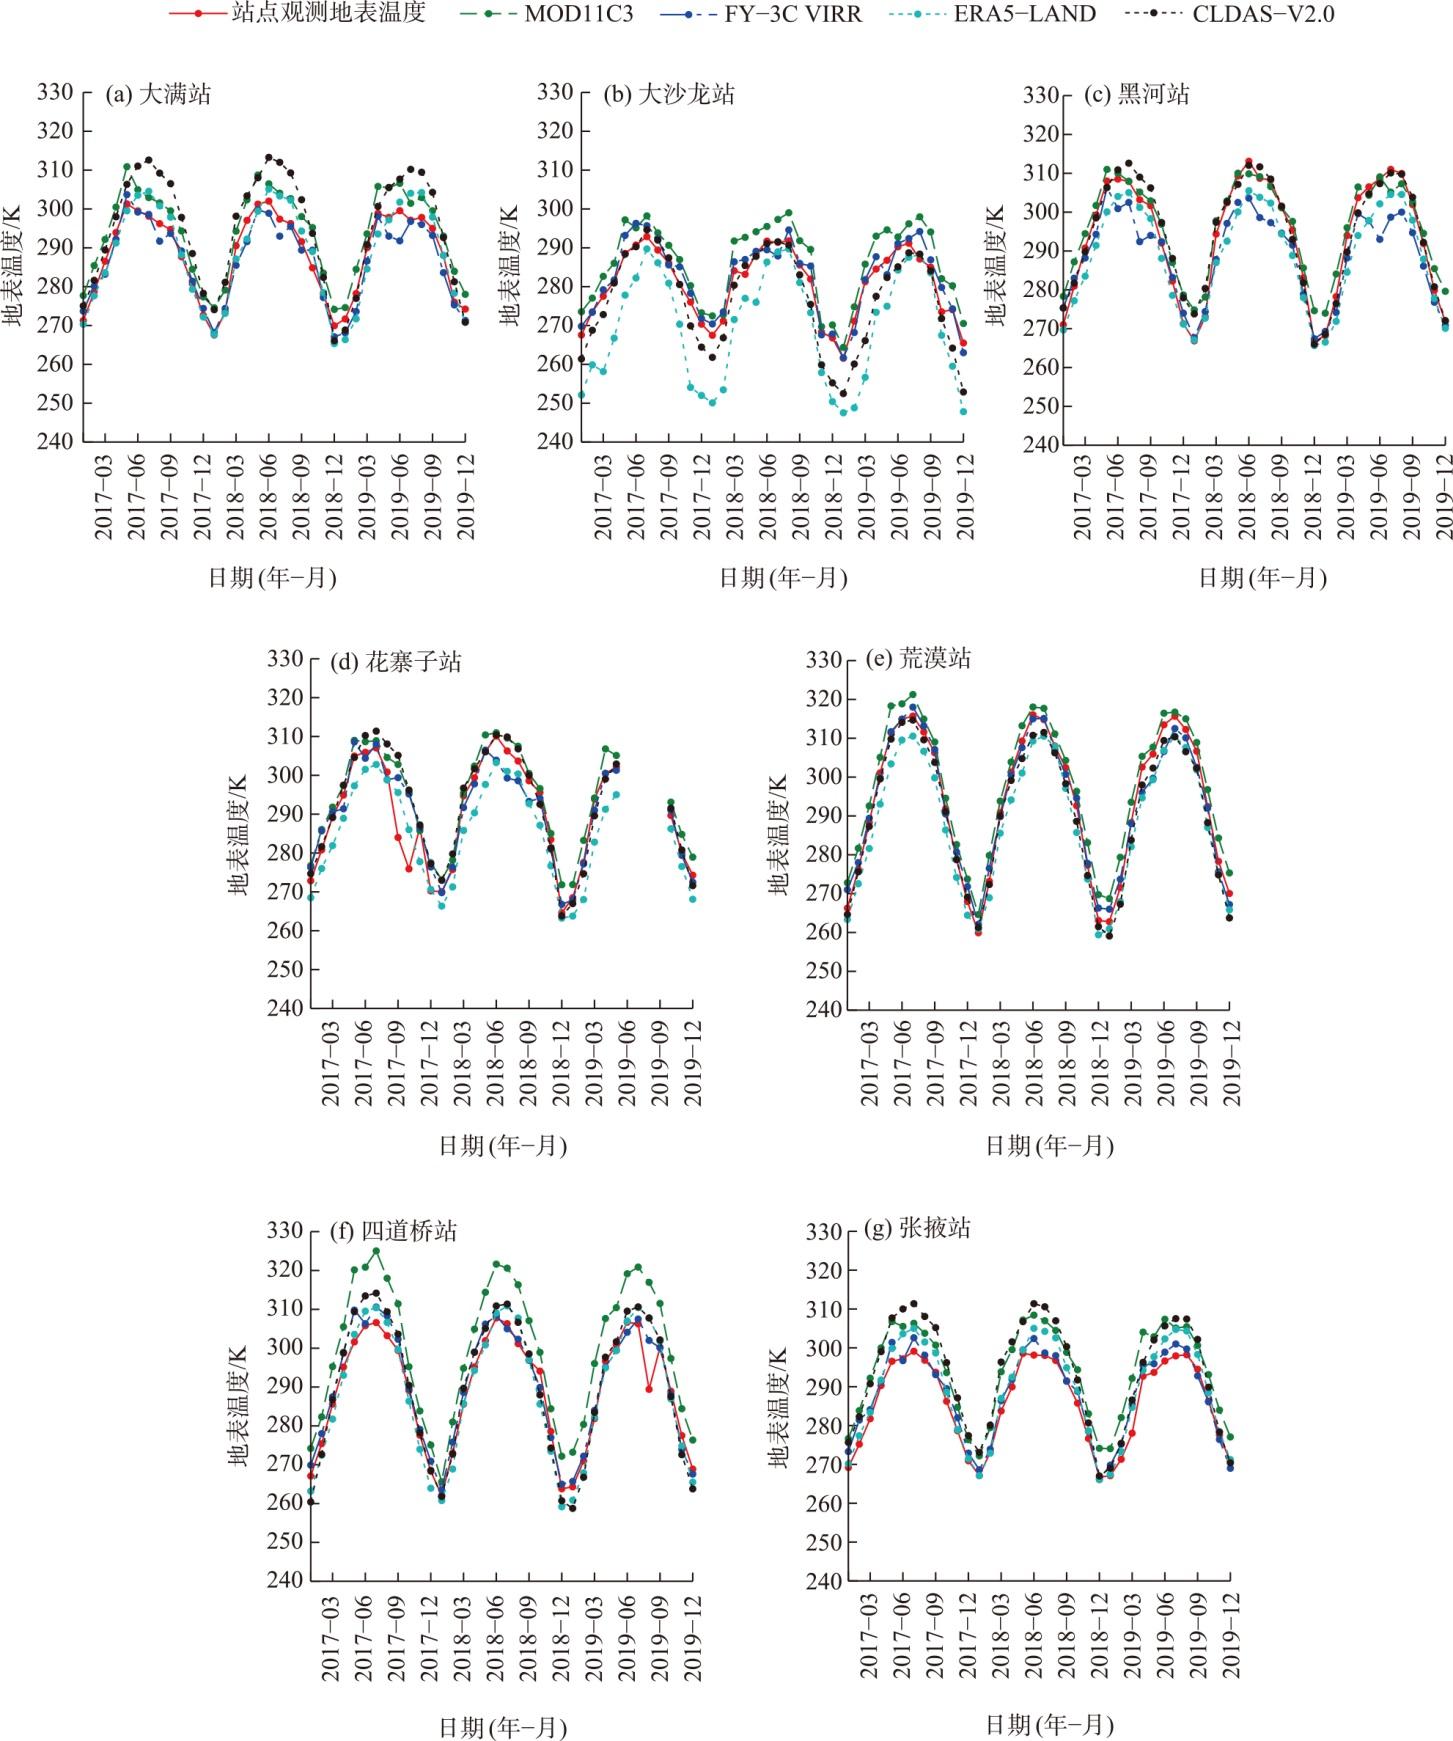
图6 白天影像地表温度和站点观测地表温度的时间序列比较Fig. 6 Time series comparison of daytime land surface temperature data with in-situ land surface temperature |
| [1] |
|
| [2] |
吴万民, 刘涛, 陈鑫. 西北干旱半干旱区NDVI季节性变化及其影响因素[J]. 干旱区研究, 2023, 40(12): 1969-1981.
[
|
| [3] |
王岱, 崔洋, 王素艳, 等. 1961—2020年宁夏干旱事件年代际变化及风险评估[J]. 干旱区地理, 2024, 47(5): 785-797.
[
|
| [4] |
|
| [5] |
|
| [6] |
|
| [7] |
|
| [8] |
|
| [9] |
|
| [10] |
|
| [11] |
|
| [12] |
|
| [13] |
|
| [14] |
|
| [15] |
|
| [16] |
|
| [17] |
|
| [18] |
|
| [19] |
|
| [20] |
|
| [21] |
纪王迪, 黄晓军, 包微, 等. 关中地区人类活动强度与地表温度的时空关联特征及其驱动作用[J]. 干旱区地理, 2024, 47(6): 967-979.
[
|
/
| 〈 |
|
〉 |