Ecology and Environment

Simulation of urban expansion and its response to ecological resilience of typical oases in the Yellow River Basin

  • Yuanyuan LIU ,
  • Caihong MA ,
  • Liya MA
Expand
  • School of Geography Science and Planning, Ningxia University, Yinchuan 750021, Ningxia, China

Received date: 2024-04-08

  Revised date: 2024-07-04

  Online published: 2026-03-11

Abstract

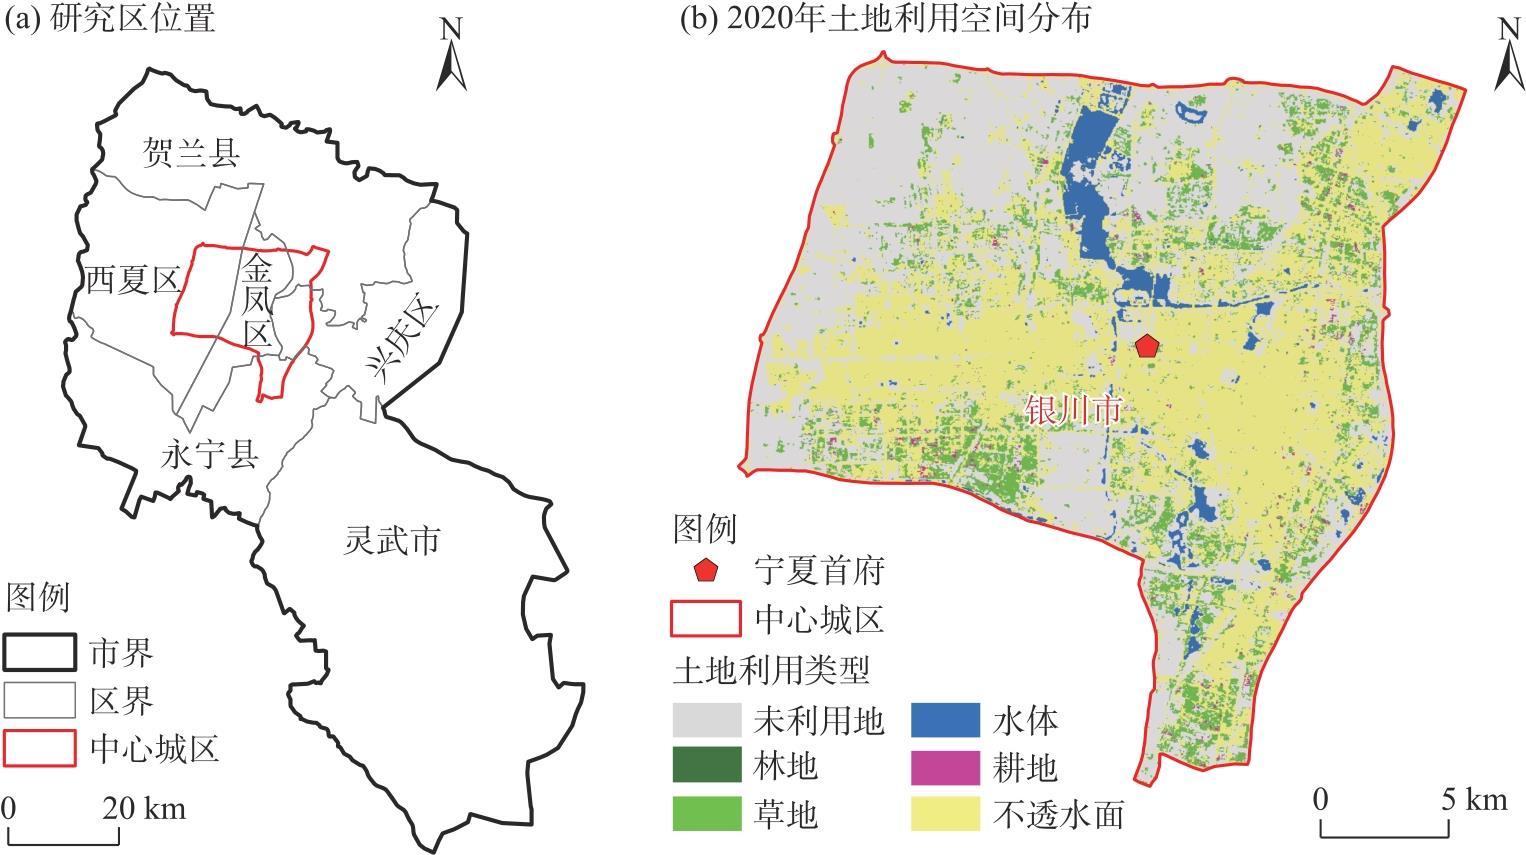
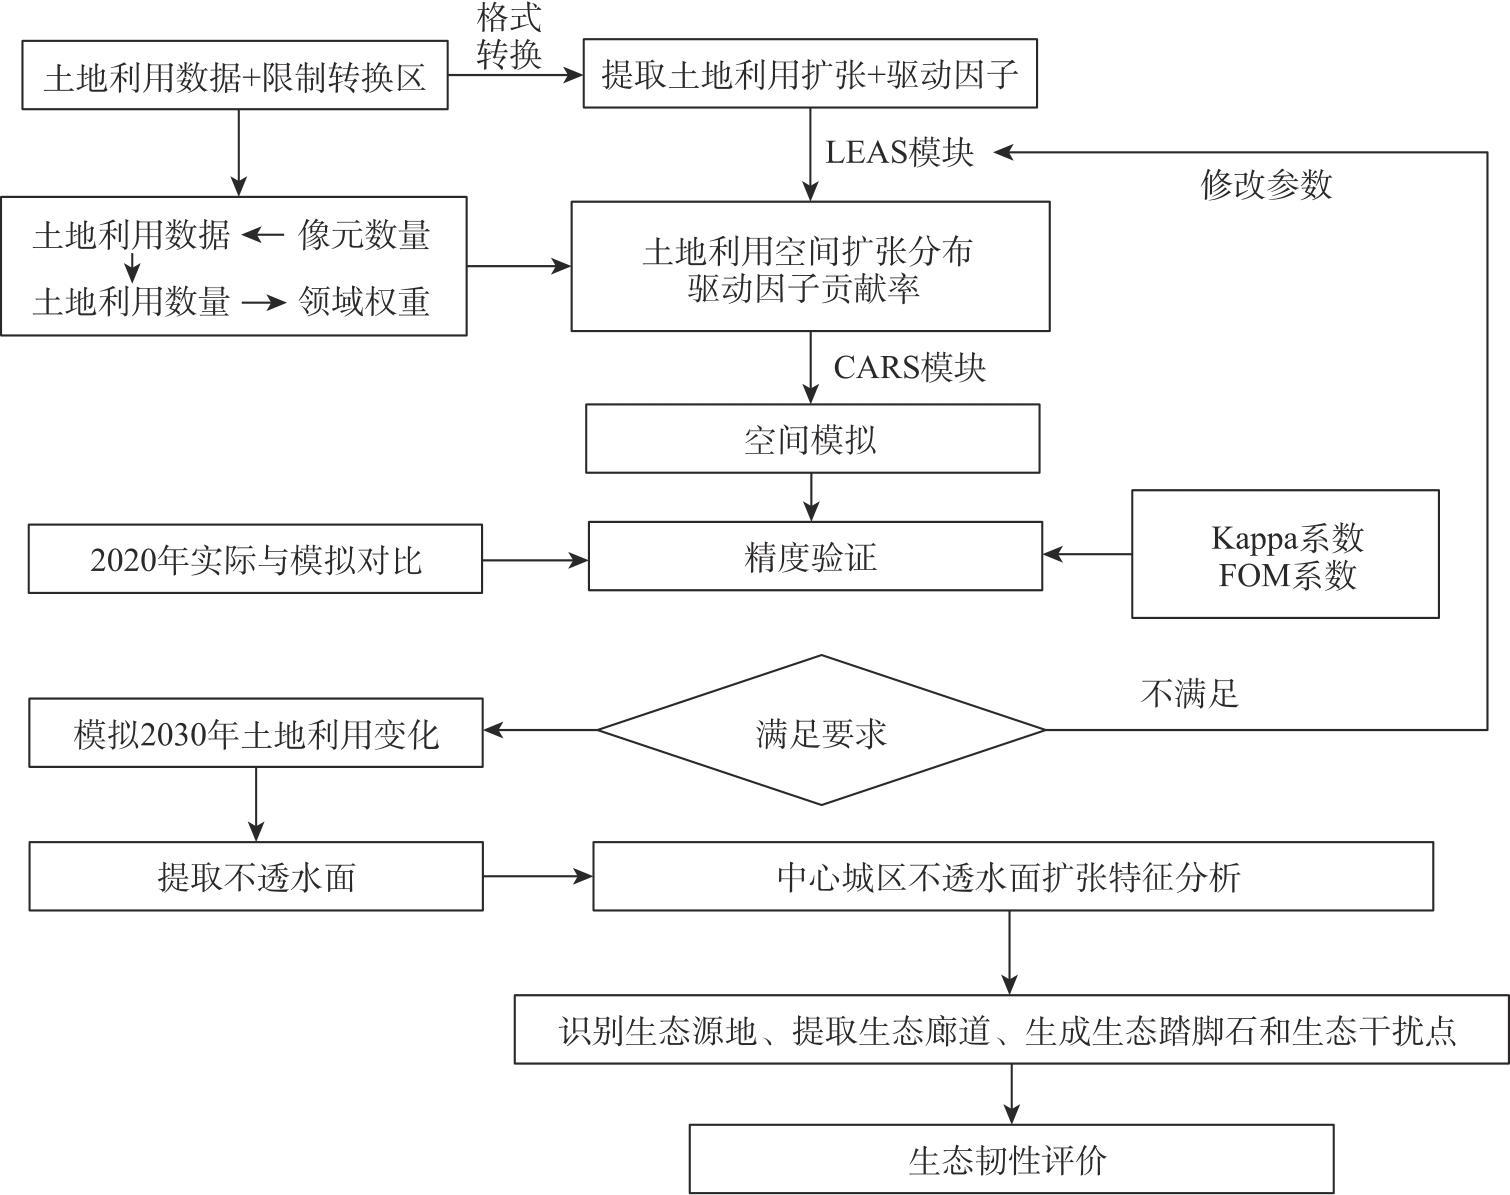
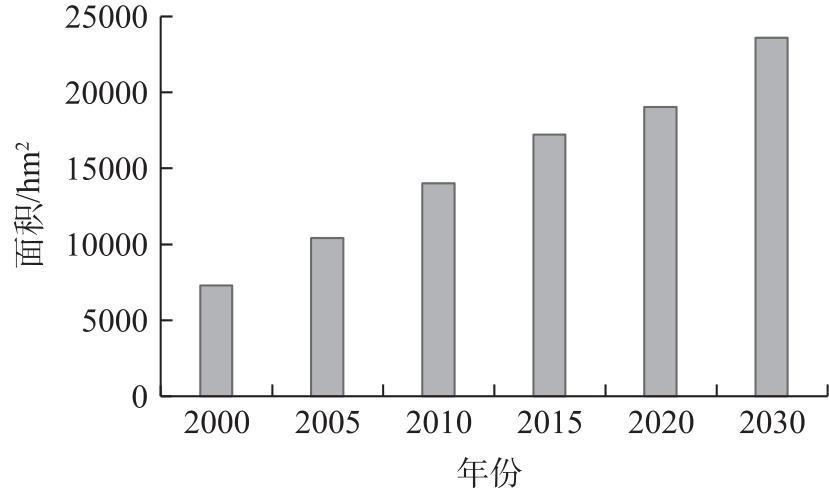
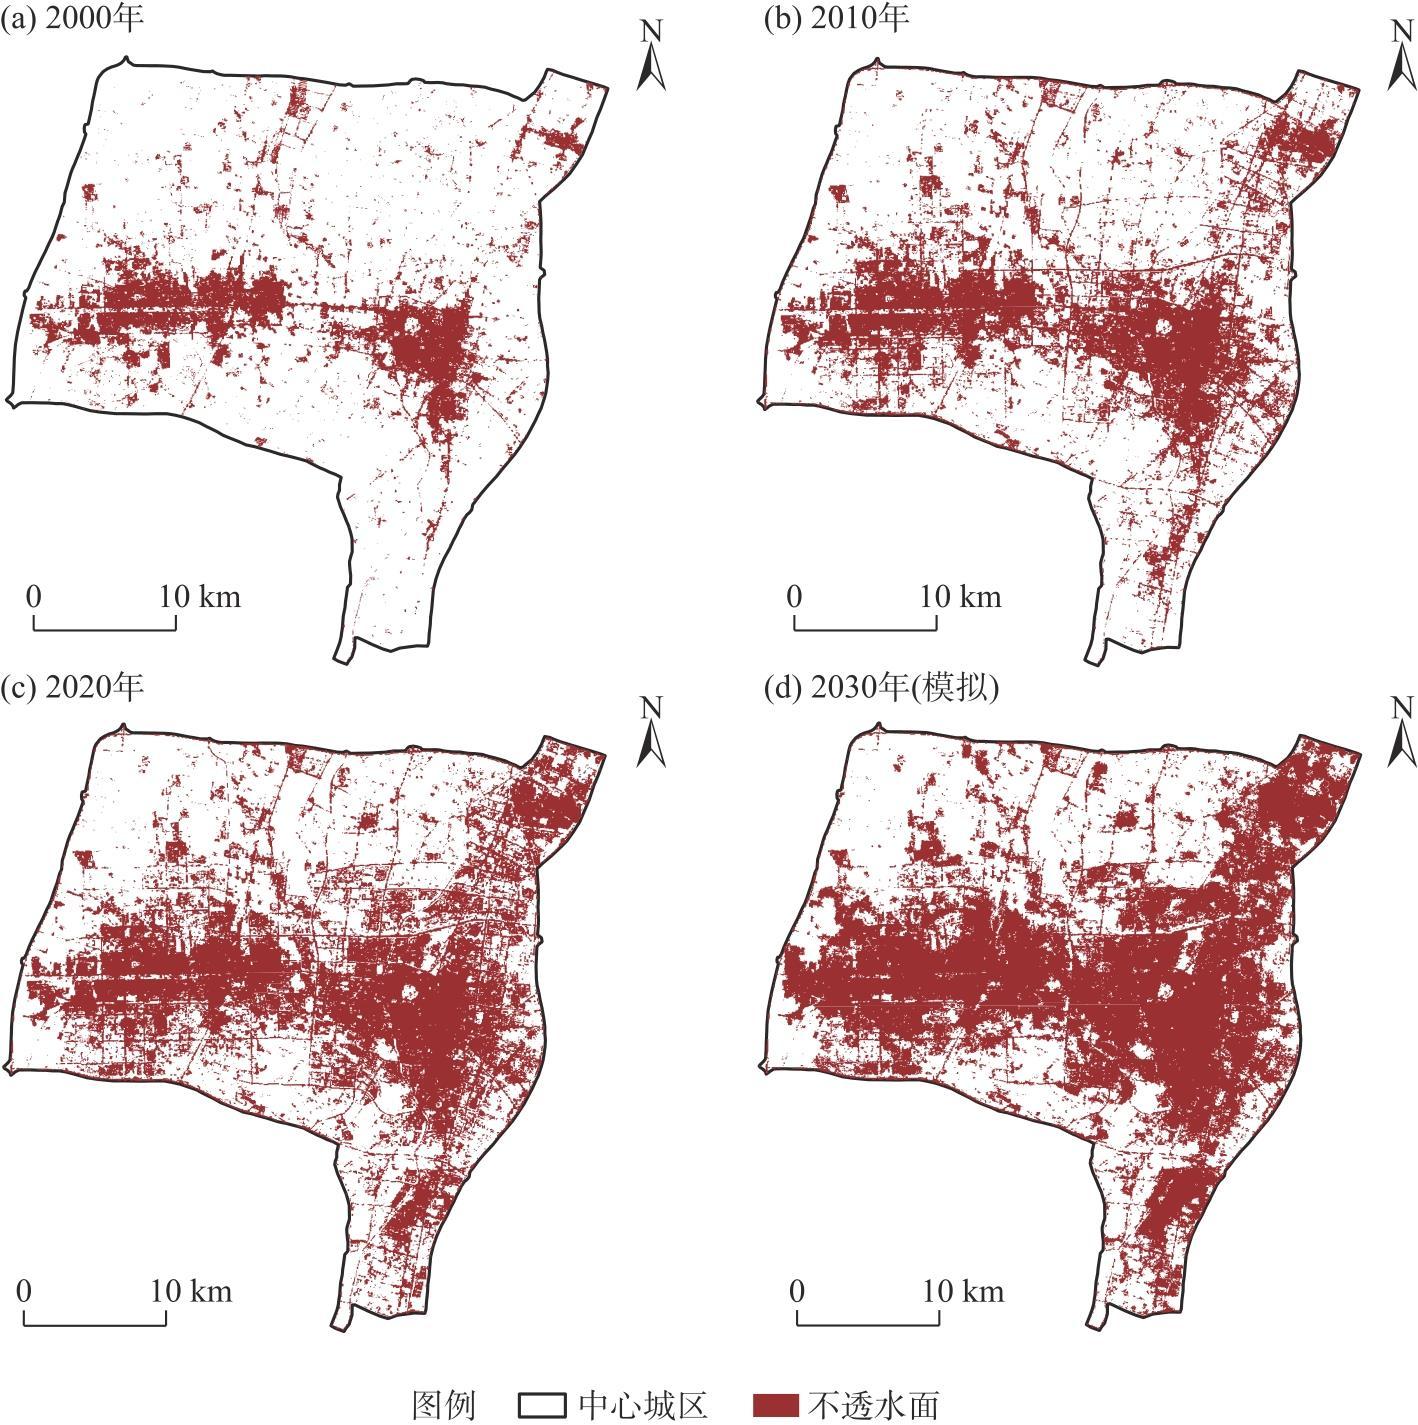
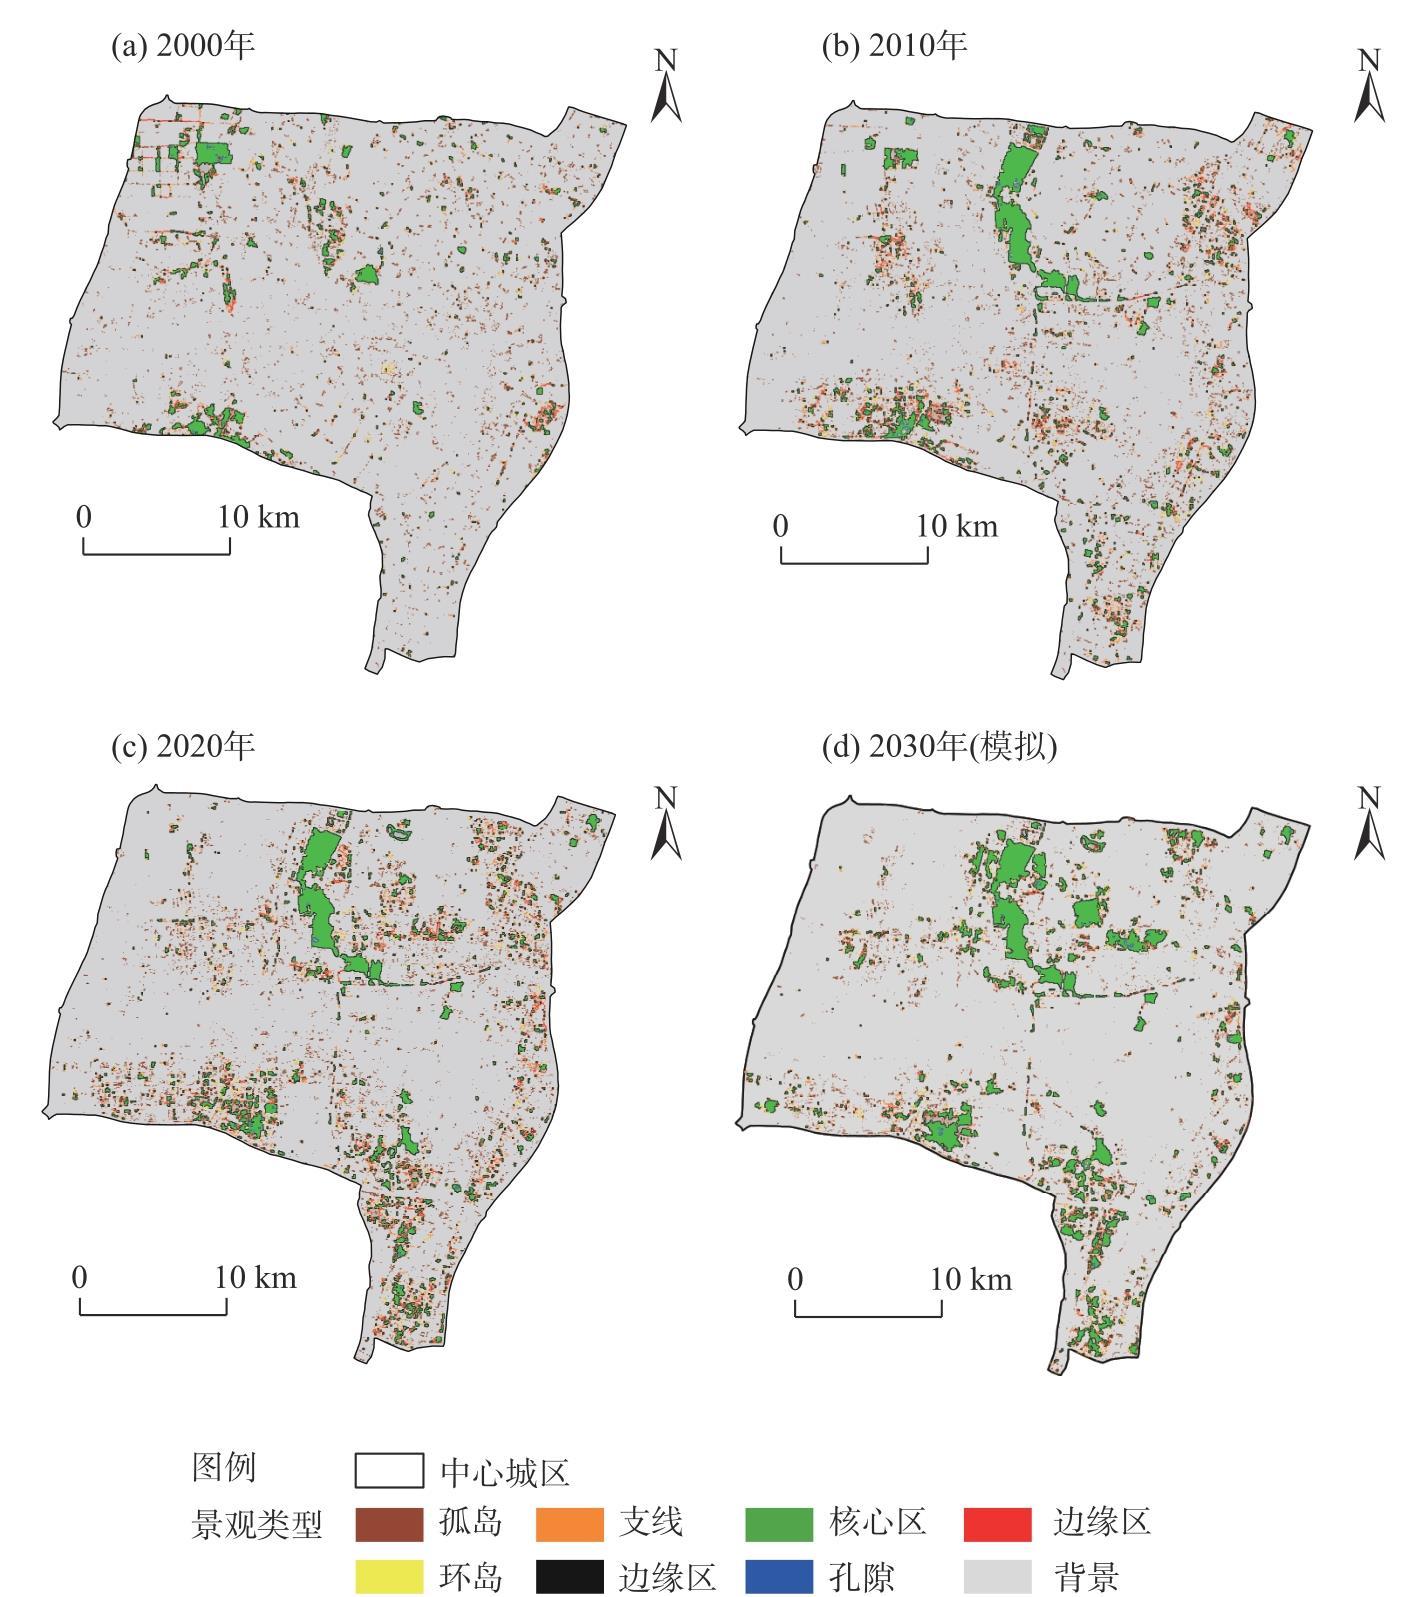
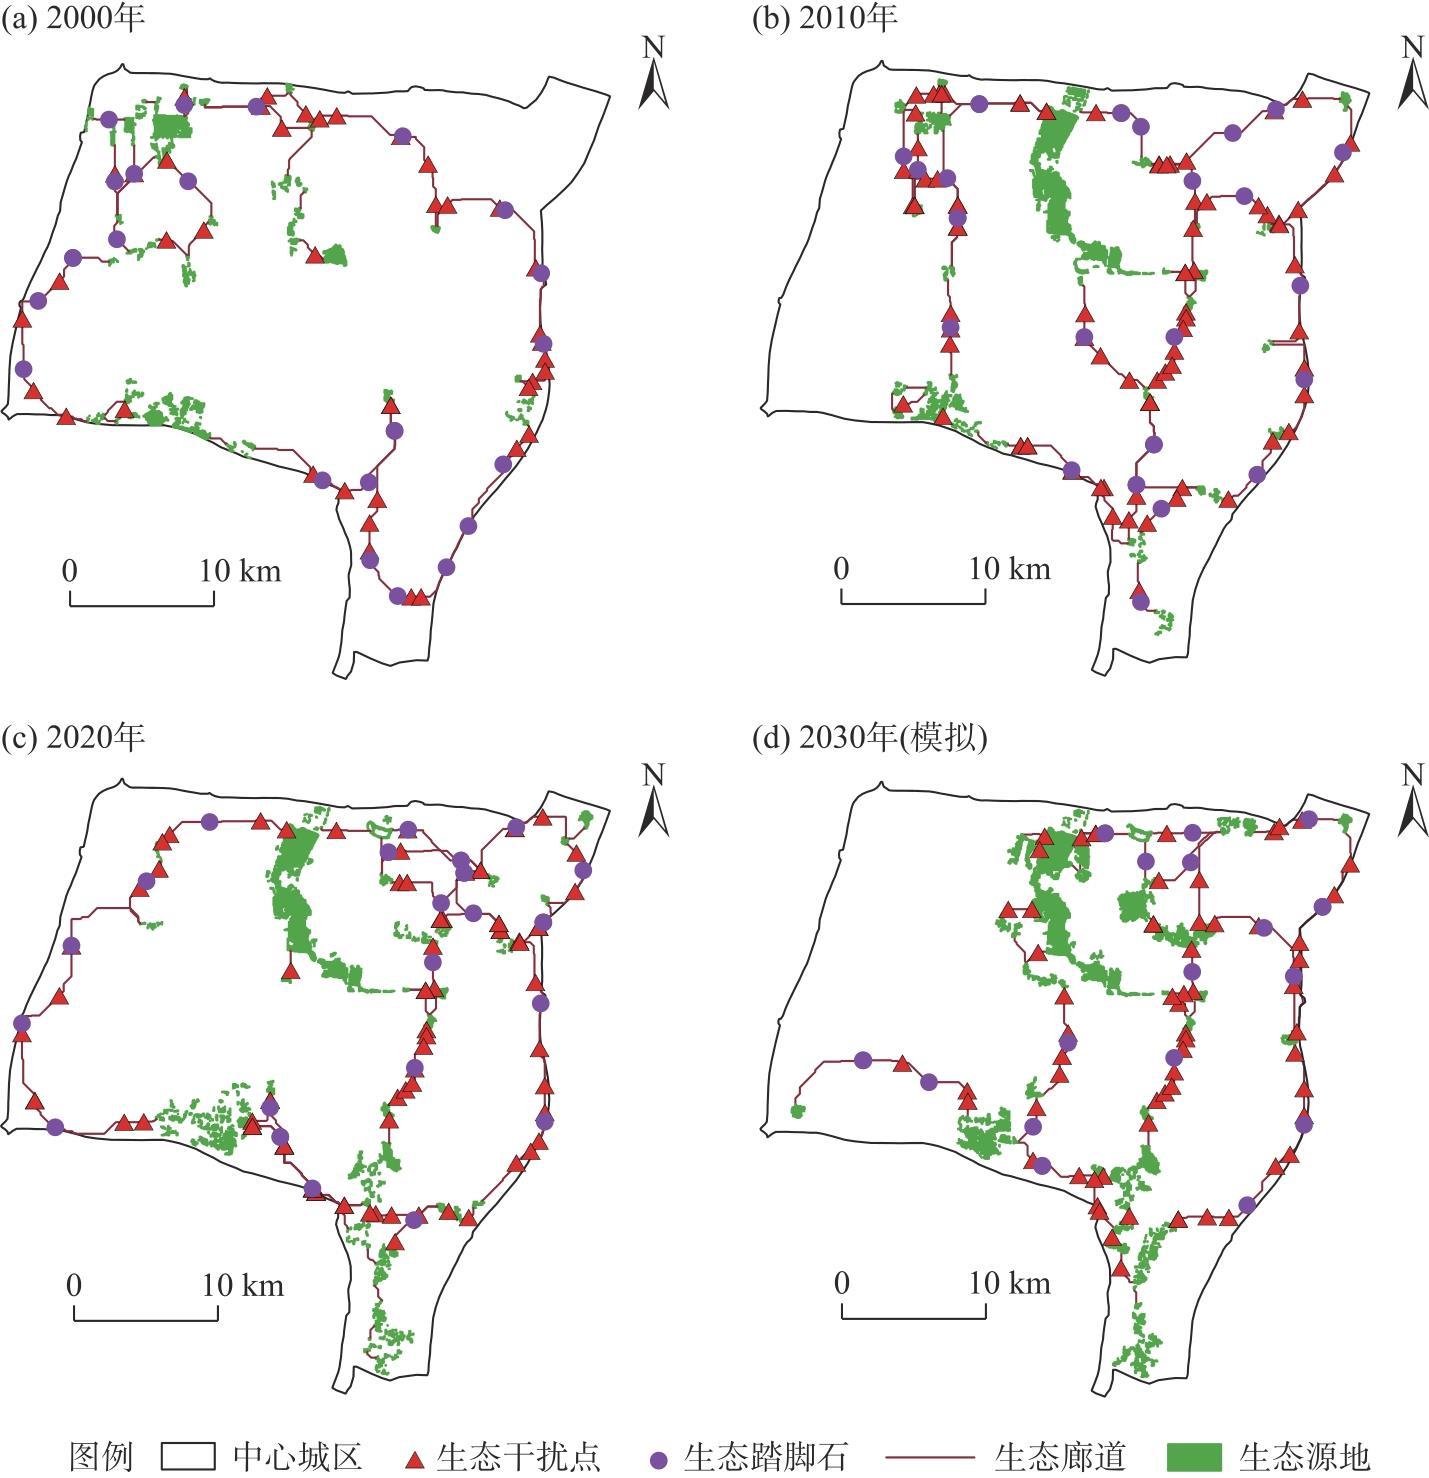
Establishing a robust ecological network is essential for enhancing urban ecological resilience. Using the central urban area of Yinchuan City, a representative oasis city in the Yellow River Basin of China, as a case study, changes in the urban ecological network and its resilience responses to impervious surface expansion were simulated and analyzed using the PLUS model. The results indicate the following: (1) Rapid expansion of impervious surfaces has occurred in central Yinchuan City. The impervious surface area in 2020 expanded to be 2.61 times larger than that in 2000, and by 2030, the area is projected to be 3.24 times larger than in 2000. The spatial pattern of impervious surfaces evolved from an east-west longitudinal “一” pattern to a rightward-tilting “T” pattern, with further strengthening of this horizontal “T” pattern by 2030. (2) With the expansion of impervious surfaces, the ecological network pattern in the central urban area has undergone substantial changes. In 2000, a single-ring ecological network was observed around the urban fringe. By 2020, the outer ring expanded westward, and the inner ring shifted northward, forming a more intricate circuit in the northeastern sector. Simulations predict that by 2030, the ecological network will exhibit a “川” structure. (3) Both structural and functional resilience of the ecological network have improved. Between 2000 and 2020, the α, β, and γ indices increased by 0.09, 0.17, and 0.06, respectively, while network dissemination and diversity rose by 0.08 and 0.29, respectively. By 2030, further enhancements in structural and functional resilience are expected, though the overall resilience level will remain low.

Cite this article

Yuanyuan LIU , Caihong MA , Liya MA . Simulation of urban expansion and its response to ecological resilience of typical oases in the Yellow River Basin[J]. Arid Land Geography, 2025 , 48(3) : 506 -516 . DOI: 10.12118/j.issn.1000-6060.2024.219

城市是一个复杂的社会生态系统,伴随着城镇化进程加快、环境污染、资源短缺、生物多样性锐减等问题频发。生态系统作为城市的肌体,往往最先感知生态风险的发生。生态韧性是生态系统面对外部环境干扰时,表现出的抵抗、恢复及适应能力。增强城市生态韧性对城市可持续发展至关重要[1]。生态网络是连接城市核心区和郊区的绿色屏障,是把孤立的绿地斑块和水体斑块在空间分布上依照自然规律连接而成的空间结构体系[2]。生态网络在结构和功能方面与生态系统韧性密切关联,是评估生态韧性优劣的重要指标之一[3]。城市空间扩张与生态网络格局演变具有潜在关联关系。分析城市不透水面扩张与生态网络韧性的变化,可有效避免“重格局-轻过程”的弊端[4-5]。将城市扩张模拟与生态网络韧性结合探讨,对城市生态系统的健康管理具有重要价值。关于城市扩张,学者多采用元胞自动机(CA)模型[如小尺度土地利用变化及其空间效应(CLUES)、SLEUTH、未来土地利用模拟(FLUS)等模型)][6]、马尔科夫链[7]等,对城市不透水面扩张开展模拟。其中,马尔科夫链用于时间序列动态模拟,但在空间格局模拟中存在不足[8];CA用于空间格局变化模拟,但在时间序列动态模拟以及复杂作用的定义方面存在不足[9]。PLUS模型[10]能够模拟多种土地利用变化类型的相互作用及空间动态变化,因在模拟精度方面具有明显优势而受到广泛应用[11-12]
绿洲城市是干旱区人类生产生活的核心区,生态系统脆弱极易受到破坏,直接影响区域可持续发展[13]。黄河流域是中国重要的生态屏障,也是人口活动和经济发展的重要区域。2021年发布的《黄河流域生态保护和高质量发展规划纲要》中,将黄河流域生态保护和高质量发展上升为国家重大战略[14]。银川市是黄河上游地区的典型绿洲城市,受城镇化快速发展以及人类活动干扰,区域景观破碎化程度严重,生态功能严重受阻。本文以黄河上游典型城市——银川市中心城区为研究区,探究生态网络对不透水面扩张的响应特征,以期为绿洲城市生态系统健康发展提供一定决策参考。

1 数据与方法

1.1 研究区概况

银川市是宁夏回族自治区的首府城市,位于银川平原绿洲灌区,西倚贺兰山、东临黄河,下辖兴庆区、金凤区、西夏区、永宁县、贺兰县及灵武市“三区两县一市”。银川市属于温带干旱气候区,日照充足,风大沙多。银川市湖泊湿地众多,湿地面积5.31×10⁴ hm2,其中,湖泊湿地达9700 hm2,2018年获得全球首批“国际湿地城市”称号。依据《银川市国土空间总体规划(2021—2035年)》,以银川市绕城高速为外廓,并将贺兰县和永宁县建成区纳入本研究范围,作为银川市中心城区范围(图1)。
图1 研究区概况

Fig. 1 Overview of the study area

1.2 研究方法

1.2.1 不透水面扩张模拟模型

选用PLUS模型开展银川市中心城区不透水面扩张模拟。PLUS模型融合多类随机种子生长机制,是土地扩张分析策略(LEAS)的规则挖掘框架和多类型随机种子(CARS)的元胞自动机(CA)模型[15],因可获得与现实更为相似的景观和更高的仿真精度而受到广泛应用[16]。计算公式如下:
P i , k X d = n = 1 M I h n X = d M
O P i , k d = 1 , t = P i , k t × Ω i , k t × D k t
式中: P i , k X d为栅格i处地类k的发展概率; I h n X = d为决策树的指数函数; h n X为当决策树为n时计算得到的地类;X为由多种驱动因子组合的向量;M为决策树的数量;d取值0或者1,当值为1时表示地类可转化,0则表示不可转化; O P i , k d = 1 , t为栅格i处在t时刻向地类k转变的综合概率; P i , k t为栅格i处在t时刻向地类k发展的适宜性概率; Ω i , k t为栅格i处在t时刻向地类k发展的领域效应; D k t为未来t时刻需求对地类k的影响。
将大型水域作为约束性条件,依据文献[17]选取数字高程模型(DEM)、坡度、降水、气温、土壤、国内生产总值(GDP)、人口密度、距政府距离、距铁路距离、距道路距离共10项因子作为驱动因子[18]。基于2000—2020年银川市土地利用基本情况,设置土地利用转移成本矩阵,其中,1表示地类之间可转换,0表示地类之间不可转换。结合模拟精度反复调试[19],最终设置耕地、林地、草地、水体、未利用地和不透水面的邻域权重值依次为0.4、0.2、0.3、0.2、0.3和1.0。将2020年的模拟结果与同年实际土地利用数据进行比对,Kappa系数达到0.8以上,精度满足要求。

1.2.2 生态网络分析模型

生态网络是由生态源地、生态廊道和生态节点构成的网状结构,是耦合景观结构、生态过程和功能的重要途径[20]。形态学空间格局分析(MSPA)是一种被应用于识别源地和构建阻力面的偏向测度结构连接性方法[21]。Linkage Mapper模型考虑物种活动随机游走的特点,可进行生态廊道的筛选。采用MSPA-Linkage Mapper[22-23]方法进行研究区生态网络的分析。其中,生态廊道的提取关键在于阻力面体系的构建[24-25]。选择土地利用类型、与道路距离、与水体距离、归一化植被指数(NDVI)等作为阻力因子,一致性检查结果表明,一致性比率(CR)为0.067,CR<0.1,说明矩阵满足一致性(表1)。
表1 阻力因子赋值及权重

Tab. 1 Assignment and weights of resistance factors

阻力因子 分级指标 阻力值 权重
土地利用 林地 10 0.2264
草地 20
水体 30
耕地 70
未利用地 100
建设用地 150
NDVI [-0.260, -0.038) 150 0.2854
[-0.038, 0.112) 110
[0.112, 0.197) 90
[0.197, 0.289) 60
[0.289, 0.401) 30
[0.401, 0.609] 10
MSPA景观 核心区 10 0.1264
桥接区 20
环岛 30
支线 40
孤岛 50
边缘区 70
孔隙 90
背景 100
与道路的距离/m
[0, 100) 200 0.0874
[100, 200) 140
[200, 300) 90
[300, 400) 50
[400, 500) 20
≥500 10
距居民点距离/m ≥2000 10 0.120
[1500, 2000) 20
[1000, 1500) 40
[500, 1000) 70
<500 110
与水体的距离/m [0, 100) 10 0.1544
[100, 200) 20
[200, 300) 40
[300, 400) 70
[400, 500) 110
≥500 160

注:NDVI为归一化植被指数;MSPA为形态学空间格局分析。
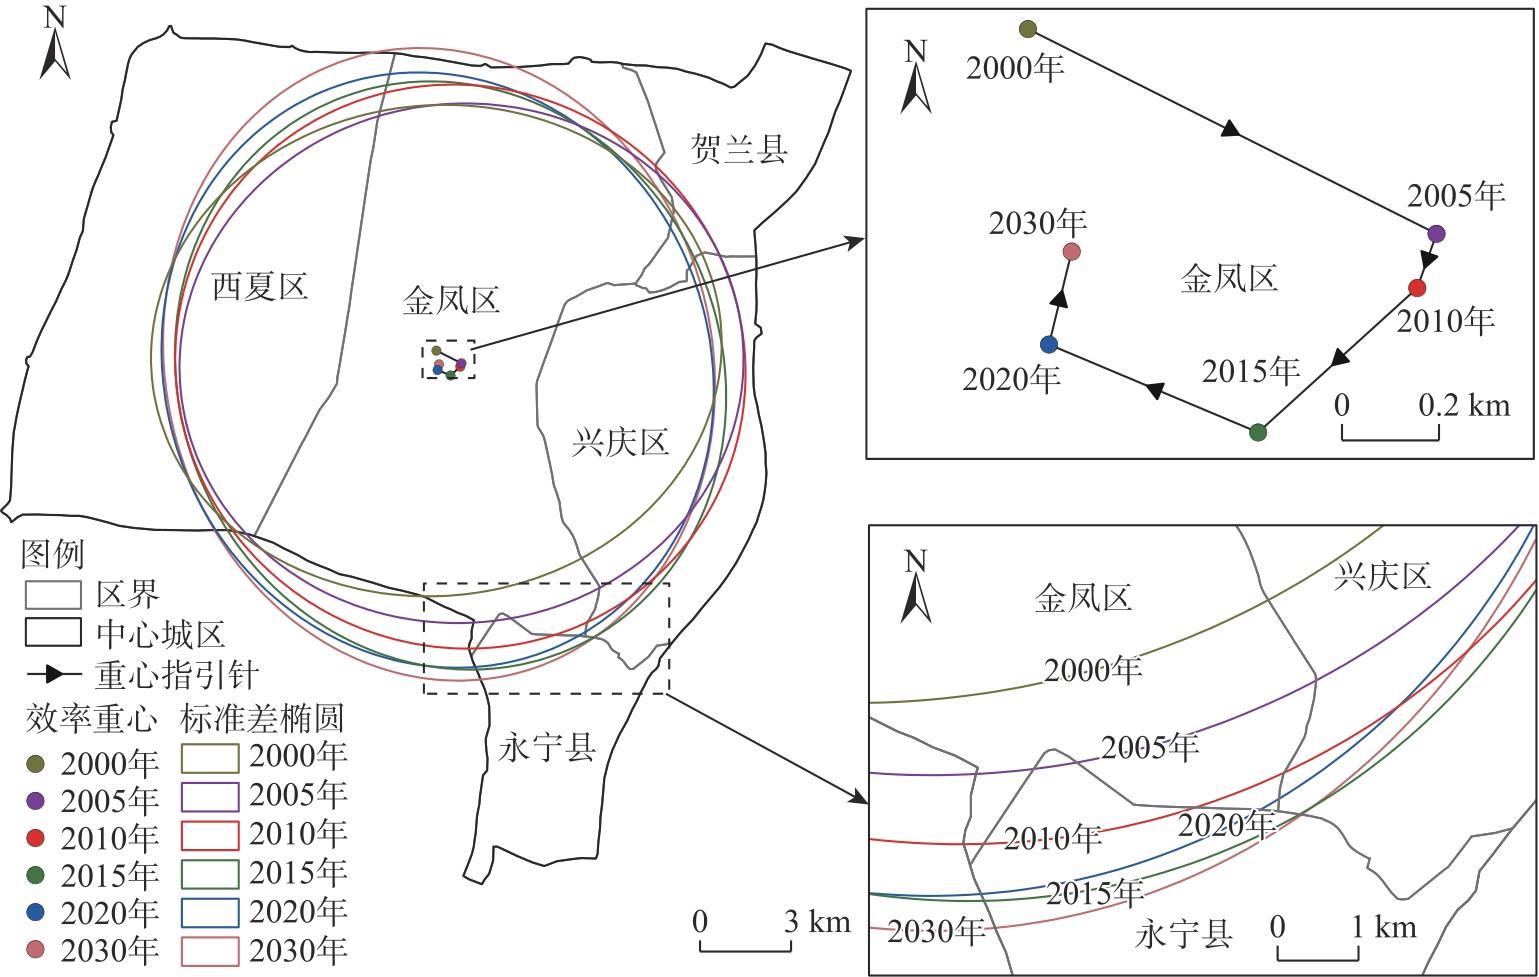
1.2.3 生态韧性评价指数

生态网络的结构韧性和功能韧性是生态韧性的重要体现[26]。其中,结构韧性重点关注节点之间的逻辑性,通常采用网络闭合度、线点率和连接度作为评价指标;功能韧性主要关注网络传输性及多样性,反映生态网络遭遇变化时保持其原始功能的能力[27]。计算公式如下:
α = L - V + 1 / 2 V - 5
β = L / V
γ = L / 3 V - 2
E = 1 n ( n - 1 ) i j G 1 d i j
M = 1 n ( n - 1 ) i j G n i j
式中:α为网络闭合度,取值为[0,1];β为线点率;γ为连接度;E为网络的传播性(0≤E≤1);M为网络的多样性;L为生态廊道数量;V为生态节点数; d i j为节点ij之间的最短路径; n i jij之间的独立路径数;节点n为网络中的总结点数。

1.3 数据来源与处理

土地利用数据来源于中国30 m分辨率土地覆被数据集(http://doi.org/10.5281/zenodo.4417809[28];2020年30 m分辨率DEM数据来源于地理空间数据云(http://www.gscloud.cn/),坡度数据由DEM数据生成;30 m分辨率逐年NDVI数据来源于国家生态科学数据中心(https://www.nesdc.org.cn);2020年1 km分辨率的年平均气温、年降水、土壤数据以及社会经济数据中人口密度和GDP均来源于中国科学院资源环境科学数据中心(http://www.resdc.cn/);距政府距离、距铁路距离、距道路距离数据以及水系数据来源于Open Street Map(http://www.openhistoricalmap.org/);行政区矢量数据来源于国家基础地理信息中心(https://www.ngcc.cn/)。数据统一重采样为30 m,空间参考统一为WGS_1984_UTM_Zone_48N。

1.4 研究框架

基于PLUS模型模拟银川市中心城区2030年土地利用变化,分析银川市中心城区2000、2010、2020年及2030年城市不透水面扩张趋势,构建银川市中心城区生态网络并进行生态韧性评价。技术路线如图2所示。
图2 技术路线

Fig. 2 Technical route

2 结果与分析

2.1 银川市中心城区不透水面时空演变特征

2000—2030年银川市中心城区不透水面发生明显扩张(图3)。2000年银川市中心城区不透水面面积为7292.30 hm2,到2020年扩张为1.90×10⁴ hm2,扩张为2000年不透水面面积的2.61倍。2000—2015年表现为平稳增长态势,2015—2020年增长速率有所减缓,但扩张态势仍在持续,2030年银川市中心城区不透水面面积将达到2.36×10⁴ hm2,是2000年的3.24倍。
图3 2000—2030年银川市中心城区不透水面面积变化

Fig. 3 Changes in the area of impervious surface in the central urban area of Yinchuan City from 2000 to 2030

2000—2030年银川市不透水面空间格局发生明显变化(图4)。2000年银川市中心城区的不透水面主要分布在东西向延伸的狭长区域,且在中部存在一个间断区域。2000—2020年不透水面的扩张沿着东西轴向南北扩张,同时在东部区域出现一个南北纵向轴线扩张区,由2000年的“一”字形态扩张为2020年向右横卧的“T”形区域,2030年这种横卧“T”形格局得到进一步加强。
图4 2000—2030年银川市中心城区不透水面扩张变化

Fig. 4 Changes in impervious surface expansion in the central urban area of Yinchuan City from 2000 to 2030

2020—2030年不透水面的扩张表现为城市内部的填充式发展和边缘区的扩张式发展并行态势。银川市中心城区不透水面的扩张态势与《银川市国土空间总体规划(2021—2035年)》要求中,城市发展以北京路形成的东西向和以亲水大街形成的南北向城市发展主轴的扩张基本吻合。标准差椭圆分析表明,2000年椭圆重心与中心城区的几何中心基本重合,2000—2020年椭圆中心向东扩张,2020—2030年不透水面的重心又向几何中心回归(图5)。
图5 2000—2030年银川市中心城区不透水面标准差椭圆及重心变化

Fig. 5 Changes in standard deviation ellipse and center of gravity of impervious surface in the central urban area of Yinchuan City from 2000 to 2030

2000—2005年和2015—2020年2个时段中不透水面的重心移动距离最大,2005—2010年的移动距离最小,反映出不透水面的扩张方向和速度存在时空不平衡性(表2)。这主要与不透水面的扩张模式差异有关。一般而言,在填充式为主的扩张期,不透水面的重心移动较慢,在扩张式为主的时期,重心移动较快。银川市在不同时段中不透水面的重心扩张方向、距离均存在差异,且快慢交替,不透水面的扩张表现为填充式发展和轴向扩张交替发展态势。
表2 2000—2030年银川市中心城区标准差椭圆参数变化统计

Tab. 2 Statistics of standard deviation ellipse parameters in the central urban area of Yinchuan City from 2000 to 2030

参数 2000—2005年 2005—2010年 2010—2015年 2015—2020年 2020—2030年
椭圆长轴增减/km 0.48 0.67 0.63 0.09 0.58
椭圆短轴增减/km -0.12 0.18 -0.56 0.04 0.04
直线距离/m 940.57 125.19 446.14 911.66 200.21
重心迁移方向 东南方向 西南方向 西南方向 西北方向 东北方向

2.2 银川市中心城区生态网络时空演变特征

基于银川市中心城区景观格局分析结果(图6),发现2000—2020年生态源地斑块数量明显增多,特别是大型生态斑块数量增加明显。2000年潜在生态源地面积为943.02 hm2,到2020年,增长为1978.56 hm2,是2000年的2.10倍,2030年潜在生态源地面积增加到2670.75 hm2,是2000年的2.83倍。湖泊湿地是维持鸟类种群多样性、安全性的重要栖息地,具有极高的生态服务价值[29]。银川市中心城区的生态源地从稀少零散逐渐增加,其中,湖泊湿地是生态源地的重要组成部分,体现出明显的绿洲城市生态源地组分特征。计算表明,湖泊湿地占生态源地的面积比例由2000年的24.72%提升至2020年的54.06%,2030年湖泊湿地的面积占比有所降低,但仍然占有41.75%。
图6 2000—2030年银川市中心城区MSPA格局变化

注:MSPA为形态学空间格局分析。

Fig. 6 Changes in the MSPA pattern in the central urban area of Yinchuan City from 2000 to 2030

生态廊道是连接生态源地之间的狭长、连续的带状区域,承担着维持景观中生态流、生态过程及生态功能的连通和交流作用[30]。生态廊道数量逐渐增多,由2000年的29条增加至2020年的36条,2030年生态廊道数量未发生明显变化,仍为36条,但生态廊道的位置发生了明显变化。
生态干扰点是指在生态网络中阻碍生物迁徙活动的点[31]。2000—2030年生态干扰点数量持续增多。伴随着生态廊道分布格局的变化,生态干扰点的分布热点区也发生相应变化(图7)。生态干扰点2000年主要分布在研究区边缘部分并形成零星分布的热点区,2010年向中心区域集中,2020年分布格局发生转变,2030年在东部区域形成明显的热点区。
图7 2000—2030年银川市中心城区生态干扰点核密度变化

Fig. 7 Changes in kernel density at ecological disturbance points in the central urban area of Yinchuan City from 2000 to 2030

生物迁徙、移动过程中的暂歇点,称之为生态踏脚石。2000、2010、2020年及2030年生态踏脚石分别为24个、27个、26个及19个。由生态源地、生态廊道和生态节点等构成的生态网络结构如图8所示。可以看出,伴随着不透水面的扩张,银川市中心城区的生态网络格局发生了明显的变化。2000年生态源地斑块较少,且面积较小,生态源地零星分布在银川市中心城区边缘,形成了围绕中心城区边缘地带的单环状生态网络;2010年中部区域出现一个小型环,与外环结合形成“回”字形结构;2020年外环向西扩张,内环整体向北移动,在东北片区形成较为复杂的回路;2030年西部边缘的廊道消失,生态网络发展成“川”字形结构,且在东北片区形成较多回路。
图8 2000—2030年银川市中心城区生态廊道及生态节点空间分布

Fig. 8 Spatial distributions of ecological corridors and ecological nodes in the central urban area of Yinchuan City from 2000 to 2030

2.3 银川市中心城区生态韧性对不透水面扩张的响应特征

生态网络的韧性体现为结构韧性和功能韧性。其中,结构韧性通过网络闭合度、线点率和连接度进行评价(表3)。2000—2020年生态网络的α指数、β指数及γ指数均有所提高。α指数由0.14上升到0.23,反映出网络闭合环路有所增加,源地连接度提升;β指数由1.21提升至1.38,说明生态网络复杂度提高,抗干扰能力变强;γ指数由0.44提升到0.50,反映出生态网络整体的连通性有所提升。2020—2030年α指数提高0.32,β指数提高0.51,γ指数提高0.21,说明银川市中心城区生态网络的稳定性将进一步增强。
表3 优化前后的生态网络连接度指标比较

Tab. 3 Comparison of ecological network connectivity indicators before and after optimization

指标 2000年 2010年 2020年 2030年
α指数 0.14 0.16 0.23 0.55
β指数 1.21 1.26 1.38 1.89
γ指数 0.44 0.45 0.50 0.71
网络的传播性和多样性可以表达生态网络的功能韧性,反映生态网络迁移及抗危机能力。在生态干扰下,随着初始网络中的节点一个个被移除,剩余节点组成的新网络的稳定性发生变化。如果新的网络在移除一定数量的节点后,其传播性和多样性仍能保持或恢复到可接受的水平,那么该网络就被认为是韧性好且稳定性强。在银川市中心城区,2000—2020年生态网络的传播性指数由0.32增加到0.40,反映出生态网络的功能韧性有所提高,但数值总体偏低,说明生态网络整体传输效率中等偏下,网络的开敞性一般(表4)。2030年传播性指数为0.41,生态网络传输效率有所提高,但整个生态网络传输功能还有待继续提升。2000—2020年多样性指数由1.25增加到1.54,多样性有所增加,但数值适中,网络中的节点之间独立路径平均数量偏少,平均每对节点间的独立路径不到2条,生态流动以单向为主。2030年生态网络的多样性指数增加到1.58,数值有所增加。但在出现危险时,可用于缓冲的独立路径数量仍然不足。
表4 生态网络多样性及传播性

Tab. 4 Diversity and transmissibility of ecological networks

指标
2000年 2010年 2020年 2030年
网络传播性 0.32 0.37 0.40 0.41
网络多样性 1.25 1.52 1.54 1.58

3 讨论

城市生态韧性是关系城市可持续健康发展的重要测度指标。本文借用生态网络的结构韧性和功能韧性指标,进行银川市中心城区不透水面扩张对生态系统的影响研究,这是将生态网络应用到城市生态韧性研究的有益尝试。研究发现,伴随着不透水面的扩张,对城市绿地系统、河湖水系生态系统均产生空间布局上的影响。银川市中心城区由绿地和湖泊湿地构成的生态源地数量和面积均发生明显变化。与之响应,生态廊道数量和生态节点数量均发生明显变化。研究发现,2000、2010年和2020年3个时间界面的生态网络结构存在明显差异,2030年银川市中心城区的生态网络结构将进一步发生变化,充分说明城市不透水面扩张对生态网络产生显著影响。这与Huang等[32]的研究结论一致。另外,本文主要结合过程与格局的综合分析,采用PLUS模型对2030年的银川市中心城区不透水面和生态网络的响应情景进行模拟预测。研究发现,如果按照历史发展规律,2030年银川市中心城区的生态韧性尽管有所提升,但仍然存在空间分布不均衡、生态韧性总体偏低的状态。因此,今后发展中,需要强化生态网络空间发展的均衡性,从而进一步提升生态网络的结构稳定性和功能有效性。

4 结论

(1) 银川市中心城区不透水面发生了快速扩张。2020年不透水面面积为2000年的2.61倍,2030年不透水面面积将是2000年的3.24倍。空间上,不透水面的格局由2000年的东西纵向“一”字形格局发展到2020年的向右倾倒的“T”字形格局,2030年这种横卧“T”形格局得到进一步加强。
(2) 伴随着不透水面的扩张,银川市中心城区生态网络格局发生明显变化。2000年围绕中心城区边缘地带形成的单环状生态网络;2010年形成“回”字形结构;2020年外环向西扩张,内环整体向北移动,在东北片区形成较为复杂的回路;2030年生态网络发展成“川”字形结构,且在东北片区形成较多回路。
(3) 生态网络结构韧性与功能韧性均有所提升。2000—2020年αβγ指数分别提升0.09、0.17、0.06,网络传播性和多样性分别提升0.08、0.29,生态韧性明显增强,2030年生态网络结构韧性和功能韧性将进一步提升,但整体水平仍然偏低。
[1]
Hu H, Yan K G, Shi Y, et al. Decrypting resilience: The spatiotemporal evolution and driving factors of ecological resilience in the Yangtze River Delta urban agglomeration[J]. Environmental Impact Assessment Review, 2024, 106: 107540, doi: 10.1016/j.eiar.2024.107540.

[2]
Bascompte J. Structure and dynamics of ecological networks[J]. Science, 2010, 329(5993): 765-766.

DOI PMID

[3]
杨亮洁, 张玲玲, 张芳宁, 等. 生态安全格局视角下黄土高原生态网络韧性研究[J]. 生态学报, 2024, 44(22): 10471-10485.

[Yang Liangjie, Zhang Lingling, Zhang Fangning, et al. A study on the resilience of ecological networks in the Loess Plateau from the perspective of ecological security patterns[J]. Acta Ecologica Sinica, 2024, 44(22): 10471-10485. ]

[4]
Liu Y Y, Ma C H, Yang Z H, et al. Ecological security of desert-oasis areas in the Yellow River Basin, China[J]. Land, 2023, 12(11): 2080, doi: 10.3390/land12112080.

[5]
李红波, 黄悦, 高艳丽. 武汉城市圈生态网络时空演变及管控分析[J]. 生态学报, 2021, 41(22): 9008-9019.

[Li Hongbo, Huang Yue, Gao Yanli. Analysis on the spatial-temporal evolution and regulation of the ecological network in Wuhan metropolitan area[J]. Acta Ecologica Sinica, 2021, 41(22): 9008-9019. ]

[6]
Zhu L Y, Song R X, Sun S, et al. Land use/land cover change and its impact on ecosystem carbon storage in coastal areas of China from 1980 to 2050[J]. Ecological lndicators, 2022, 142: 109178, doi: 10.1016/j.ecolind.2022.109178.

[7]
金一诺, 黄银洲, 尤凤, 等. 基于Markov-PLUS模型的石羊河流域土地利用及生态系统服务价值模拟[J]. 干旱区资源与环境, 2024, 38(5): 130-139.

[Jin Yinuo, Huang Yinzhou, You Feng, et al. Simulation of land use and ecosystem service value in Shiyang River Basin based on Markov-PLUS model[J]. Journal of Arid land Resources and Environment, 2024, 38(5): 130-139. ]

[8]
Saadani S, Laajaj R, Maanan M, et al. Simulating spatial-temporal urban growth of a Moroccan metropolitan using CA-Markov model[J]. Spatial Information Research, 2020, 28: 609-621.

DOI

[9]
Liang X, Liu X P, Li X, et al. Delineating multi-scenario urban growth boundaries with a CA-based FLUS model and morphological method[J]. Landscape and Urban Planning, 2018, 177: 47-63.

[10]
Liang X, Guan Q F, Clarke K C, et al. Understanding the drivers of sustainable land expansion using a patch-generating land use simulation (PLUS) model: A case study in Wuhan, China[J]. Computers, Environment and Urban Systems, 2021, 85: 101569, doi:10.1016/j.compenvurbsys.2020.101569.

[11]
智菲, 周振宏, 赵铭, 等. 基于PLUS和InVEST模型的合肥市生态系统碳储量时空演变特征[J]. 水土保持学报, 2024, 38(2): 205-215.

[Zhi Fei, Zhou Zhenhong, Zhao Ming, et al. Temporal and spatial evolution characteristics of carbon storage in Hefei ecosystem based on PLUS and InVEST models[J]. Journal of Soil and Water Conservation, 2024, 38(2): 205-215. ]

[12]
徐海斌, 肖长江, 刘雅雯, 等. 基于PLUS模型的徐州市土地利用布局弹性空间模拟[J]. 资源科学, 2024, 46(1): 175-186.

DOI

[Xu Haibin, Xiao Changjiang, Liu Yawen, et al. Simulation of flexible space of land use layout in Xuzhou City based on the PLUS model[J]. Resources Science, 2024, 46(1): 175-186. ]

DOI

[13]
吴榛, 张凯云, 王浩. 城市扩张情景模拟下绿地生态网络构建与优化研究——以南京市部分区域为例[J]. 中国园林, 2022, 38(4): 56-61.

[Wu Zhen, Zhang Kaiyun, Wang Hao. Construction and optimization of green space ecological network under urban expansion scenario simulation: A case study in some areas of Nanjing[J]. Chinese Landscape Architecture, 2022, 38(4): 56-61. ]

[14]
李田田. 黄河流域城市韧性时空演变及影响因素研究[D]. 兰州: 兰州大学, 2023.

[Li Tiantian. Spatio-temporal evolution of urban resilience and its influencing factors in the Yellow River Basin[D]. Lanzhou: Lanzhou University, 2023. ]

[15]
王想, 王春雨, 吕飞南, 等. 基于PLUS-InVEST模型的区县碳储量时空格局变化与碳汇提升策略——以延庆区为例[J]. 应用生态学报, 2023, 34(12): 3373-3384.

DOI

[Wang Xiang, Wang Chunyu, Feinan, et al. Temporal and spatial variations of carbon storage and carbon sink improvement strategy at the district and county level based on PLUS-InVEST model: Taking Yanqing District as an example[J]. Chinese Journal of Applied Ecology, 2023, 34(12): 3373-3384. ]

DOI

[16]
田一豆, 赵先超. 基于Markov-PLUS模型的长株潭城市群建设用地扩张模拟及碳排放响应分析[J]. 生态学报, 2024, 44(1): 129-142.

[Tian Yidou, Zhao Xianchao. Simulation of construction land expansion and carbon emission response analysis of Changsha-Zhuzhou-Xiangtan urban agglomeration based on Markov-PLUS model[J]. Acta Ecologica Sinica, 2024, 44(1): 129-142. ]

[17]
张艳, 李骏南, 潘博华. 基于PLUS模型的黄河流域生态系统服务评价及多情景预测——以陕西段为例[J]. 干旱区地理, 2024, 47(11): 1935-1946.

DOI

[Zhang Yan, Li Junnan, Pan Bohua. Evaluation and multi-scenario prediction of ecosystem services in the Yellow River Basin based on PLUS model: A case study of Shaanxi section[J]. Arid Land Geography, 2024, 47(11): 1935-1946. ]

[18]
张廷, 胡玉柱, 胡海辉, 等. 基于PLUS-InVEST模型的哈尔滨市土地利用及生境质量预测[J]. 环境科学, 2024, 45(8): 4709-4721.

[Zhang Ting, Hu Yuzhu, Hu Haihui, et al. Prediction of land use and habitat quality in Harbin City based on PLUS-InVEST model[J]. Environmental Science, 2024, 45(8): 4709-4721. ]

[19]
李琛, 高彬嫔, 吴映梅, 等. 基于PLUS模型的山区城镇景观生态风险动态模拟[J]. 浙江农林大学学报, 2022, 39(1): 84-94.

[Li Chen, Gao Binpin, Wu Yingmei, et al. Dynamic simulation of landscape ecological risk in mountainous based on PLUS model[J]. Journal of Zhejiang A & F University, 2022, 39(1): 84-94. ]

[20]
王兴丹, 刘普幸, 耿梦蝶, 等. 土地利用时空变化的关键驱动因子及其影响趋势——以武威市为例[J]. 中国环境科学, 2023, 43(12): 6583-6591.

[Wang Xingdan, Liu Puxing, Geng Mengdie, et al. The key driving factors of land use patio-temporal change and its influence trend: A case study of Wuwei[J]. Chinese Journal of Environmental Sciences, 2023, 43(12): 6583-6591. ]

[21]
Vogt P, Riitters K H, Iwanowski M, et al. Mapping landscape corridors[J]. Ecological Indicators, 2007, 7(2): 481-488.

[22]
马彩虹, 刘园园, 杨航, 等. 宁夏灵武市“生态-经济”双网格局演变及互作关系[J]. 应用生态学报, 2023, 34(11): 3095-3104.

DOI

[Ma Caihong, Liu Yuanyuan, Yang Hang, et al. Evolution and interaction relationship of “eco-economy” dual grid pattern in Lingwu City, Ningxia, China[J]. Chinese Journal of Applied Ecology, 2023, 34(11): 3095-3104. ]

DOI

[23]
和娟, 师学义, 付扬军. 基于生态系统服务的汾河源头区域生态安全格局优化[J]. 自然资源学报, 2020, 35(4): 814-825.

DOI

[He Juan, Shi Xueyi, Fu Yangjun. Optimization of ecological security pattern in the source area of Fenhe River Basin based on ecosystem services[J]. Journal of Natural Resources, 2020, 35(4): 814-825. ]

DOI

[24]
黄木易, 岳文泽, 冯少茹, 等. 基于MCR模型的大别山核心区生态安全格局异质性及优化[J]. 自然资源学报, 2019, 34(4): 771-784.

DOI

[Huang Muyi, Yue Wenze, Feng Shaoru, et al. Analysis of spatial heterogeneity of ecological security based on MCR model and ecological pattern optimization in the Yuexi County of the Dabie Mountain area[J]. Journal of Natural Resources, 2019, 34(4): 771-784. ]

DOI

[25]
周英, 施成超, 刘滢, 等. 基于MSPA-MCR模型的云南德昂族乡景观生态安全格局构建[J]. 西南林业大学学报(社会科学), 2022, 6(1): 54-62.

[Zhou Ying, Shi Chengchao, Liu Ying, et al. Construction of landscape ecological security pattern of Deang ethnic township in Yunnan based on MSPA-MCR model[J]. Journal of Southwest Forestry University (Social Sciences Edition), 2022, 6(1): 54-62. ]

[26]
孔阳, 王思元. 基于MSPA模型的北京市延庆区城乡生态网络构建[J]. 北京林业大学学报, 2020, 42(7): 113-121.

[Kong Yang, Wang Siyuan. Construction of urban and rural ecological network in Yanqing District of Beijing based on MSPA model[J]. Journal of Beijing Forestry University, 2020, 42(7): 113-121. ]

[27]
Hong W Y, Guo R Z, Li X M, et al. Measuring urban ecological network resilience: A disturbance scenario simulation method[J]. Cities, 2022, 131, 104057, doi: 10.1016/j.cities.2022.104057.

[28]
Yang J, Huang X. The 30 m annual land cover datasets and its dynamics in China from 1985 to 2022[J]. Earth System Science Data, 2023, 13(1): 3907-3925.

[29]
黄梅, 刘晨曦, 俞晓莹, 等. 城市水生态网络韧性评价与优化策略——以长沙市为例[J]. 经济地理, 2022, 42(10): 52-60.

DOI

[Huang Mei, Liu Chenxi, Yu Xiaoying, et al. Resilience evaluation and optimization of urban water ecological network: Take Changsha as an example[J]. Economic Geography, 2022, 42(10): 52-60. ]

[30]
吴一洲, 姚申益, 吴思琴, 等. 海岛城市生态安全格局构建与优化策略研究——以舟山本岛为例[J]. 长江流域资源与环境, 2022, 31(12): 2693-2705.

[Wu Yizhou, Yao Shenyi, Wu Siqin, et al. Construction and optimization strategy of ecological security pattern in the island city: A case study of Zhoushan Island[J]. Resources and Environment in the Yangtze Basin, 2022, 31(12): 2693-2705. ]

[31]
王正伟, 王宏卫, 杨胜天, 等. 基于生态系统服务功能的新疆绿洲生态安全格局识别及优化策略——以拜城县为例[J]. 生态学报, 2022, 42(1): 91-104.

[Wang Zhengwei, Wang Hongwei, Yang Shengtian, et al. Identification and optimization strategy of ecological security pattern of oasis in Xinjiang based on ecosystem service function: Taking Baicheng County as an example[J]. Acta Ecologica Sinica, 2022, 42(1): 91-104. ]

[32]
Huang X X, Wang H J, Shan L Y, et al. Constructing and optimizing urban ecological network in the context of rapid urbanization for improving landscape connectivity[J]. Ecological Indicators, 2021, 132: 108319, doi: 10.1016/j.ecolind.2021.108319.

Outlines

/