
Estimation of crop stubble biomass in the Bashang region of Zhangjiakou by combining optics and radar remote sensing
Received date: 2024-03-14
Revised date: 2024-05-24
Online published: 2026-03-11
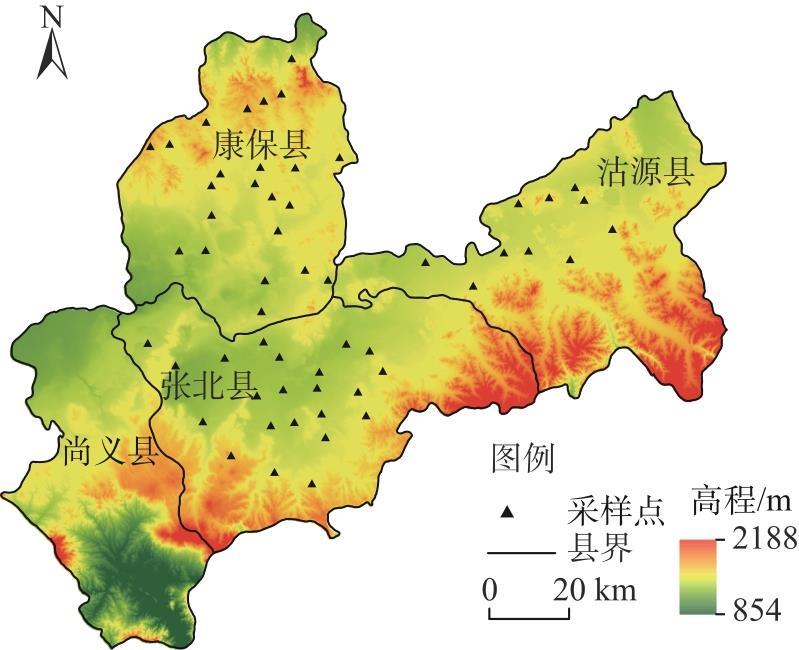
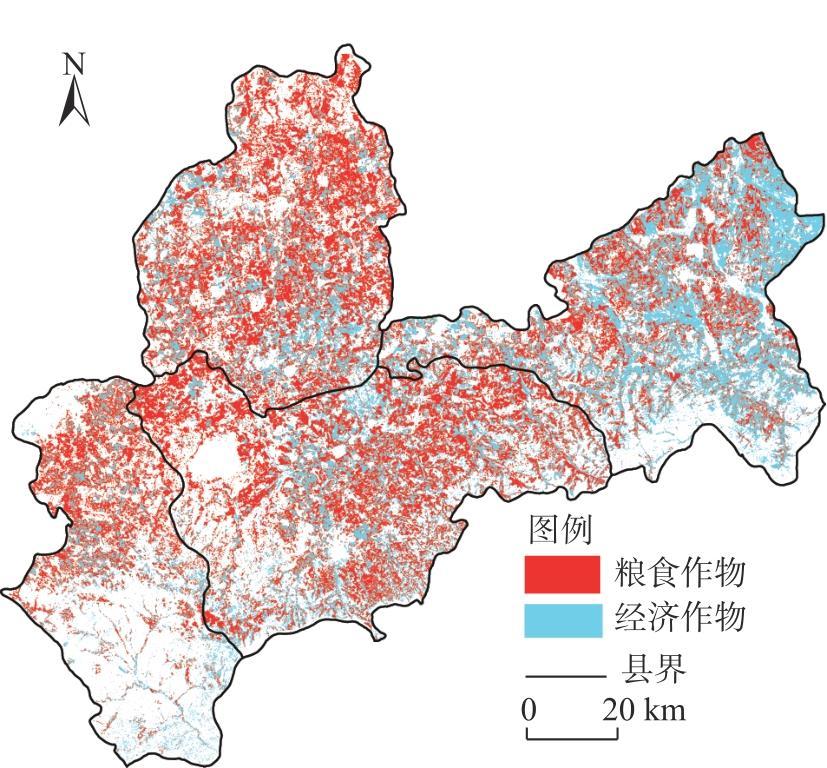
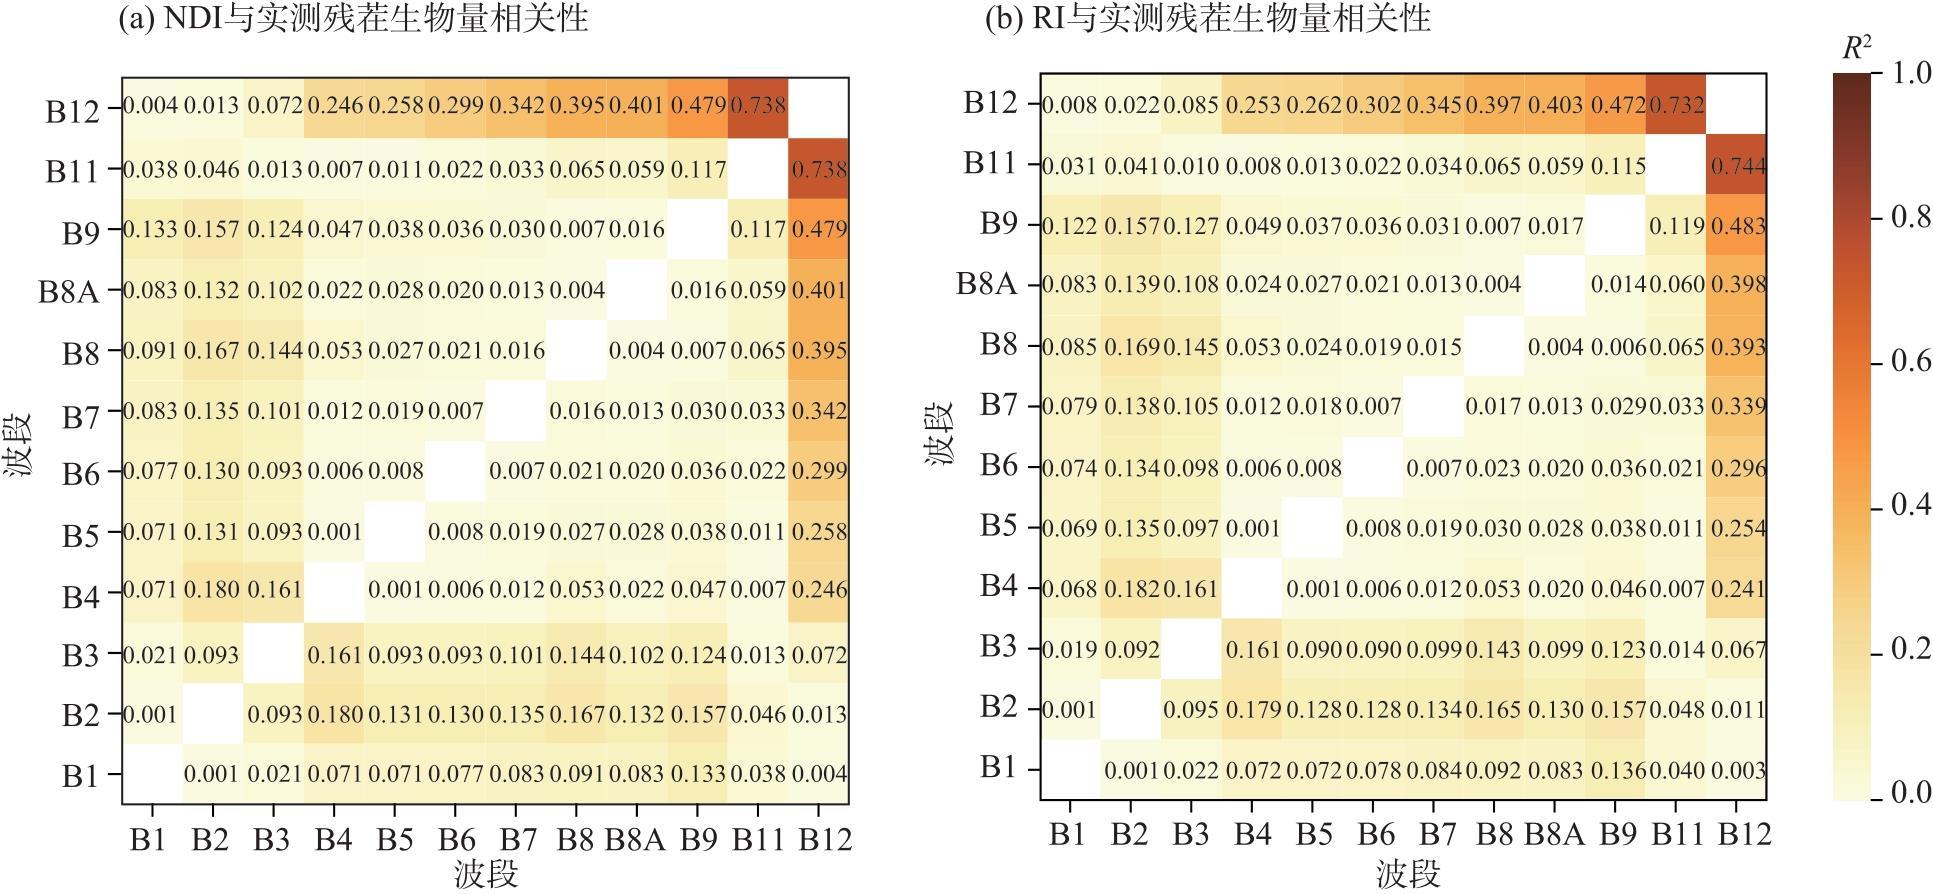
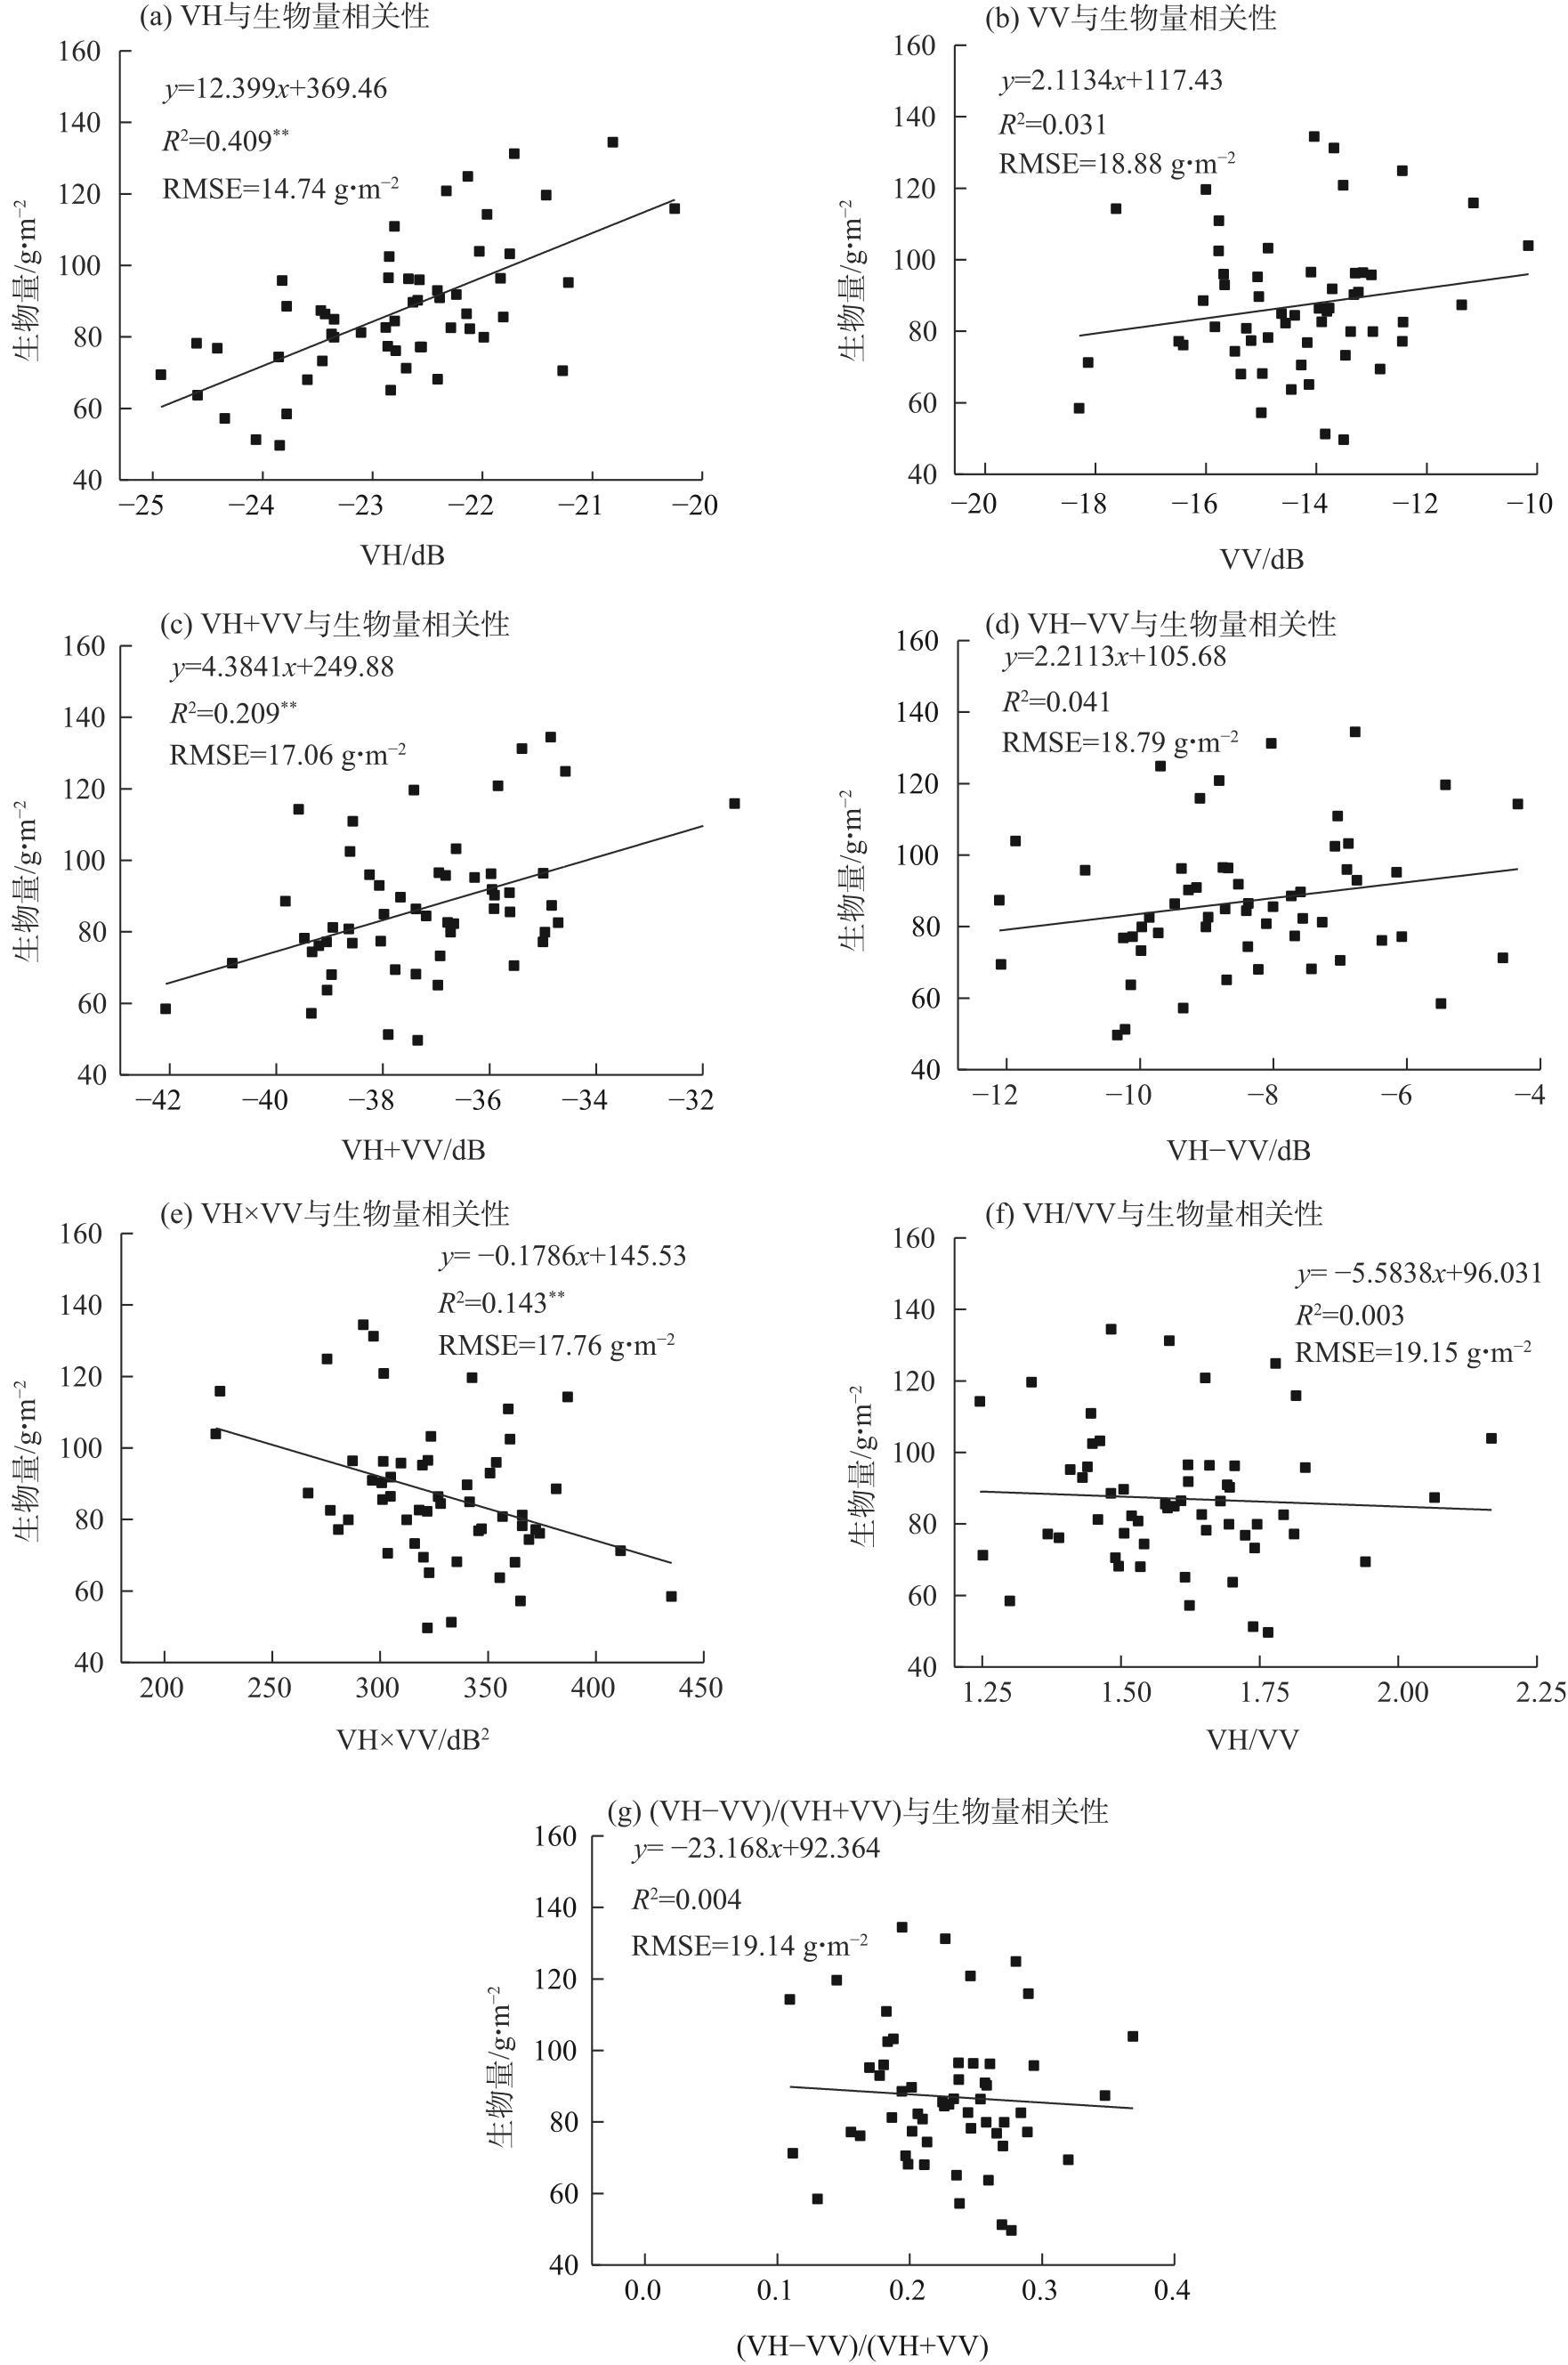
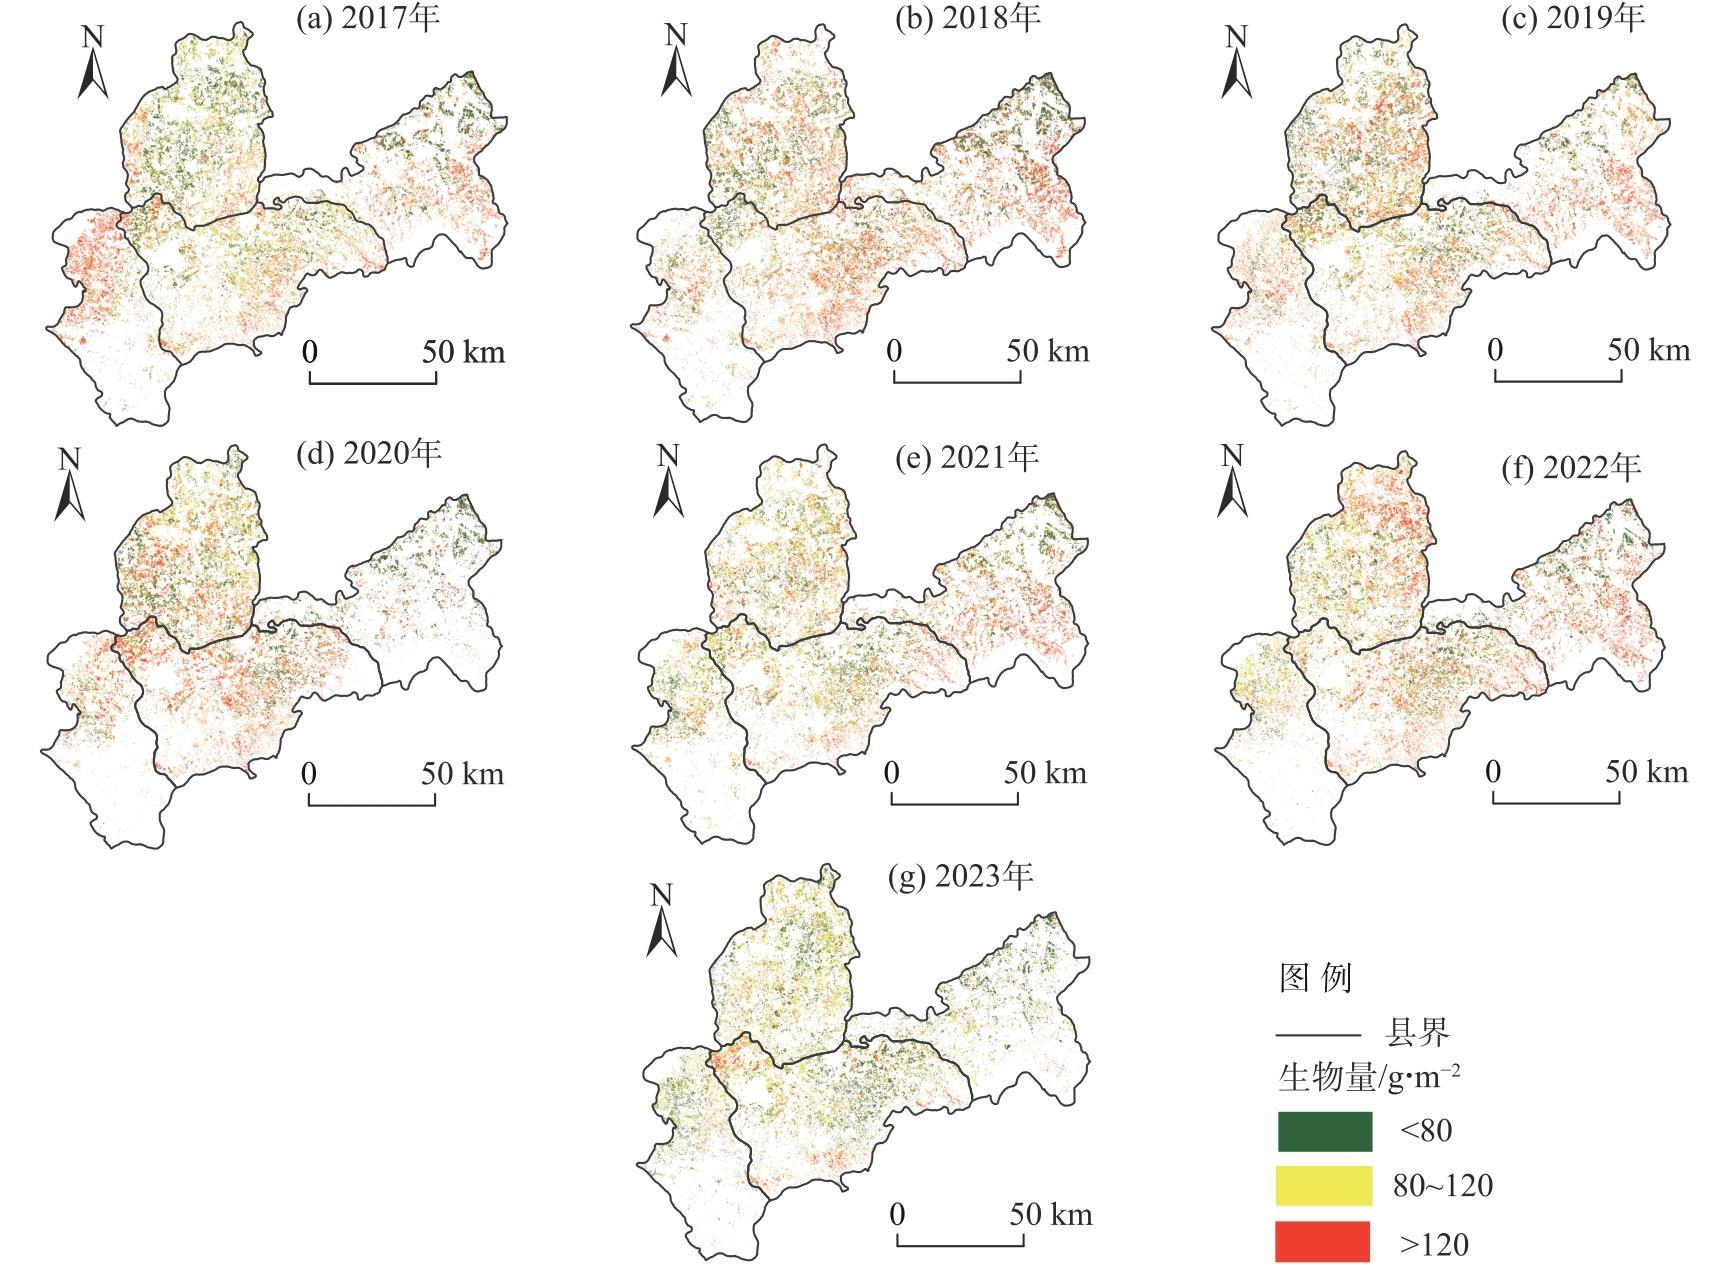
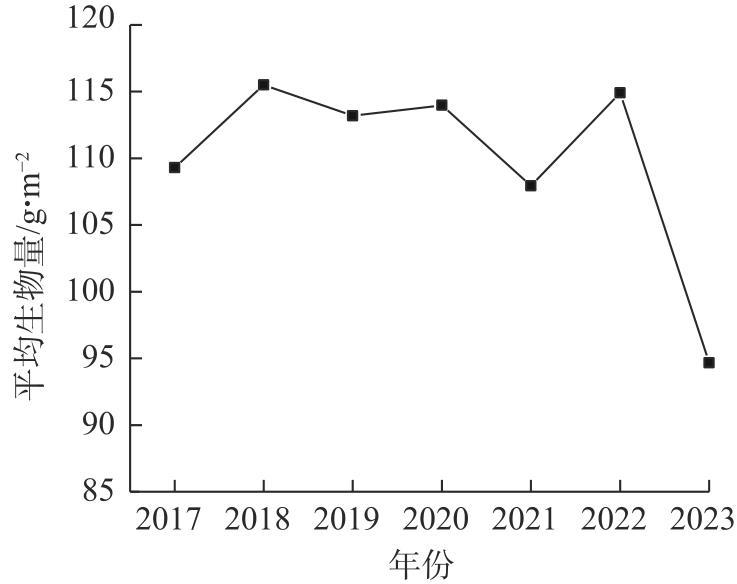
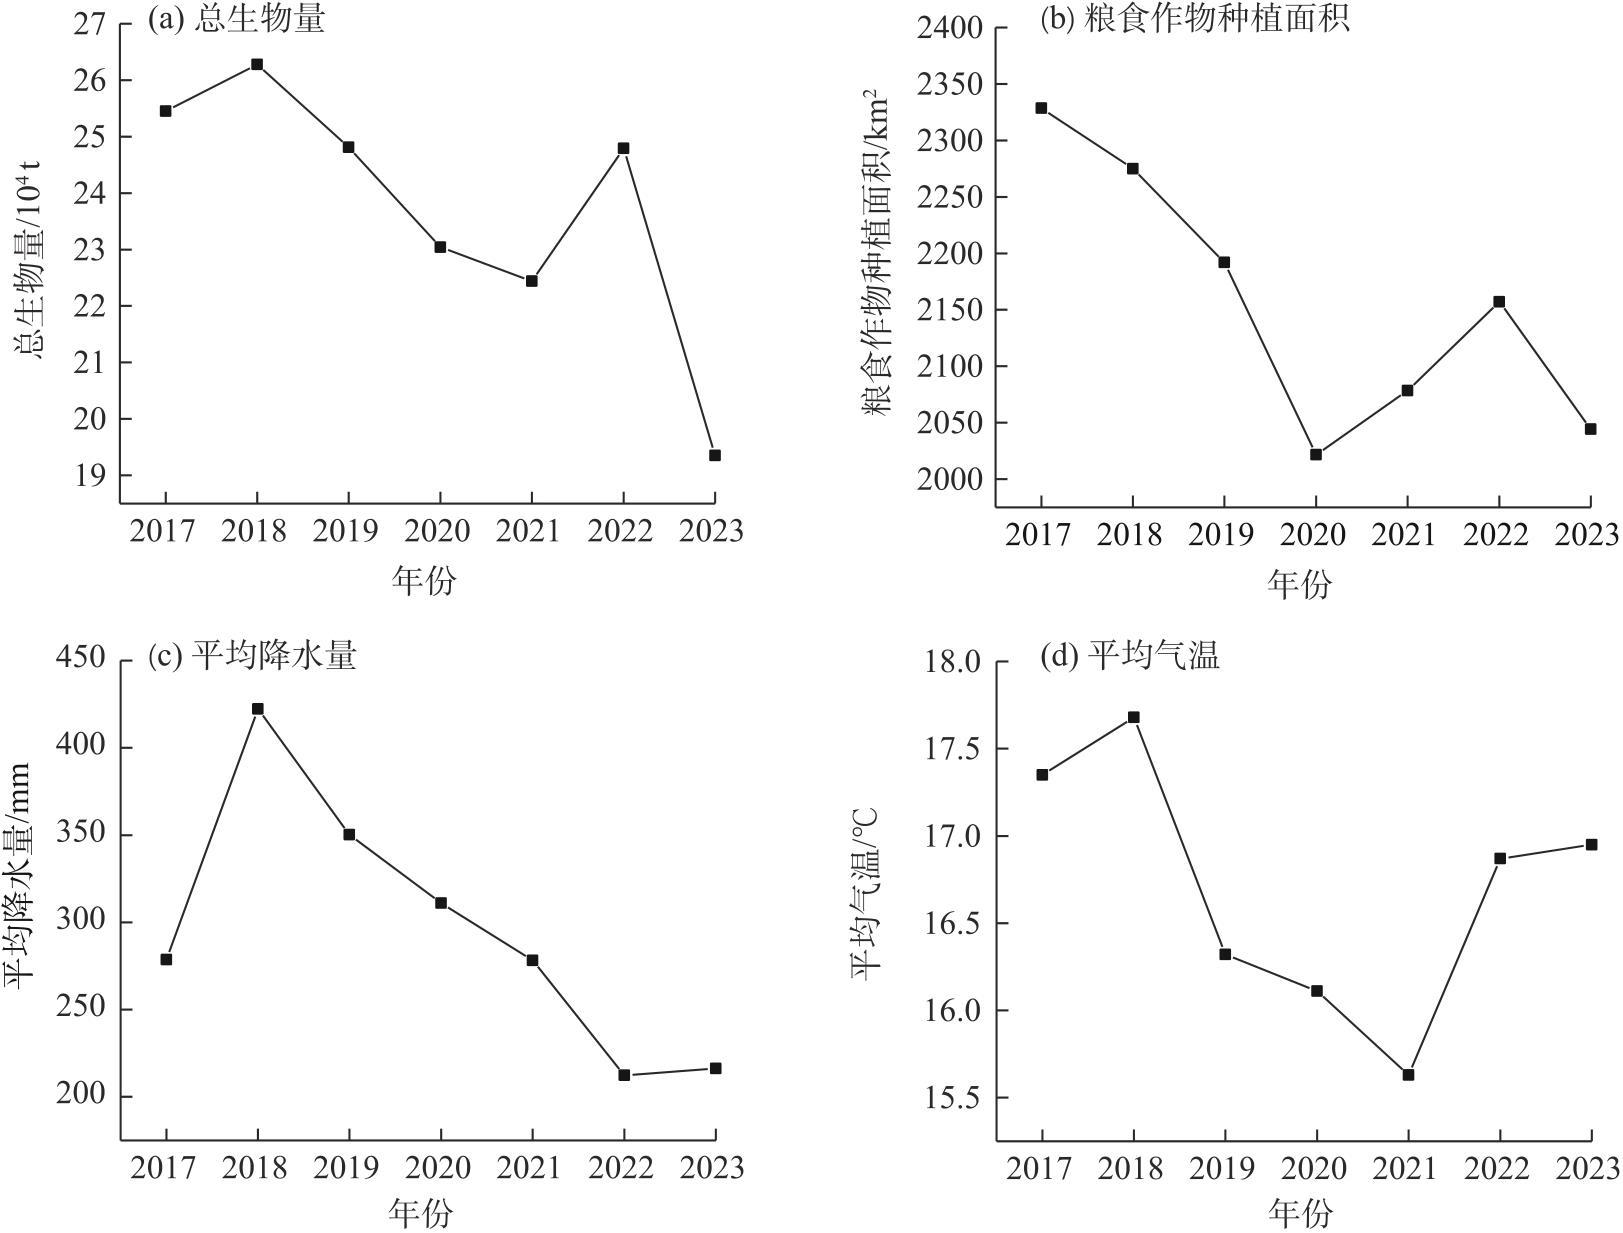
Non-photosynthetic vegetation, such as crop stubble, plays a crucial role in material cycling and energy flow in arid and semi-arid ecosystems. It also significantly contributes to inhibiting soil erosion, retaining soil moisture, and promoting soil development. The Bashang region of Zhangjiakou Hebei Province, China is a core area for the ecological construction of Beijing-Tianjin sandstorm control and the development of the two capital areas. Estimating crop stubble biomass in this region using remote sensing is essential for evaluating regional wind erosion, the ecological environment, and the carbon and nitrogen cycles. This study utilized measured crop stubble biomass, Sentinel-2 optical images, and Sentinel-1 radar images to construct optical and radar remote sensing indices of crop stubble. Using optimal index normalization and multiple linear stepwise regression analysis, an estimation model combining optical and radar remote sensing was developed to calculate and analyze crop stubble biomass in the Bashang region from 2017 to 2023. The results show that: (1) Among the optical remote sensing indices, the RI(11,12) index, derived from Sentinel-2 short-wave infrared bands (B11 and B12), showed the highest correlation with crop stubble biomass, with a determination coefficient (R2) of 0.744. For radar remote sensing indices, the cross-polarization (VH) backscattering coefficient had the highest correlation with crop stubble biomass, achieving an R2 of 0.409. (2) The multivariate linear stepwise regression model demonstrated the highest accuracy, with an R2 of 0.796 and a root mean square error (RMSE) of 8.84 g·m-2, making it a reliable predictor of crop stubble biomass. (3) The estimation model incorporating both optical and radar remote sensing indices improved prediction accuracy by approximately 9.72% compared to optical remote sensing alone and by 66.74% compared to radar remote sensing alone. (4) From 2017 to 2023, the average annual crop stubble biomass in the Bashang region was 23.74×10⁴ t, exhibiting a fluctuating downward trend. Annual variations in crop stubble biomass were influenced by air temperature and precipitation, while changes in planting structures driven by land transfer policies were a significant factor contributing to the decline in recent years.
Kaixin YU , Jifeng LI , Tianle ZHEN , Xialei ZHANG , Huiru LI , Zhongling GUO , Chunping CHANG , Xueqing ZHAO . Estimation of crop stubble biomass in the Bashang region of Zhangjiakou by combining optics and radar remote sensing[J]. Arid Land Geography, 2025 , 48(3) : 455 -466 . DOI: 10.12118/j.issn.1000-6060.2024.169
表1 光学遥感指数与实测作物残茬生物量的线性回归Tab. 1 Linear regression between optical remote sensing indices and measured crop stubble biomass |
| 光学遥感指数 | 公式 | 回归方程 | R2 | RMSE/g·m-2 |
|---|---|---|---|---|
| NDI(11,12) | y=1025.8x+15.856 | 0.738** | 9.81 | |
| NDI(9,12) | y=412.85x+127.98 | 0.479** | 13.85 | |
| NDI(8A,12) | y=395.85x+127.38 | 0.401** | 14.36 | |
| RI(11,12) | y=448.03x-425.06 | 0.744** | 9.70 | |
| RI(12,11) | y=580.98x+595.84 | 0.732** | 9.92 | |
| RI(9,12) | y=249.89x-118.13 | 0.483** | 13.79 |
注:NDI(11,12)、NDI(9,12)、NDI(8A,12)分别为Sentinel-2影像的B11和B12波段、B9和B12波段、B8A和B12波段构建的标准归一化差值指数(NDI);RI(11,12)、RI(12,11)、RI(9,12)分别为Sentinel-2影像的B11和B12波段、B12和B11波段、B9和B12波段构建的比值指数(RI);R(8A)、R(9)、R(11)、R(12)分别为Sentinel-2影像的B8A、B9、B11、B12波段的反射率;R2为决定系数;RMSE为均方根误差;**表示模型在P<0.01水平上显著。下同。 |
表2 光学-雷达遥感结合估算模型Tab. 2 Optical-radar remote sensing combined estimation model |
| 模型名称 | 回归方程 | R2 | RMSE/g·m-2 |
|---|---|---|---|
| VH×NDI(11,12) | y=79.935x+65.077 | 0.701** | 10.48 |
| VH×NDI(9,12) | y=82.827x+67.081 | 0.606** | 12.03 |
| VH×NDI(8A,12) | y=84.679x+66.392 | 0.572** | 12.55 |
| VH×RI(11,12) | y=80.584x+65.463 | 0.705** | 10.41 |
| VH×RI(12,11) | y=-57.735x+97.404 | 0.100 | 18.20 |
| VH×RI(9,12) | y=84.533x+67.768 | 0.605** | 12.06 |
| 多元线性逐步回归模型 | y=354.133RI(11,12)+70.914RI(9,12)+ 1.477(VH+VV)-321.174 | 0.796** | 8.84 |
注:VH为交叉极化;VV为垂直同极化。 |
| [1] |
|
| [2] |
|
| [3] |
|
| [4] |
赵明月, 刘源鑫, 张雪艳. 农田生态系统碳汇研究进展[J]. 生态学报, 2022, 42(23): 9405-9416.
[
|
| [5] |
常琳溪, 梁新然, 王磊, 等. 中国稻田土壤有机碳汇特征与影响因素的研究进展[J]. 土壤, 2023, 55(3): 487-493.
[
|
| [6] |
张越, 陈思宇, 毕鸿儒, 等. 干旱半干旱区农田土壤风蚀特征及参数化研究进展[J]. 中国沙漠, 2022, 42(3): 105-117.
[
|
| [7] |
吴盈盈, 王振亭. 河套平原土壤风蚀风险评估[J]. 干旱区地理, 2023, 46(3): 418-427.
[
|
| [8] |
|
| [9] |
张翼夫, 李洪文, 何进, 等. 玉米秸秆覆盖对坡面产流产沙过程的影响[J]. 农业工程学报, 2015, 31(7): 118-124.
[
|
| [10] |
赵霞, 王秀萍, 刘天学, 等. 麦茬处理方式对土壤蒸发及夏玉米水分利用效率的影响[J]. 耕作与栽培, 2008(4): 9, 32.
[
|
| [11] |
蔺阿荣, 周冬梅, 马静, 等. 基于RWEQ模型的疏勒河流域防风固沙功能价值评估[J]. 干旱区地理, 2024, 47(1): 58-67.
[
|
| [12] |
谭锦, 吴秀芹, 阮永健, 等. 油莎豆(Cyperus esculentus)耕作区作物残茬对农田风蚀的影响[J]. 干旱区地理, 2022, 45(2): 546-556.
[
|
| [13] |
崔明, 赵立欣, 田宜水, 等. 中国主要农作物秸秆资源能源化利用分析评价[J]. 农业工程学报, 2008, 24(12): 291-296.
[
|
| [14] |
高利伟, 马林, 张卫峰, 等. 中国作物秸秆养分资源数量估算及其利用状况[J]. 农业工程学报, 2009, 25(7): 173-179.
[
|
| [15] |
谢光辉, 王晓玉, 任兰天. 中国作物秸秆资源评估研究现状[J]. 生物工程学报, 2010, 26(7): 855-863.
[
|
| [16] |
赵越, 徐大伟, 范凯凯, 等. Landsat 8和机器学习估算蒙古高原草地地上生物量[J]. 农业工程学报, 2022, 38(24): 138-144.
[
|
| [17] |
郭芮, 伏帅, 侯蒙京, 等. 基于Sentinel-2数据的青海门源县天然草地生物量遥感反演研究[J]. 草业学报, 2023, 32(4): 15-29.
[
|
| [18] |
|
| [19] |
雷步云. 基于全极化雷达数据的冬小麦作物残茬生物量估算研究[D]. 南京: 南京大学, 2017.
[
|
| [20] |
|
| [21] |
张淼, 李强子, 蒙继华, 等. 作物残茬覆盖度遥感监测研究进展[J]. 光谱学与光谱分析, 2011, 31(12): 3200-3205.
[
|
| [22] |
冯哲, 刘瑞娟, 白宇晨, 等. 农田近地表风沙流风程效应变化特征研究[J]. 干旱区地理, 2022, 45(5): 1500-1512.
[
|
| [23] |
刘之榆, 刘忠, 万炜, 等. SAR与光学遥感影像的玉米秸秆覆盖度估算[J]. 遥感学报, 2021, 25(6): 1308-1323.
[
|
| [24] |
|
| [25] |
|
| [26] |
|
| [27] |
|
/
| 〈 |
|
〉 |