



Spatio-temporal pattern evolution and influencing factors of main crops production in arid region: A case of Xinjiang
Received date: 2024-03-26
Revised date: 2024-04-15
Online published: 2026-03-11
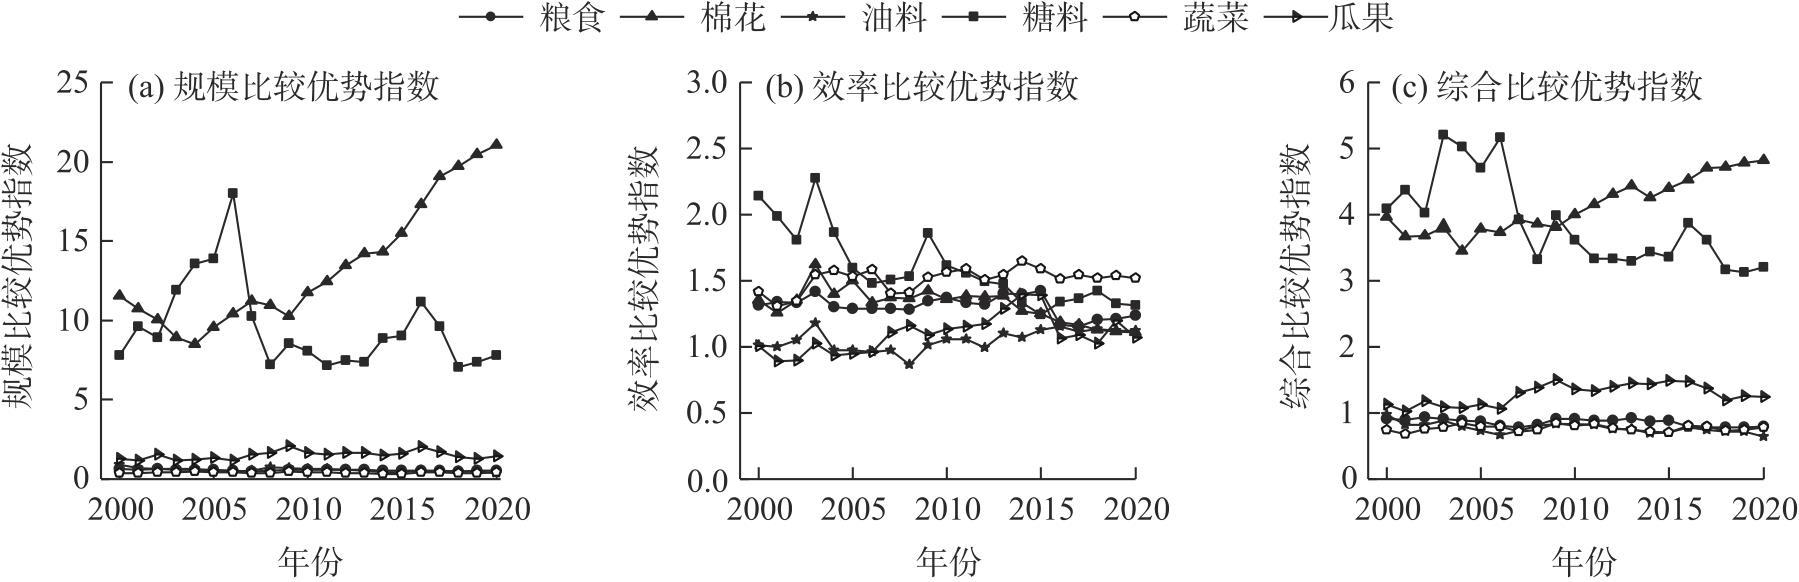
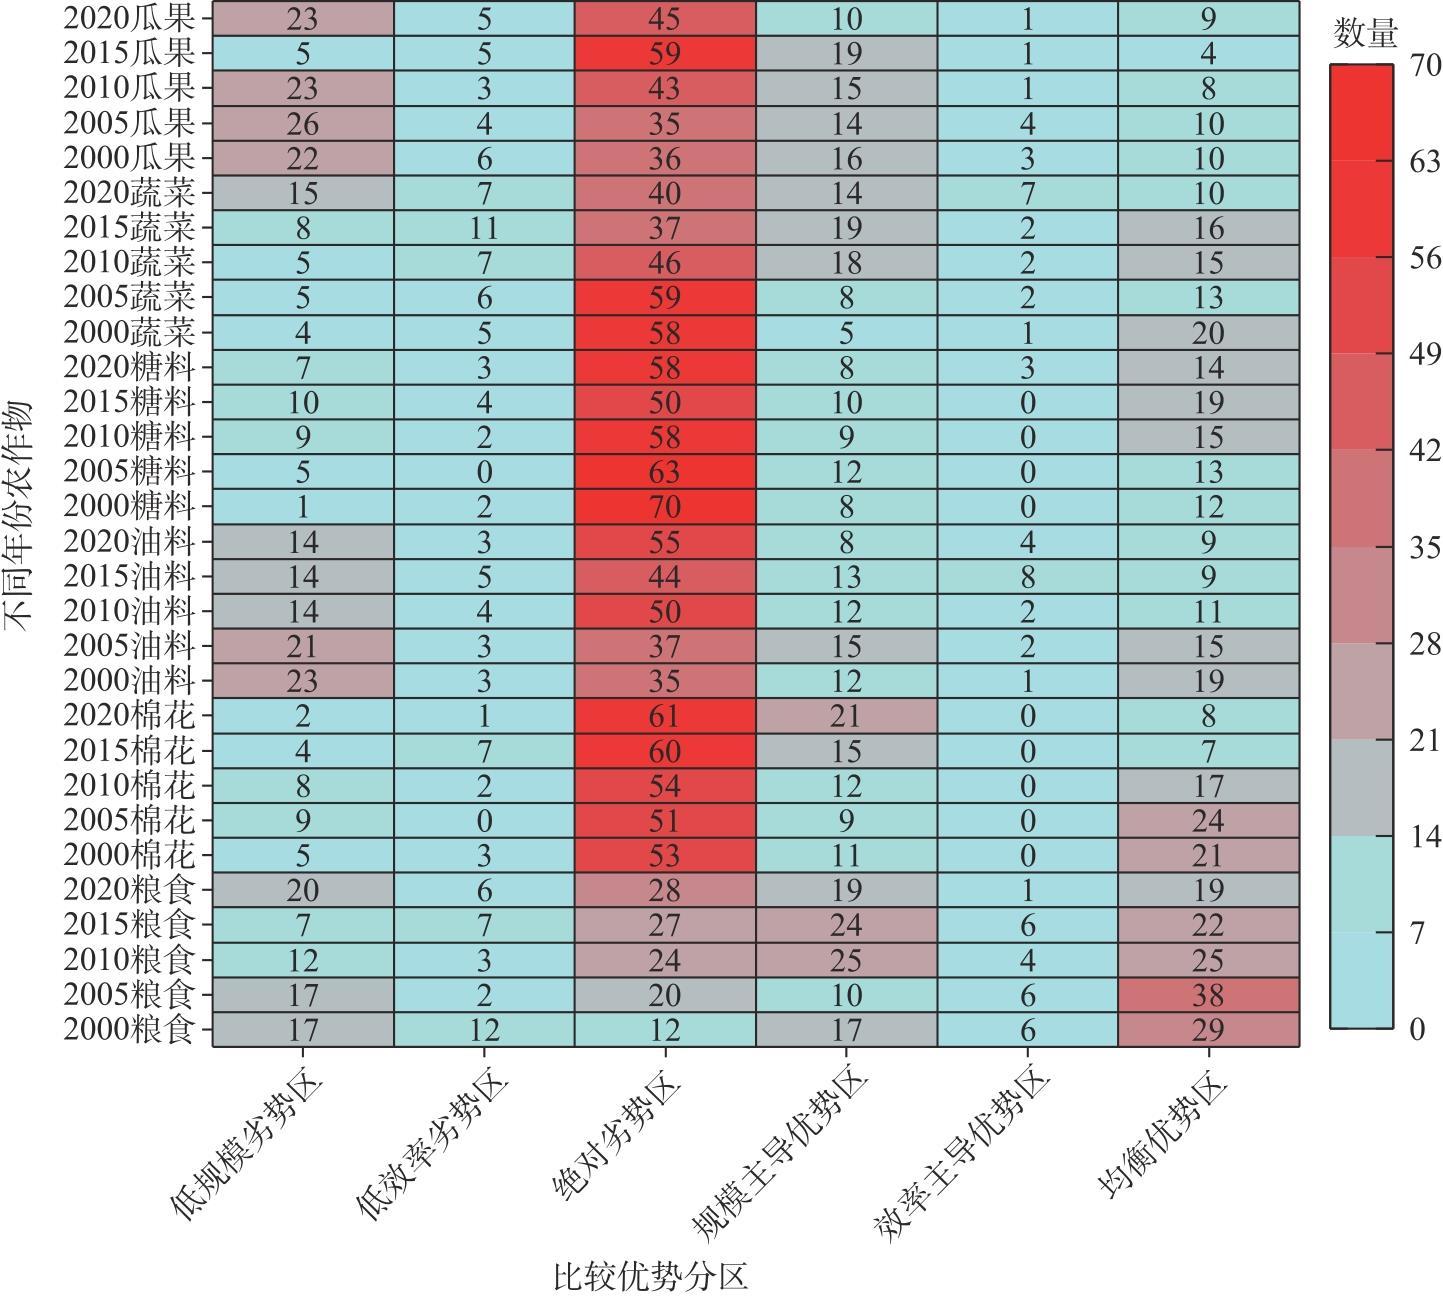
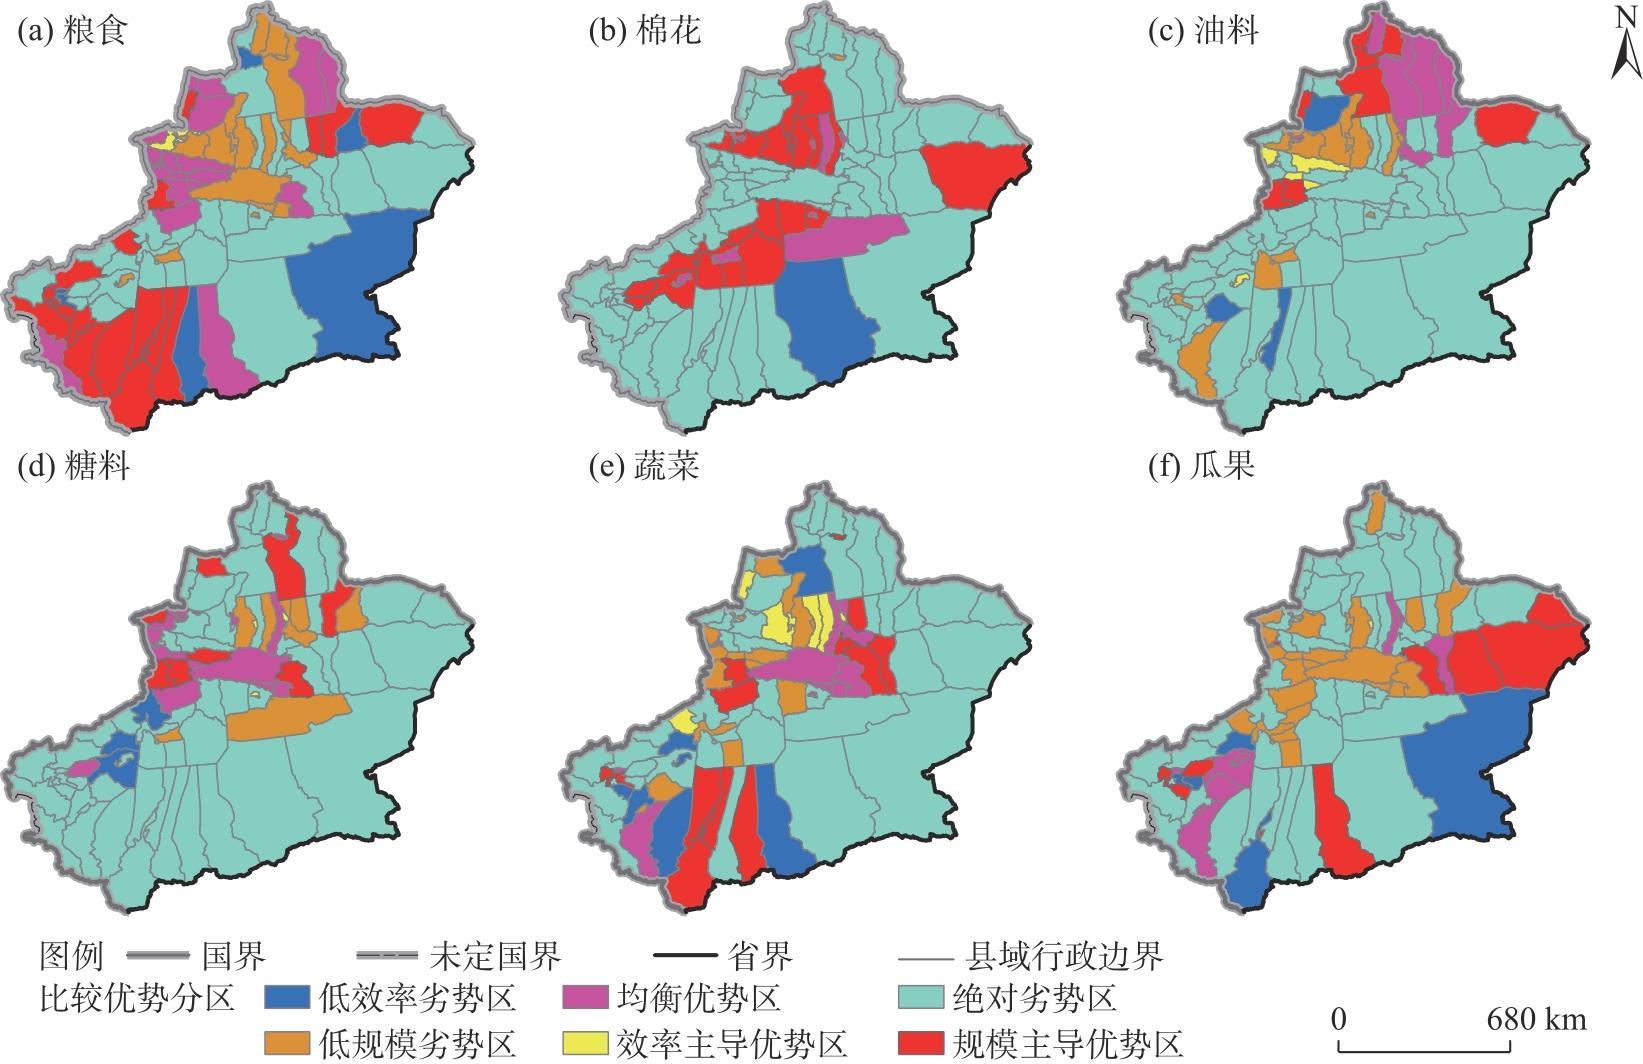
Agriculture in arid regions plays a vital role in advancing local socio-economic development and ecological sustainability, given the unique resource and environmental constraints. This study examines Xinjiang, China, as a case study, utilizing the center of gravity transfer model, locational Gini coefficient, comparative advantage index, and global Moran’s I index at the county level to analyze the spatio-temporal evolution and influencing factors of the six major crops from 2000 to 2020. The results indicate that: (1) Xinjiang’s agricultural planting scale has been growing steadily from 2000 and 2020, and cotton, vegetables, and melons “advancing”, grain, oil, and sugar crops “restreating” constitute the basic competitive situation of the major crops. (2) The production centers for the six major crops are predominantly located in the central and western regions of Xinjiang. The concentration of cotton, vegetables, and melon production has steadily increased, with production becoming concentrated in a relatively small number of counties. (3) At the national level, all six major crops exhibit efficiency comparative advantages. Cotton, sugar, and melon production demonstrate both scale and comprehensive comparative advantages, with cotton showing a particularly pronounced scale advantage. At the regional level, most counties in Xinjiang lack comparative advantages in crop production. Counties with comparative advantages are primarily scale-dominated. (4) The evolution of Xinjiang’s crop production pattern has been influenced by several critical factors, including policy directives, technological advancements, and rising farmer incomes.
Key words: crops; spatio-temporal pattern; comparative advantage; arid region; Xinjiang
Fuhong WANG , Yong XIA . Spatio-temporal pattern evolution and influencing factors of main crops production in arid region: A case of Xinjiang[J]. Arid Land Geography, 2025 , 48(3) : 444 -454 . DOI: 10.12118/j.issn.1000-6060.2024.201
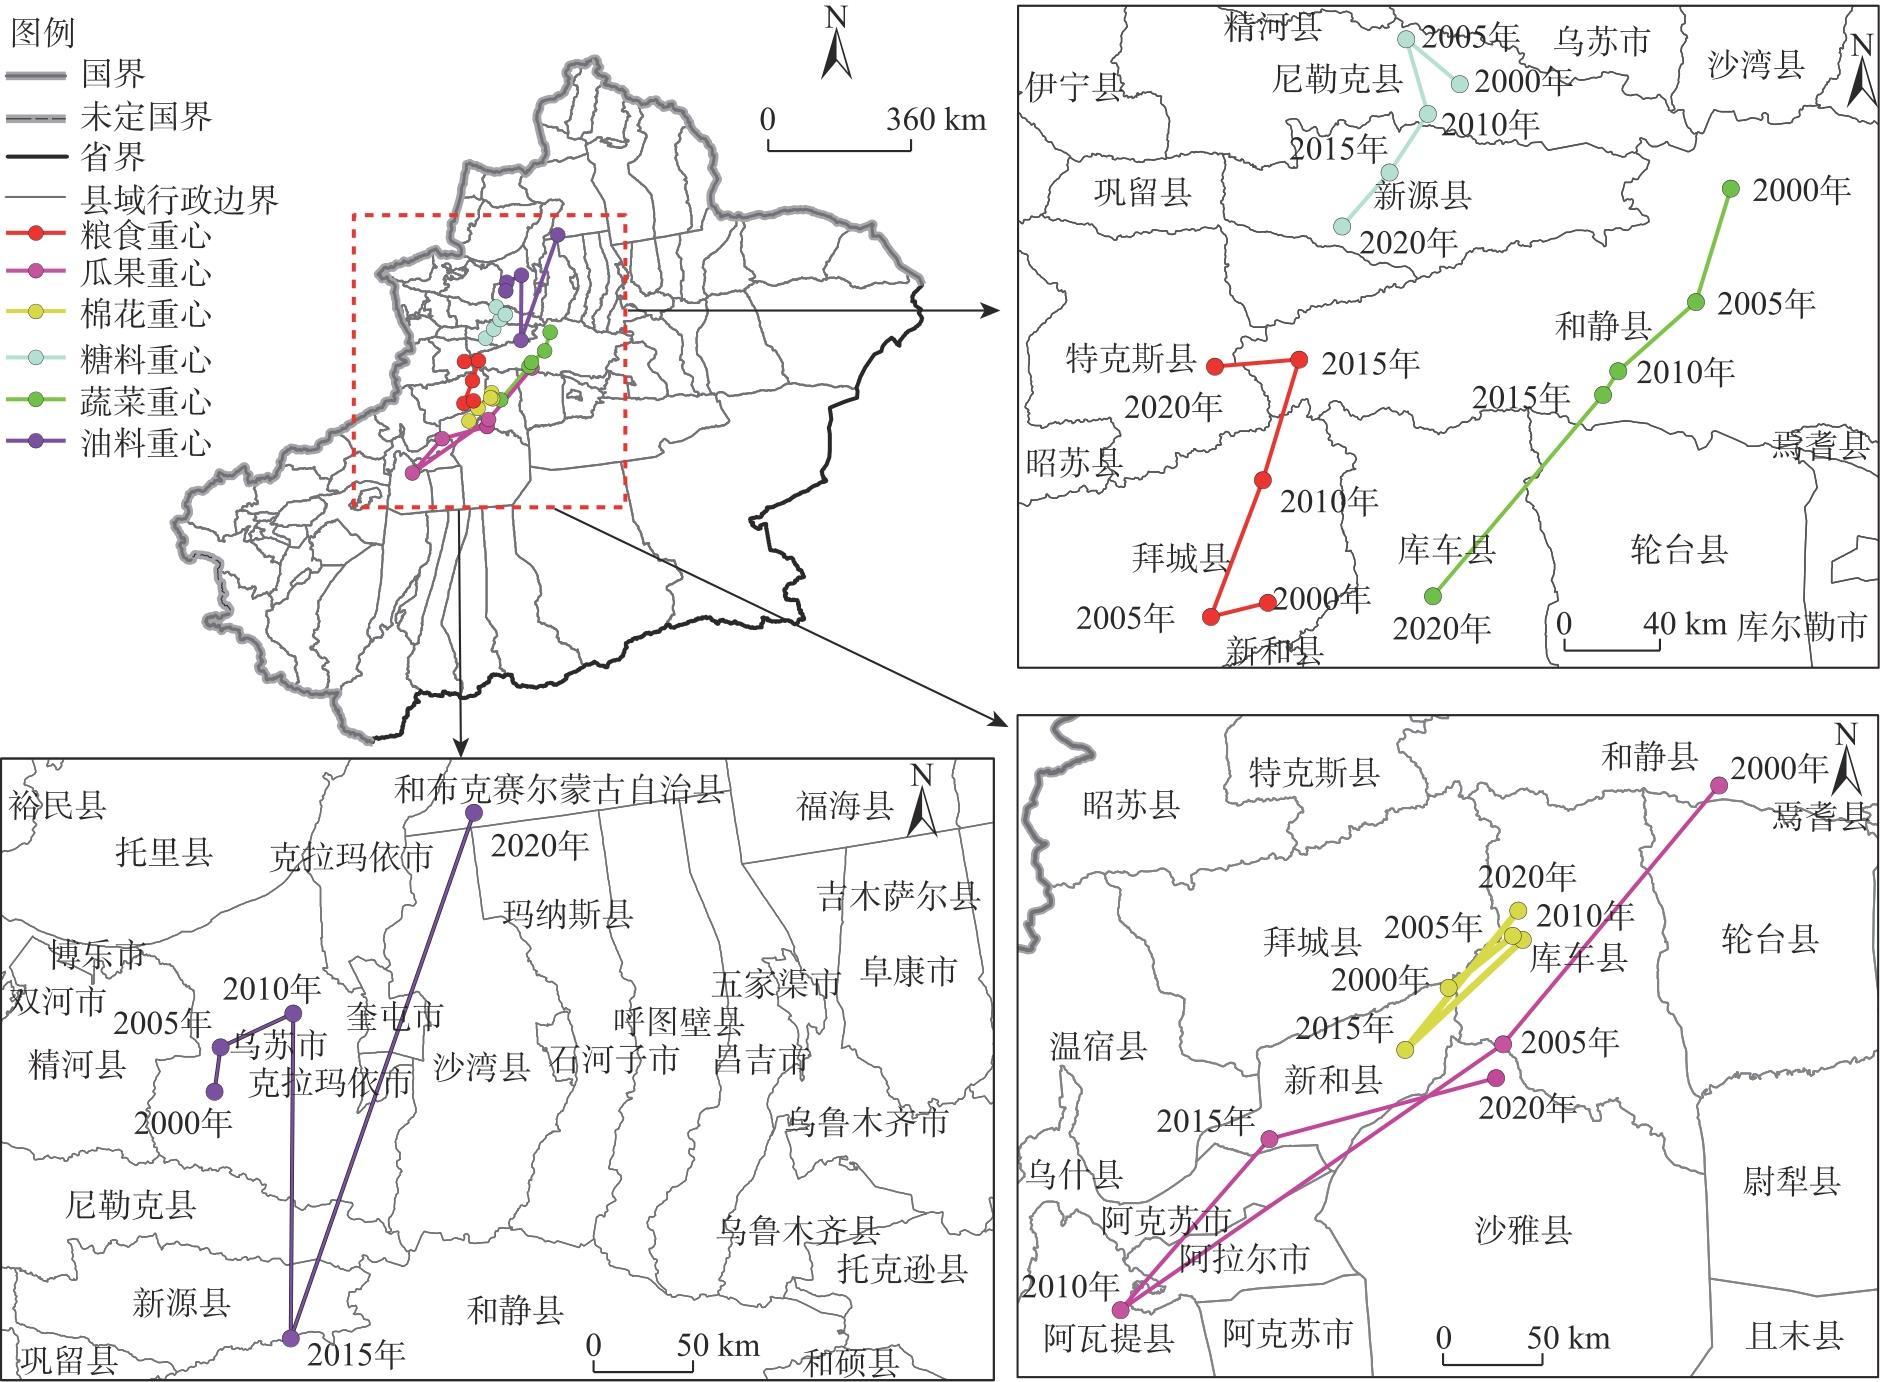
表1 2000—2020年新疆主要农作物产量重心迁移距离Tab. 1 Moving distance of gravity center of major crops yield in Xinjiang from 2000 to 2020 /km |
| 年份 | 粮食 | 棉花 | 蔬菜 | 瓜果 | 油料 | 糖料 |
|---|---|---|---|---|---|---|
| 2000—2005 | 32.54 | 51.38 | 52.79 | 199.75 | 23.04 | 34.98 |
| 2005—2010 | 65.48 | 7.02 | 54.15 | 290.94 | 54.62 | 32.99 |
| 2010—2015 | 55.51 | 98.27 | 13.48 | 133.01 | 163.75 | 34.00 |
| 2015—2020 | 48.01 | 105.33 | 131.08 | 154.42 | 302.63 | 36.56 |
| 2000—2020 | 101.75 | 62.02 | 246.95 | 215.42 | 238.47 | 92.79 |
图3 2000—2020年新疆主要农作物产量重心迁移轨迹注:基于自然资源部标准地图服务网站审图号为GS(2016)2556号的标准地图制作,底图边界无修改。下同。 Fig. 3 Migration trajectory of gravity center of major crops yield in Xinjiang from 2000 to 2020 |
表2 新疆主要农作物生产SAI、EAI和AAI指数全局Moran’s ITab. 2 Global Moran’s I of SAI, EAI, AAI of major crops production in Xinjiang |
| 作物 | 指数 | 2000年 | 2005年 | 2010年 | 2015年 | 2020年 |
|---|---|---|---|---|---|---|
| 粮食 | SAI | 0.439 | 0.401 | 0.448 | 0.434 | 0.457 |
| EAI | 0.191 | 0.225 | 0.243 | 0.318 | 0.219 | |
| AAI | 0.340 | 0.343 | 0.427 | 0.441 | 0.370 | |
| 棉花 | SAI | 0.481 | 0.464 | 0.475 | 0.467 | 0.495 |
| EAI | 0.399 | 0.435 | 0.415 | -0.022 | 0.313 | |
| AAI | 0.521 | 0.482 | 0.485 | 0.306 | 0.477 | |
| 油料 | SAI | 0.431 | 0.372 | 0.446 | 0.432 | 0.497 |
| EAI | 0.004 | 0.197 | 0.220 | -0.008 | 0.034 | |
| AAI | 0.521 | 0.548 | 0.622 | 0.181 | 0.492 | |
| 糖料 | SAI | 0.266 | 0.351 | 0.315 | 0.402 | 0.247 |
| EAI | 0.481 | 0.471 | 0.513 | 0.591 | 0.302 | |
| AAI | 0.430 | 0.490 | 0.460 | 0.492 | 0.343 | |
| 蔬菜 | SAI | 0.199 | 0.208 | 0.239 | 0.299 | 0.233 |
| EAI | 0.209 | 0.309 | 0.377 | 0.227 | 0.251 | |
| AAI | 0.258 | 0.279 | 0.318 | 0.269 | 0.302 | |
| 瓜果 | SAI | 0.087 | 0.143 | 0.215 | 0.196 | 0.126 |
| EAI | 0.243 | -0.028 | 0.112 | 0.123 | 0.082 | |
| AAI | 0.175 | 0.225 | 0.317 | 0.275 | 0.217 |
注:SAI、EAI和AAI分别为规模比较优势指数、效率比较优势指数和综合比较优势指数。 |
表3 模型效应和因变量权数及模型效应负荷量Tab. 3 Dependent variable weights and model effect loadings |
| 类型 | 项目 | 农村居民 人均收入 | 城镇化率 | 耕地面积 | 农业用水量 | 农业支出占财政比例 | 第一产业 贡献率 | 农业机械 总动力 | 货物周转量 |
|---|---|---|---|---|---|---|---|---|---|
| 规模比较优势 | 模型效应和因变量权数 | 0.3966 | 0.4105 | 0.3959 | 0.1936 | 0.4234 | 0.3484 | 0.4089 | 0.3820 |
| 模型效应负荷量 | 0.3989 | 0.3974 | 0.3868 | 0.2089 | 0.4013 | 0.3482 | 0.3958 | 0.3951 | |
| 效率比较优势 | 模型效应和因变量权数 | 0.3796 | 0.3508 | 0.4207 | 0.2348 | 0.4244 | 0.3144 | 0.4436 | 0.3716 |
| 模型效应负荷量 | 0.3905 | 0.4083 | 0.4050 | 0.1630 | 0.3969 | 0.3800 | 0.4043 | 0.3884 | |
| 综合比较优势 | 模型效应和因变量权数 | 0.4124 | 0.3994 | 0.4077 | 0.1337 | 0.4054 | 0.3854 | 0.4136 | 0.3934 |
| 模型效应负荷量 | 0.4084 | 0.3950 | 0.4184 | 0.1433 | 0.3855 | 0.3794 | 0.3921 | 0.4051 |
| [1] |
|
| [2] |
杜蓉, 柳思维, 蔡荣. 中国粮食空间生产格局演变特征及其驱动机制[J]. 经济问题, 2023(8): 92-102.
[
|
| [3] |
陈晓艺, 姚筠, 霍彦峰, 等. 安徽省主要气象灾害趋势演变及其对粮食总产的影响[J]. 长江流域资源与环境, 2020, 29(10): 2285-2295.
[
|
| [4] |
屠爽爽, 简代飞, 龙花楼, 等. 广西主要农作物生产格局演变特征与机制研究[J]. 地理学报, 2022, 77(9): 2322-2337.
[
|
| [5] |
|
| [6] |
国家统计局. 中国统计年鉴2023[M]. 北京: 中国统计出版社, 2023.
[National Bureau of Statistics of China. China statistical yearbook 2023[M]. Beijing: China Statistics Press, 2023. ]
|
| [7] |
唐华俊, 吴文斌, 杨鹏, 等. 农作物空间格局遥感监测研究进展[J]. 中国农业科学, 2010, 43(14): 2879-2888.
[
|
| [8] |
彭晖, 张嘉望, 李博阳. 我国农产品生产集聚的时空格局及影响因素——以蔬菜生产为例[J]. 西北农林科技大学学报(社会科学版), 2017, 17(6): 81-90.
[
|
| [9] |
李二玲, 庞安超, 朱纪广. 中国农业地理集聚格局演化及其机制[J]. 地理研究, 2012, 31(5): 885-898.
[
|
| [10] |
杨宗辉, 李金锴, 韩晨雪, 等. 我国粮食生产重心变迁及其影响因素研究[J]. 农业现代化研究, 2019, 40(1): 36-43.
[
|
| [11] |
|
| [12] |
李二玲, 胥亚男, 雍雅君, 等. 农业结构调整与中国乡村转型发展——以河南省巩义市和鄢陵县为例[J]. 地理科学进展, 2018, 37(5): 698-709.
[
|
| [13] |
吴娜琳, 卫怡珂, 李立, 等. 县域非粮作物空间格局及其形成机制——来自河南省宁陵县的实证分析[J]. 地理科学进展, 2023, 42(7): 1298-1310.
[
|
| [14] |
任频频, 李保国, 黄峰. 农作物种植结构演变下的黄淮海旱作区小麦玉米生产时空格局[J]. 资源科学, 2022, 44(3): 436-449.
[
|
| [15] |
曹永强, 李维佳, 袁立婷. 河北省主要农作物生产时空格局变化特征及安全评价[J]. 地理科学, 2018, 38(8): 1319-1327.
[
|
| [16] |
|
| [17] |
|
| [18] |
|
| [19] |
|
| [20] |
|
| [21] |
张志高, 范留飞, 马晓慧, 等. 2007—2015年新疆粮食增产格局及贡献因素研究[J]. 干旱区资源与环境, 2018, 32(9): 71-75.
[
|
| [22] |
王福红, 夏咏. 中国耕地集约化利用不平衡不充分特征及成因[J]. 资源科学, 2024, 46(1): 130-144.
[
|
| [23] |
姚成胜, 杨一单, 殷伟. 中国非主粮生产的地理集聚特征及其空间演化机制[J]. 经济地理, 2020, 40(12): 155-165.
[
|
| [24] |
梁常安, 杜国明, 郝均. 中国农业技术创新的时空格局及其诱致性[J]. 干旱区地理, 2023, 46(4): 667-677.
[
|
| [25] |
谭晓艳, 张晓恒, 游良志. 自然因素和政策干预对中国棉花生产布局变迁的影响[J]. 农业技术经济, 2020(4): 79-93.
[
|
| [26] |
张建华. 一种简便易用的基尼系数计算方法[J]. 山西农业大学学报(社会科学版), 2007, 23(3): 275-278, 283.
[
|
| [27] |
赵文智, 任珩, 杜军, 等. 河西走廊绿洲生态建设和农业发展的若干思考与建议[J]. 中国科学院院刊, 2023, 38(3): 424-434.
[
|
| [28] |
赵锐锋, 王福红, 张丽华, 等. 黑河中游地区耕地景观演变及社会经济驱动力分析[J]. 地理科学, 2017, 37(6): 920-928.
[
|
| [29] |
刘珍环, 杨鹏, 吴文斌, 等. 近30年中国农作物种植结构时空变化分析[J]. 地理学报, 2016, 71(5): 840-851.
[
|
| [30] |
栾军强, 王荣成, 朱子媛, 等. 山东省粮食供需变动下农业生产格局研究[J]. 中国农业资源与区划, 2021, 42(8): 201-209.
[
|
/
| 〈 |
|
〉 |