Plant Ecology

Vegetation coverage characteristics of different topography and landforms in ten tributaries of the Ordos Plateau

  • Qimin MA , 1, 2 ,
  • Hanrui DU 1 ,
  • Zhengming WANG 1 ,
  • Yinping LONG , 1
Expand
  • 1. College of Resources and Environment, Chengdu University of Information Technology, Chengdu 610225, Sichuan, China
  • 2. National Cryosphere Desert Data Center, Northwest Institute of Eco-Environment and Resources, Chinese Academy of Sciences, Lanzhou 730070, Gansu, China

Received date: 2024-04-16

  Revised date: 2024-05-31

  Online published: 2026-03-11

Abstract

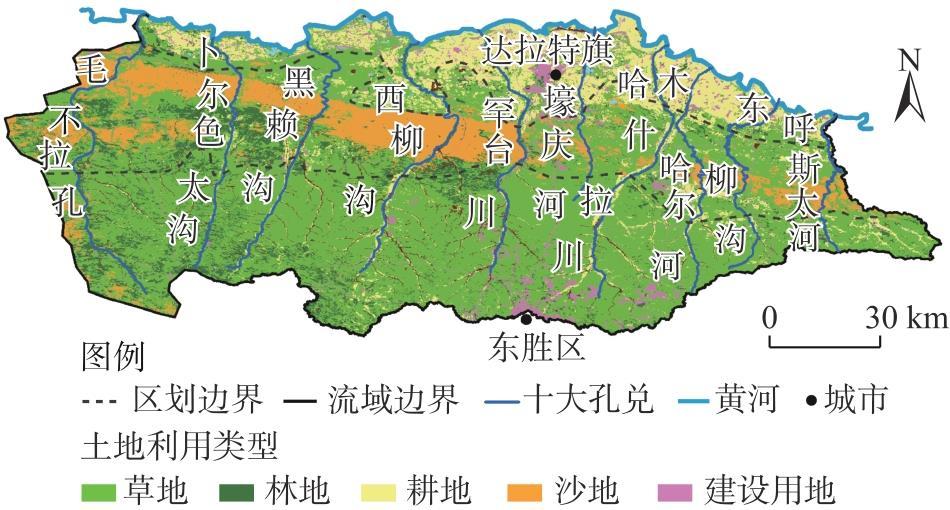
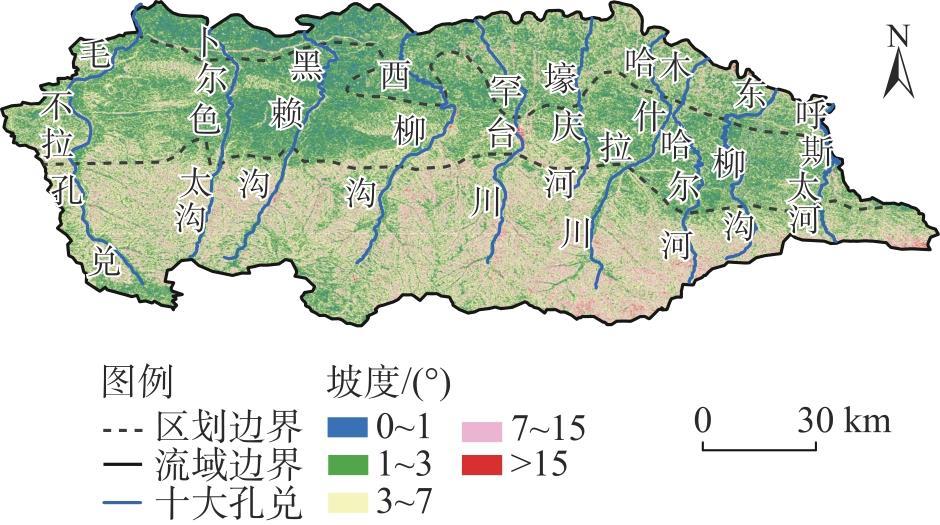
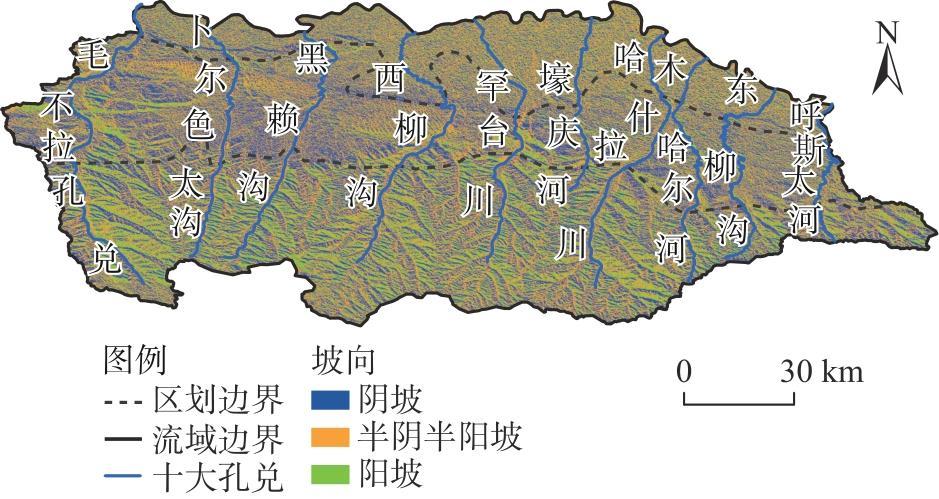
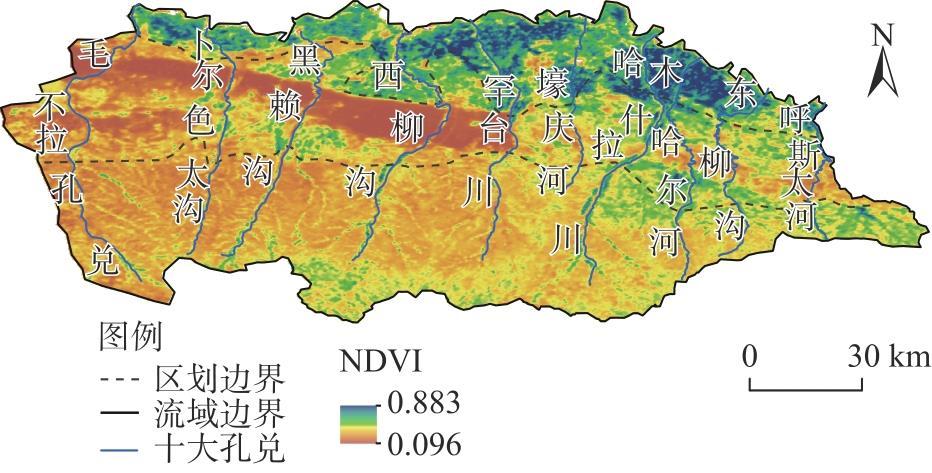
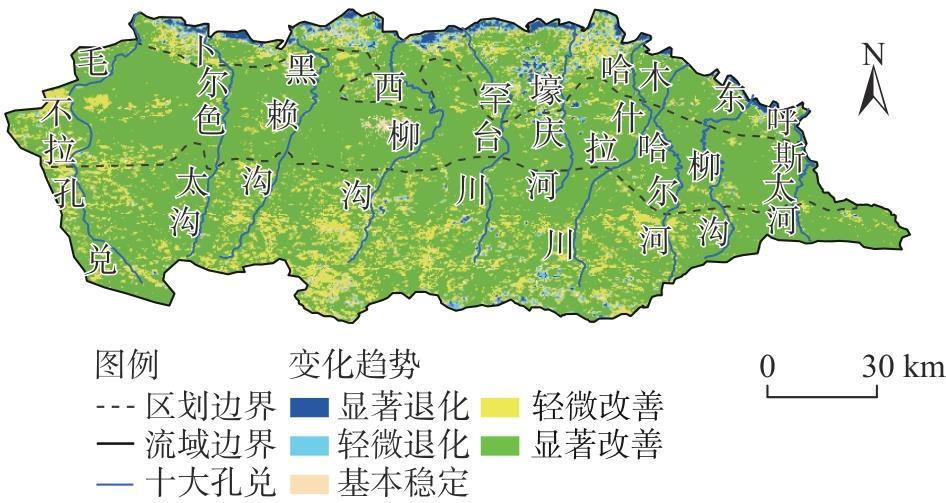
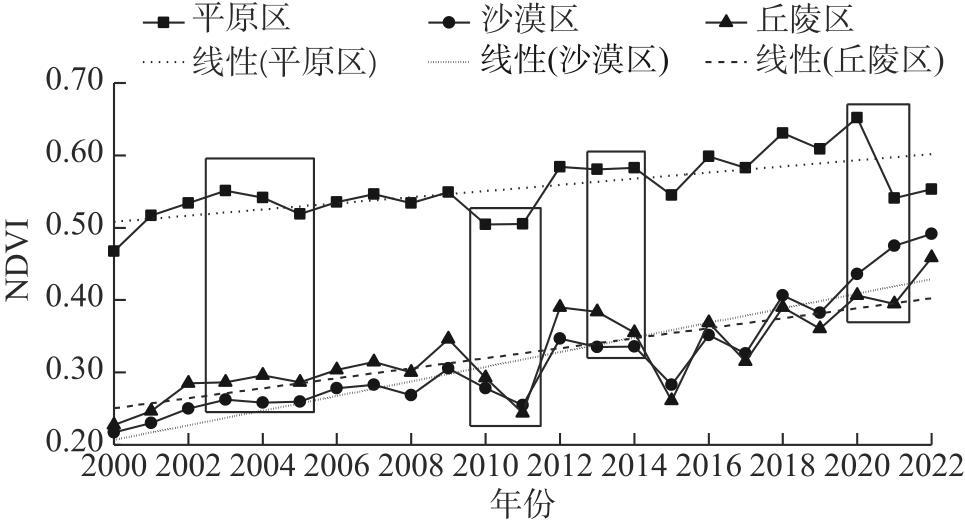
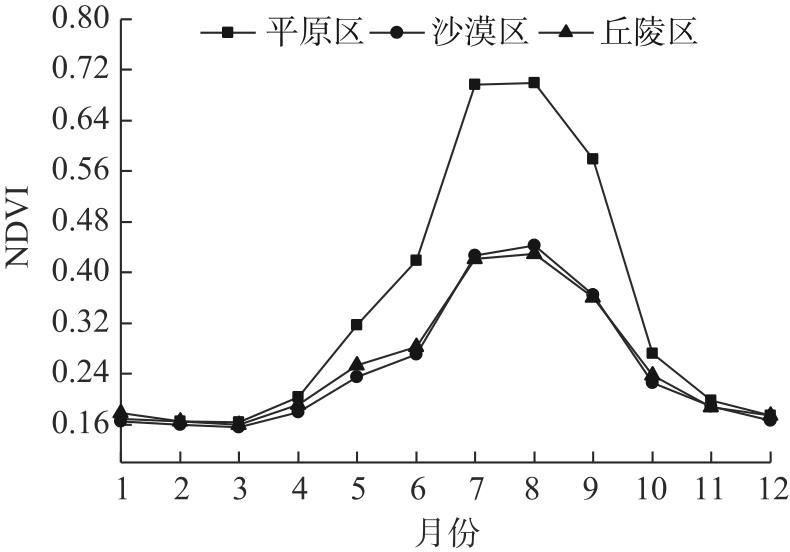
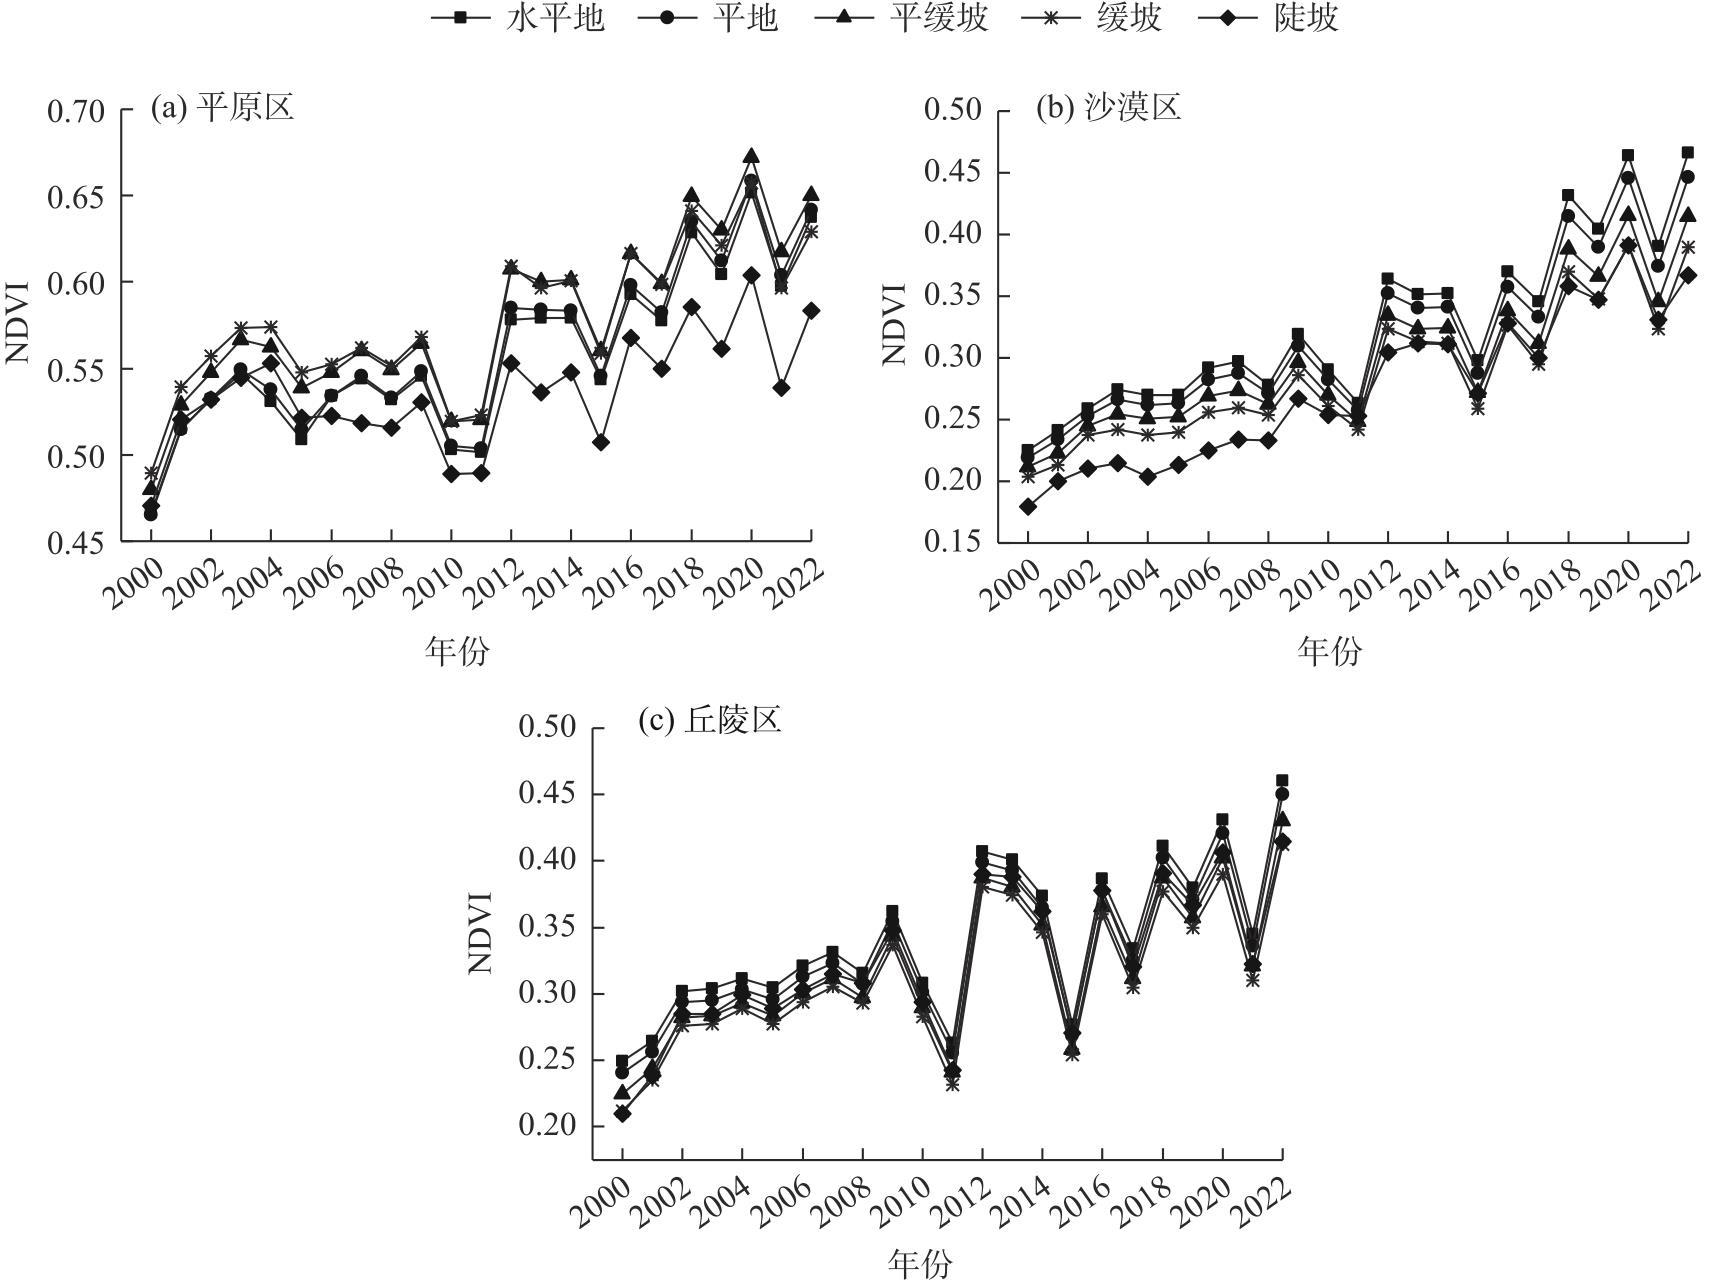
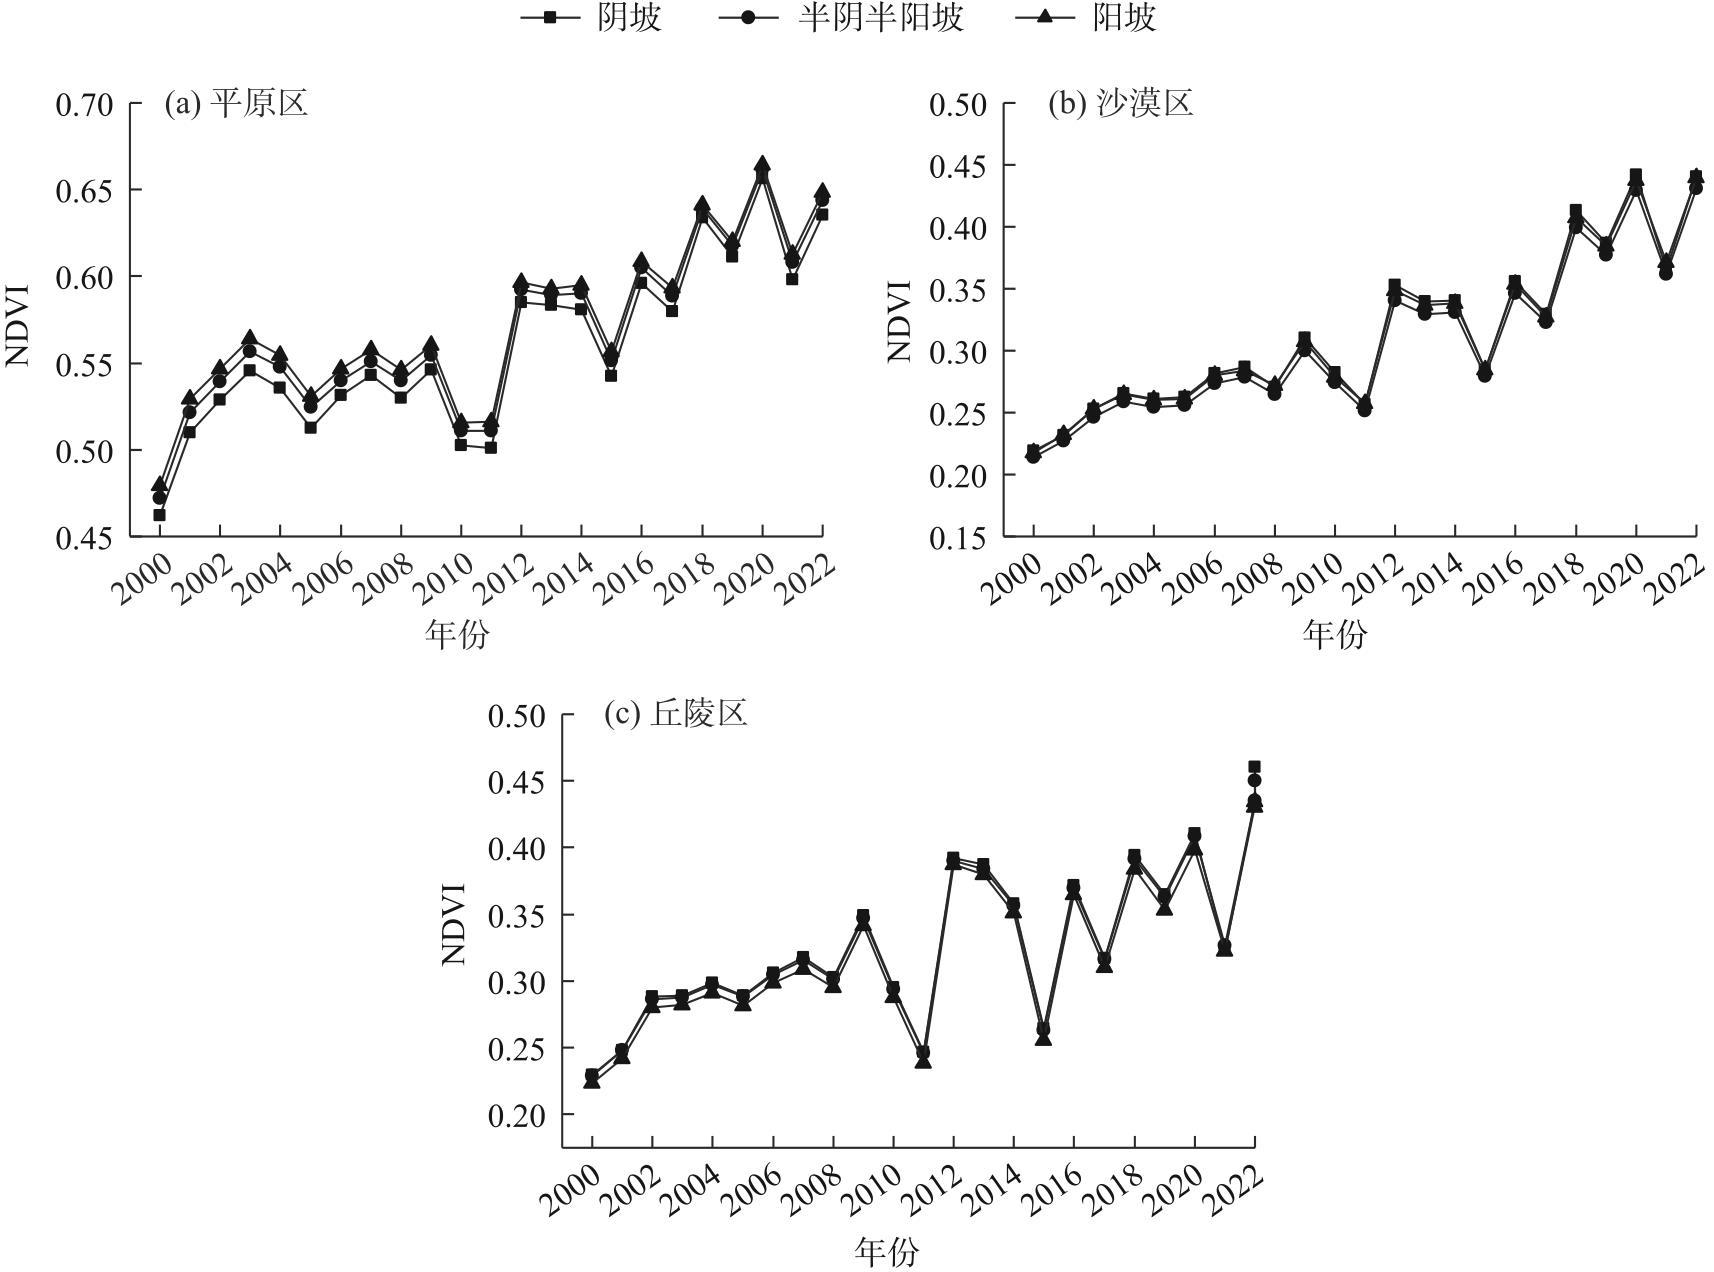
Artificial grass and tree planting have effectively mitigated soil erosion in the ten tributaries of the Ordos Plateau, Inner Mongolia, China. However, some regions have experienced vegetation degradation. Understanding the influence of topography on vegetation is critical for soil and water conservation efforts in this area. This study analyzed vegetation changes across different topographies and landforms in the ten tributaries from 2000 to 2022, utilizing digital elevation model (DEM) data from the ZY3-01 satellite and normalized difference vegetation index (NDVI) data from MODIS. The findings are as follows: (1) The overall vegetation in the ten tributaries improved, with the NDVI of different landform types showing an upward trend. The multi-year average NDVI values for plain, hilly, and desert areas were 0.591, 0.337, and 0.325, respectively. The most pronounced improvement occurred in the desert area. Vegetation degradation accounted for 16.28% of the plain area (mainly along the Yellow River), 0.64% of the desert area (predominantly in the middle reaches of the Haoqing River), and 1.88% of the hilly area (primarily in the upper reaches of Xiliugou, Hantaichuan, and Hashilachuan). (2) In the plain area, NDVI on flat gentle slopes and gentle slopes exceeded that on horizontal and flat land. In the desert area, NDVI followed the trend: horizontal land>flat land>flat gentle slope>gentle slope>steep slope. Similarly, in the hilly area, NDVI trends mirrored those of the desert area; however, from 2000 to 2022, NDVI on steep slopes surpassed that on flat gentle slopes and gentle slopes but remained lower than that on horizontal and flat land. (3) From 2000 to 2022, in the plain area, NDVI followed the trend: sunny slope>half-sunny slope>shady slope. Conversely, in the desert area, NDVI followed the trend: shady slope>sunny slope>half-sunny slope. In the hilly area, the trend was shady slope>half-sunny slope>sunny slope. These findings suggest that desert and hilly areas would benefit from planting vegetation on horizontal or flat land and on shady slopes with lower gradients for sloping areas.

Cite this article

Qimin MA , Hanrui DU , Zhengming WANG , Yinping LONG . Vegetation coverage characteristics of different topography and landforms in ten tributaries of the Ordos Plateau[J]. Arid Land Geography, 2025 , 48(3) : 434 -443 . DOI: 10.12118/j.issn.1000-6060.2024.241
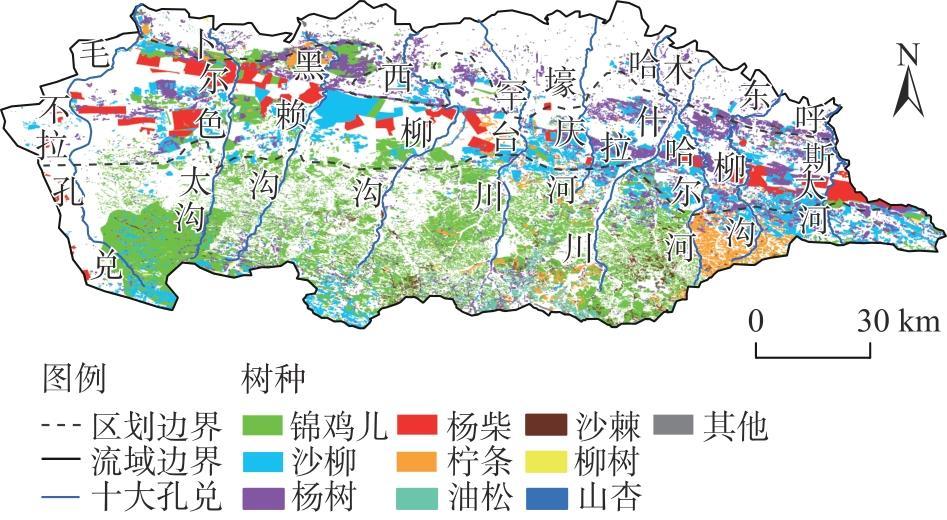
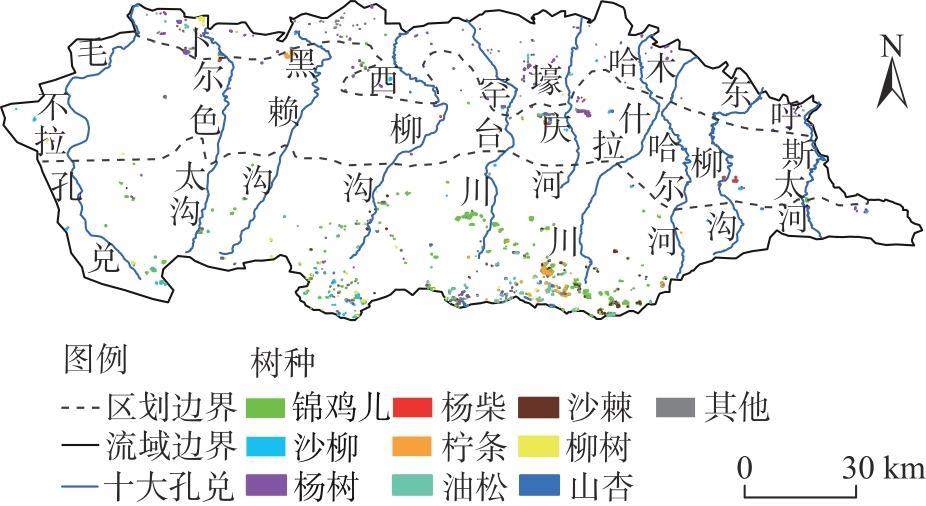
鄂尔多斯高原十大孔兑风水两相侵蚀活跃,上游沟壑纵横交错,中游沙漠东西贯通,是黄河内蒙古河段泥沙淤积的主要来源。为了减少黄河的来沙量,近20多年来,该区中上游区域借助人工绿化手段种植了大面积的植被。尽管十大孔兑的生态环境得到改善,输沙量减少,但是由于林草化的快速扩展,加之不合理的种植和有限的水资源,导致许多重点人工林出现成片衰退的现象[1]。大尺度植被分布受水热条件限制[2-4],而小尺度植被分布受地形条件限制[5-7],不同坡度、坡向很大程度会影响土壤的水热、养分分配,对植被的影响不容忽视[8-11]。彭小平等[12]对黄土高原六道沟流域不同坡位上的旱柳的研究表明,坡地旱柳易出现“小老树”的现象。Fu等[6]在黄土高原纸坊沟流域研究表明,植被生长受坡度的影响大,平地和缓坡适宜种植农作物,而陡坡适宜种植乔木、灌木以及草本植物。王艳兵等[13]、王云霓等[14]对黄土高原六盘山的华北落叶松监测表明,坡位差异对植被蒸腾的影响明显,蒸腾又与植被指数密切相关。Pei等[15]对毛乌素沙地乌审旗的沙柳蒸腾监测表明,相同胸径的沙柳平地处的蒸腾要大于坡中和坡顶,造成这种微地形上植被景观差异的主要原因是水热条件和养分状况不同[16-17]
一些学者还通过遥感的手段分析植被分布与海拔、坡度、坡向的关系,多数研究结果表明植被分布与这三者都相关[18-23],但有的是植被分布与坡向和坡度有关[24-25],有的则是与海拔和坡度相关[26-27]。尽管学者对植被与地形之间的关系进行了较多的研究,但得到的结果并不完全一致,并且都是利用大于30 m分辨率的高程数据进行分析。管亚兵等[28]、朱吉生等[29]对不同时期的十大孔兑植被变化特征进行了分析,但其时间并未连续,很难真正反映植被的变化特征,并且也未考虑地形对植被变化的影响,这方面研究在十大孔兑迄今还存在空缺。
因此,本文利用高分辨率的资源三号01星(ZY3-01)卫星高程数据、MODIS归一化植被指数(NDVI)数据,再结合调查的树种数据,研究十大孔兑不同地貌地形与植被覆盖的关系,以便更好地理解十大孔兑中上游区域的植被变化特征,这对进一步了解区域植被恢复现状具有重要的现实意义,也可为区域人工林建设及生态环境保护提供理论指导。

1 数据与方法

1.1 研究区概况

鄂尔多斯高原北部的十大孔兑(39°50′~40°30′N,108°45′~110°55′E)是黄河内蒙古河段由南向北横穿库布齐沙漠、流经下游冲积平原后汇入黄河的季节性河流,从西往东依次为毛不拉孔兑、卜尔色太沟、黑赖沟、西柳沟、罕台川、壕庆河、哈什拉川、木哈尔河、东柳沟以及呼斯太河,流域总面积为10767 km2,东西长193 km,南北宽86 km,南高北低、西高东低,海拔在888~1627 m之间。该流域由南向北分布有3种典型的地貌类型,上游为丘陵沟壑区,以水力侵蚀为主,水土流失严重;中游为风沙区,库布齐沙漠横穿东西,风力侵蚀严重;下游为冲积扇平原区,多耕地,人类活动最为密集[30]。该流域属于典型温带大陆性季风气候,风天一般集中在3—5月,年平均大风日数24 d,风速17 m·s-1;年均气温6~9 ℃,区内蒸发强烈,约为降水量的7倍;年降水量200~350 mm,由东南向西北减少,常以暴雨形式出现,一般集中在7—9月,约占全年降水的70%。研究区植被类型从东南部的典型草原逐渐向西北部的荒漠草原、草原化荒漠过渡[31],主要人工林场的乔木、灌木、草地比例为1:6:3(图1)。
图1 研究区示意图

Fig. 1 Schematic diagram of the study area

1.2 数据及处理

NDVI数据来自MODIS MOD13Q1级产品,空间分辨率250 m,时间分辨率16 d,时序为2000—2022年。先对MODIS遥感影像进行无效值(NDVI小于0.05)处理,并对缺值区进行插补[32],最后重采样为与高程数据一样的分辨率。高程数据来源于ZY3-01卫星,它具有时效性、现势性强等优点,在无控制点条件下影像平面精度优于10 m,高程精度优于5 m[33],借助ArcGIS Pro空间分析工具对高程数据进行坡度和坡向提取。
坡度影响着地表物质流动和能量转换的规模和强度,对植被的分布起着重要作用[22],通过张棠棣等[34]提出的黄土高原富县土地坡度分级标准以及结合十大孔兑坡度情况,将坡度分级为水平地(0°~1°)、平地(1°~3°)、平缓坡(3°~7°)、缓坡(7°~15°)、陡坡(>15°)5个等级(图2)。利用雷斯越[35]在黄土高原划分坡向的研究,结合十大孔兑地势高低将坡向分为3个等级:按照顺时针方向从0°~360°划分,阴坡为(0°~67.5°,337.5°~360°)、半阴半阳坡为(67.5°~157.5°,247.5°~337.5°)、阳坡为(157.5°~247.5°),其中0°指的是正北方(图3)。
图2 十大孔兑坡度

Fig. 2 Slope of the ten tributaries

图3 十大孔兑坡向

Fig. 3 Slope aspect of the ten tributaries

树种调查数据来自鄂尔多斯林业局最近一次的调查结果(2014年),该数据通过Landsat遥感数据人工目视解译、实地调查等方法获取,包括东胜区、准格尔旗、达拉特旗、杭锦旗4个县级地域共计26种树木数据(图4)。图中只显示了主要树种,其中,锦鸡儿(小叶锦鸡儿和中间锦鸡儿)、沙柳、杨树、杨柴、柠条(柠条锦鸡儿)、油松等占比较大。
图4 十大孔兑树种空间分布

注:锦鸡儿表示小叶锦鸡儿和中间锦鸡儿;柠条表示柠条锦鸡儿。下同。

Fig. 4 Spatial distribution of tree species in the ten tributaries

1.3 研究方法

(1) 利用Theil-Sen中位数趋势分析法逐像元计算NDVI变化率,来反映区域植被变化的趋势,计算公式如下:
$\begin{array}{r} b=\operatorname{Median}\left(\frac{x_{j}-x_{i}}{j-i}\right) \\ \forall j>i, \quad 2000 \leqslant i \leqslant j \leqslant 2022 \end{array}$
式中:b为Theil-Sen中位数,当b>0表示植被向好发展,b<0表示植被退化; x j x i分别为时间序列的第ji年的NDVI。
(2) 采用Mann-Kendall非参数统计检验法对植被变化趋势进行显著性检验,检验统计量S计算公式如下:
S = i = 1 n - 1 j = i + 1 n s g n ( x j - x i )
$\operatorname{sgn}\left(x_{j}-x_{i}\right)=\left\{\begin{array}{ll} +1, & x_{j}-x_{i}>0 \\ 0, & x_{j}-x_{i}=0 \\ -1, & x_{j}-x_{i}<0 \end{array}\right.$
式中:n为时间序列数据的长度(n=23)。
(3) 使用检验统计量Z进行趋势检验,Z值计算公式如下:
$Z=\left\{\begin{array}{ll} \frac{S-1}{\sqrt{\operatorname{Var}(S)}}, & S>0 \\ 0, & S=0 \\ \frac{S+1}{\sqrt{\operatorname{Var}(S)}}, & S<0 \end{array}\right.$
V a r S = n n - 1 2 n + 5 18
式中: V a r S为方差。选定显著性水平为0.05,当Z≥1.96时,表示趋势通过置信度为95%的显著性检验,认为显著变化,当Z<1.96时,则表示不显著。将NDVI变化趋势分为:显著改善(b>0.0005,|Z|≥1.96)、轻微改善(b>0.0005,|Z|<1.96)、基本稳定(-0.0005≤b≤0.0005,Z=0)、轻微退化(b<-0.0005,|Z|<1.96)、显著退化(b<-0.0005,|Z|≥1.96)5个等级[36-39]

2 结果与分析

2.1 十大孔兑植被变化特征

2.1.1 植被的空间变化特征

2000—2022年十大孔兑丘陵区、沙漠区、平原区3种地貌类型的NDVI差异显著,取值范围在0.096~0.883之间,其中丘陵区NDVI在0.122~0.822之间,哈什拉川以东、罕台川、西柳沟上游以及各沟谷区域的植被生长较好,其他区域植被生长较差;沙漠区NDVI在0.103~0.870之间,特别是罕台川以西的中部狭长带状区域,植被长势差且集中,生长较好的区域主要分布在罕台川以东、黑赖沟上游与下游、卜尔色太沟上游区域;平原区植被生长普遍较好,NDVI在0.096~0.883之间(图5)。
图5 2000—2022年十大孔兑NDVI空间变化特征

注:NDVI为归一化植被指数。下同。

Fig. 5 Spatial variation characteristics of NDVI in ten tributaries from 2000 to 2022

通过趋势分析与Mann-Kendall检验发现(图6),十大孔兑植被整体向好发展,但也存在退化比较集中的区域,占整个区域的4.04%。平原农田区植被退化主要分布在黄河沿岸,占此区域的16.28%,十大孔兑下游黄河滩地的主要农作物是小麦和油菜,收割时间分别从7、8月初开始,这是造成黄河沿岸植被退化的主要原因;农田区的中上游主要作物是玉米,收割时间从10月初开始,与树木、草本植物的枯萎时间基本一致;沙漠区退化主要分布在壕庆河下游,占此区域的0.64%;上游丘陵区退化主要分布在西柳沟、罕台川、哈什拉川上游,呈斑块状分布,其他区域也有少许分布,占此区域的1.88%。除黄河沿岸和城镇扩展的区域外,其他区域的植被退化现象面积集中且相对较小,可能是因地形差异导致土壤水分分配不均引起的[40-41]
图6 2000—2022年十大孔兑NDVI变化趋势空间分布

Fig. 6 Spatial distribution of the change trends of NDVI in ten tributaries from 2000 to 2022

图4图6进行叠加分析(图7),得到表1不同建群种的植物生长情况,87.21%的区域林地发生显著改善,除侧柏、杜松、槐树外,其余树种均在显著改善区域中占比高,达到65%以上,有的树种甚至没有退化,如大扁、山桃、丁香、梨、槭树,均为100%显著改善,说明近23 a来十大孔兑重点林业工程选择的树种在该区域生长良好。但是,有的树种出现大面积退化,如桧柏、槐树、侧柏,说明这些树种不适宜在这些林场中种植。还有一些树种在整个区域种植面积大,但出现成片退化的现象,如罕台川和哈什拉川上游的锦鸡儿、油松、柠条、杨树。西柳沟、卜尔色太沟、毛不拉孔兑上游退化的树种主要是锦鸡儿,也有少量沙柳和柳树退化。与上游丘陵区相比,中游沙漠区退化的区域少,主要集中在壕庆河和东柳沟两侧,退化的树种主要有锦鸡儿、杨树、柠条、杨柴、沙柳。下游平原耕地区退化的区域较少,仅有少许的点状分布,因为下游以耕地为主,人工林地相对较小。
图7 十大孔兑退化树种分布

Fig. 7 Distribution of degraded tree species in ten tributaries

表1 2014年不同树种变化趋势的面积占比

Tab. 1 Area proportion of changing trend of different tree species in 2014 /%

树种 显著改
善区
轻微改
善区
基本稳
定区
轻微退
化区
显著退
化区
锦鸡儿 82.06 16.17 0.54 1.10 0.13
沙柳 95.01 4.28 0.46 0.23 0.02
杨树 90.89 7.89 0.33 0.73 0.17
杨柴 96.43 2.07 1.23 0.25 0.01
柠条 81.63 15.42 1.23 1.60 0.12
油松 83.57 13.04 0.88 2.28 0.23
沙棘 81.27 16.78 0.65 1.18 0.12
柳树 70.71 23.87 1.62 2.71 1.10
山杏 95.58 3.55 0.17 0.70 -
柽柳 82.26 13.97 1.65 2.04 0.09
樟子松 79.71 15.82 1.21 2.78 0.48
榆树 70.27 27.34 0.78 1.49 0.12
云杉 76.12 17.91 0.15 5.60 0.23
91.54 7.65 0.59 0.22 -
海棠 75.34 16.86 0.44 7.37 -
苹果 66.37 33.45 0.14 0.05 -
桧柏 70.27 4.43 6.60 18.70 -
沙枣 97.78 0.13 2.09 - -
槐树 16.96 6.96 14.42 30.71 30.92
杜松 37.77 31.21 31.03 - -
侧柏 35.11 - - 59.44 5.45
大扁 100.00 - - - -
山桃 100.00 - - - -
丁香 100.00 - - - -
槭树 100.00 - - - -
100.00 - - - -

注:锦鸡儿表示小叶锦鸡儿和中间锦鸡儿;柠条表示柠条锦鸡儿;“-”表示树种占比小于0.01%或为0的部分。

2.1.2 不同地貌类型植被的时间变化特征

2000—2022年不同地貌类型NDVI呈波动上升的趋势,特别是2009年以后,3种地貌类型的NDVI波动都较大。平原区、丘陵区、沙漠区NDVI多年平均分别为0.591、0.337、0.325,依次减小,但平原区NDVI增加趋势平缓,丘陵区次之,沙漠区增加最明显。除地形因素外,在相同的气候条件下,平原区NDVI较大可能受耕地面积、耕作物种的影响较大,而丘陵区和沙漠区受人为植草种树和土壤水分胁迫影响较大。
在2016年之前,除2011年和2015年外,丘陵区的NDVI大于沙漠区,但在2016年以后完全相反,说明丘陵区水土流失造成植被退化的情况可能还存在。3种地貌类型的NDVI在2003—2005、2010—2011、2013—2014年和2020—2021年4个时段有差异,在其他时段NDVI变化特征一致,而且2003—2005年平原区与沙漠区、2010—2011年沙漠区与丘陵区、2013—2014年平原区与沙漠区、2020—2021年平原区与丘陵区都是两两一致(图8),不一致的原因可能是气候变化和人类活动影响造成的[32]
图 8 不同地貌NDVI的年变化趋势

Fig. 8 Annual change trend of NDVI for different landforms

3种地貌类型的多年平均NDVI从4月开始增长,8月达到最大,随即开始下降,直至11月基本相等,说明研究区多数植物的生长季在4—10月之间(图9)。平原区生长季的NDVI变化趋势大于沙漠区和丘陵区,特别是7—9月,说明这个时间段是作物生长的高峰期,但非生长季与其他2个区域的NDVI差异不大。沙漠区与丘陵区的NDVI在整个时段变化趋势相似,仅存在微小差别,整体上是丘陵区的NDVI略大于沙漠区,但在7—9月沙漠区的NDVI略大于丘陵区,这可能是2个区域的地形地貌差异所致。
图 9 不同地貌NDVI的逐月变化趋势

Fig. 9 Monthly change trend of NDVI for different landforms

2.2 不同地形地貌条件下植被变化特征

2.2.1 植被与坡度的关系

2000—2022年3种地貌类型不同坡度条件下的NDVI变化趋势基本一致(图10),但2011年之前,平原区与其他2个地貌类型存在差异。平原区的平缓坡和缓坡的植被生长整体上要好于水平地和平地,可能是前者的植被类型主要是草地和林地,而后者的植被类型主要是小麦和玉米,农作物收割一定程度会影响植被的变化特征。陡坡的植被生长相比其他坡度最差,特别是2005年以后,可能陡坡植被长大受土壤水分胁迫和人为因素干扰造成植被退化。
图10 不同地貌不同坡度的NDVI变化特征

Fig. 10 Characteristics of NDVI change at different slopes and different landforms

沙漠区不同坡度的NDVI变化趋势保持较好的一致性,特别是2011年之前,植被生长都是水平地>平地>平缓坡>缓坡>陡坡,这是因为沙地土壤质地均一,土壤持水性较差,土壤含量水随坡度增加而减小,植被也会随坡度增加造成长势变差。在这之后,陡坡植被生长在个别年份要好于平缓坡和缓坡,但仍比水平地和平地差。出现这种现象的原因可能是2011年之前,这一区域的树木较小,陡坡的土壤水分可以满足植物的生长需求,之后由于土壤水分胁迫,植物出现衰退现象,后期又经过人为补种,使得2011年之后出现陡坡植被生长在个别年份要好于平缓坡和缓坡,但其他坡度仍是水平地>平地>平缓坡>缓坡,说明沙漠人工植被生长和坡度存在明显的负相关。以新月形沙丘为主的库布齐沙漠,迎风坡缓,背风坡较陡[42],迎风坡植被的种植密度不宜过大,背风坡下的平地应种植较多的植被。
同样,丘陵区不同坡度的NDVI变化趋势几乎与沙漠区完全一致,并且也存在水平地>平地>平缓坡>缓坡,但陡坡植物的生长在整个时间段都好于平缓坡和缓坡,但差于水平地和平地。这与沙漠区的陡坡存在较大差异,可能是因为丘陵沟壑区上游修建淤地坝减少了水分和养分的流失,植被生长也相应变好[43]

2.2.2 植被与坡向的关系

2000—2022年3种地貌类型不同坡向条件下的NDVI变化趋势基本一致(图11),但在2004年和2011年丘陵区的NDVI变化趋势与其他2个地貌类型存在一些差异,可能是丘陵区的坡度比其他2个地貌类型坡度大造成的。在2011年平原区与其他2个地貌类型也存在一些差异,可能是这一区域人类活动影响比其他2个地貌类型更强造成的。
图11 不同地貌不同坡向的NDVI变化特征

Fig. 11 Characteristics of NDVI change at different slope aspects and different landforms

平原区的NDVI变化趋势都是阳坡>半阴半阳坡>阴坡,可能是植被受土壤水分胁迫的影响相对较小,主要以热量为主,植被更适宜在阳坡种植;沙漠区的NDVI变化趋势基本都是阴坡>阳坡>半阴半阳坡,仅在2001、2008、2011、2021年阴坡<阳坡,但差异小于0.005,仍是阴坡>半阴半阳坡;丘陵区的NDVI变化趋势基本都是阴坡>半阴半阳坡>阳坡,仅在2021年和2022年表现为阴坡<半阴半阳坡,但差异小于0.004,仍是阴坡>阳坡。因此,在平原区,阳坡种植植被长势更好,成活率更高;相反,沙漠区和丘陵区更适宜在坡度较小的阴坡种植较多植被,可减少植被恢复过程中出现的“老小树”和植被退化现象。

3 结论

(1) 十大孔兑植被整体向好发展,但也存在退化比较集中的区域,占整个区域的4.04%。平原农田区植被退化主要分布在黄河沿岸,占此区域的16.28%;中游退化的区域主要分布在壕庆河下游,占此区域的0.64%;上游丘陵区退化主要分布在西柳沟、罕台川、哈什拉川上游,呈斑块状分布,占此区域的1.88%。
(2) 87.21%的人工林地发生显著改善,除侧柏、杜松、槐树外,其余树种均在显著改善区域中占比高,达到65%以上。罕台川和哈什拉川上游的锦鸡儿、油松、柠条、杨树退化较集中,西柳沟、卜尔色太沟、毛不拉孔兑上游退化的树种同样是锦鸡儿,也有少量沙柳和柳树。中游沙漠区退化主要集中在壕庆河和东柳沟两侧,退化的树种主要有锦鸡儿、杨树、柠条、杨柴、沙柳。下游平原耕地区树种退化的区域较少,仅有少许的点状分布。
(3) 整体上不同地貌类型NDVI呈波动上升的趋势,特别是2009年以后,3种地貌类型的植被波动都较大。平原区、丘陵区、沙漠区NDVI多年平均分别为0.591、0.337、0.325,依次减小,但平原区NDVI增加趋势平缓,丘陵区次之,沙漠区增加最明显,3种地貌类型的NDVI都是8月达到最大。
(4) 不同坡度条件下的植被变化趋势基本一致,平原区的平缓坡和缓坡的NDVI变化趋势整体要好于水平地和平地,沙漠区的NDVI变化趋势都是水平地>平地>平缓坡>缓坡>陡坡,丘陵区的NDVI变化趋势几乎与沙漠区完全一致,但陡坡NDVI在整个时间段都好于平缓坡和缓坡,但差于水平地和平地。因此,应在沙漠区和丘陵区的水平地与平地种植较多的植被。
(5) 不同坡向条件下的植被变化趋势基本一致,平原区整个时段的NDVI变化趋势都是阳坡>半阴半阳坡>阴坡,沙漠区整个时段的NDVI变化趋势基本都是阴坡>阳坡>半阴半阳坡,仅在2001、2008、2011、2021年阴坡<阳坡,但差异小于0.005,仍是阴坡>半阴半阳坡,丘陵区的NDVI变化趋势基本都是阴坡>半阴半阳坡>阳坡,仅在2021年和2022年是阴坡<半阴半阳坡,但差异小于0.004,仍是阴坡>阳坡。因此,沙漠区和丘陵区应在坡度较小的阴坡种植较多的植被。

感谢中国科学院西北生态环境资源研究院贾晓鹏老师在研究中给予的建议和帮助!

[1]
马启民, 李永山, 王海兵, 等. 鄂尔多斯沙地人工柠条林能量平衡与蒸散研究[J]. 高原气象, 2022, 41(6): 1511-1521.

DOI

[Ma Qimin, Li Yongshan, Wang Haibing, et al. Study on energy balance and evapotranspiration of an artificial Caragana korshinskii shrub land in Ordos Plateau[J]. Plateau Meteorology, 2022, 41(6): 1511-1521. ]

DOI

[2]
Cramer W, Bondeau A, Woodward F I, et al. Global response of terrestrial ecosystem structure and function to CO2 and climate change: Results from six dynamic global vegetation models[J]. Global Change Biology, 2001, 7(4): 357-373.

[3]
Theurillat J P, Guisan A. Potential impact of climate change on vegetation in the European Alps: A review[J]. Climatic Change, 2001, 50(2): 77-109.

[4]
庞冉, 王文. 基于MODIS数据的吐鲁番盆地2001—2017年植被变化及水热组合影响分析[J]. 干旱区地理, 2020, 43(5): 1242-1252.

[Pang Ran, Wang Wen. Analysis of vegetation index changes and the influence of hydrothermal combination in the Turpan Basin from 2001 to 2017 based on MODIS data[J]. Arid Land Geography, 2020, 43(5): 1242-1252. ]

DOI

[5]
Brown D G. Comparison of vegetation-topography relationships at the alpine treeline ecotone[J]. Physical Geography, 1994, 15(2): 125-145.

[6]
Fu B J, Zhang Q J, Chen L D. Temporal change in land use and its relationship to slope degree and soil type in a small catchment on the Loess Plateau of China[J]. Catena, 2006, 65(1): 41-48.

[7]
Zhang B Q, Wu P T, Zhao X N, et al. Changes in vegetation condition in areas with different gradients (1980—2010) on the Loess Plateau, China[J]. Environmental Earth Sciences, 2013, 68(8): 2427-2438.

[8]
Ostendorf B, Reynolds J F. A model of Arctic tundra vegetation derived from topographic gradients[J]. Landscape Ecology, 1998, 13(3): 187-201.

[9]
Batdelger G, Masahide I, Yasunori K, et al. Topographical and hydrological effects on meso-scale vegetation in desert steppe, Mongolia[J]. Journal of Arid Land, 2017, 9(1): 132-142.

DOI

[10]
Ahmed L, Osvaldo V, Yves B, et al. Effects of topography and thickness of organic layer on productivity of black spruce boreal forests of the Canadian clay belt region[J]. Forest Ecology and Management, 2014, 330: 144-157.

[11]
贺军奇, 拜寒伟, 徐轶玮, 等. 陕西黄土区农田土壤主要养分特征及影响因素[J]. 干旱区研究, 2023, 40(12): 1907-1917.

DOI

[He Junqi, Bai Hanwei, Xu Yiwei, et al. Main nutrient characteristics and influencing factors of farmland soil in the Loess Plateau of the Shaanxi Province[J]. Arid Zone Research, 2023, 40(12): 1907-1917. ]

DOI

[12]
彭小平, 樊军, 米美霞, 等. 黄土高原水蚀风蚀交错区不同立地条件下旱柳树干液流差异[J]. 林业科学, 2013, 49(9): 38-45.

[Peng Xiaoping, Fan Jun, Mi Meixia, et al. Sapflow dynamic changes of Salix matsudana in the water-wind erosion crisscross region on the Loess Plateau[J]. Scientia Silvae Sinicae, 2013, 49(9): 38-45. ]

[13]
王艳兵, 王彦辉, 熊伟, 等. 六盘山半干旱区华北落叶松树干液流速率及主要影响因子的坡位差异[J]. 林业科学, 2017, 53(6): 10-20.

[Wang Yanbing, Wang Yanhui, Xiong Wei, et al. Variation in the sapflow velocity of Larix principis-rupprechtii and its impact factors in different slope positions in a semi-arid region of Liupan Mountains[J]. Scientia Silvae Sinicae, 2017, 53(6): 10-20. ]

[14]
王云霓, 曹恭祥, 王彦辉, 等. 六盘山南侧不同坡位华北落叶松人工林树干液流特征及其环境影响因子[J]. 生态学杂志, 2018, 37(7): 1932-1942.

[Wang Yunni, Cao Gongxiang, Wang Yanhui, et al. Sap flow characteristics of Larix principis-rupprechtii plantation and its impact factors in different slope locations at the south side of Liupan Mountains[J]. Chinese Journal of Ecology, 2018, 37(7): 1932-1942. ]

[15]
Pei Z Y, Hao S R, Pang G H, et al. Sap flow of Salix psammophila and its principal influencing factors at different slope positions in the Mu Us Desert[J]. PLoS ONE, 2019, 14(12): e0225653, doi: 10.1371/journal.pone.0225653.

[16]
汝海丽, 张海东, 焦峰, 等. 黄土丘陵区微地形条件下草本群落特征与土壤水分及养分关系分析[J]. 草地学报, 2016, 24(4): 776-782.

DOI

[Ru Haili, Zhang Haidong, Jiao Feng, et al. Relation analysis of herbaceous community characteristics and soil moisture and nutrients on micro-scale topography typical section in hilly Loess Plateau region, China[J]. Acta Agrestia Sinica, 2016, 24(4): 776-782. ]

DOI

[17]
黄平, 李廷轩, 张佳宝, 等. 坡度和坡向对低山茶园土壤有机质空间变异的影响[J]. 土壤, 2009, 41(2): 264-268.

[Huang Ping, Li Tingxuan, Zhang Jiabao, et al. Effects of slope’s gradient and aspect on spatial heterogeneity of soil organic matter in low mountainous region[J]. Soils, 2009, 41(2): 264-268. ]

[18]
Deng Y X, Chen X F, Chuvieco E, et al. Multi-scale linkages between topographic attributes and vegetation indices in a mountainous landscape[J]. Remote Sensing of Environment, 2007, 111(1): 122-134.

[19]
Zhou Q W, Wei X C, Zhou X, et al. Vegetation coverage change and its response to topography in a typical karst region: The Lianjiang River Basin in southwest China[J]. Environmental Earth Sciences, 2019, 78(6): 191, doi: 10.1007/s12665-019-8218-z.

[20]
汤巧英, 戚德辉, 宋立旺, 等. 基于GIS和RS的延河流域植被覆盖度与地形因子的相关性研究[J]. 水土保持研究, 2017, 24(4): 198-203.

[Tang Qiaoying, Qi Dehui, Song Liwang, et al. Correlation of vegetation coverage and topographic factors in Yanhe River Basin based on GIS and RS[J]. Research of Soil and Water Conservation, 2017, 24(4): 198-203. ]

[21]
龙映豪, 李旭东, 程东亚. 山区植被覆盖度变化的地形分异特征——以贵州开阳县为例[J]. 水土保持研究, 2022, 29(5): 268-275.

[Long Yinghao, Li Xudong, Cheng Dongya. Topographic differentiation of vegetation coverage changes between shaded slopes and sunny slopes in mountainous areas: A case of Kaiyang County, Guizhou Province[J]. Research of Soil and Water Conservation, 2022, 29(5): 268-275. ]

[22]
赵文慧, 陈妮, 闫瑞, 等. 近20年来北洛河流域植被覆盖度随地形因子变化特征探究[J]. 水土保持研究, 2016, 23(4): 10-14.

[Zhao Wenhui, Chen Ni, Yan Rui, et al. Study on variation of the vegetation coverage based on terrain factors in the Beiluo River Basin in the past 20 years[J]. Research of Soil and Water Conservation, 2016, 23(4): 10-14. ]

[23]
夏天, 蓝海浪, 刘秀丽. 北京市植被覆盖对地形和土地利用的响应[J]. 草业科学, 2023, 40(7): 1742-1753.

[Xia Tian, Lan Hailang, Liu Xiuli. The response of vegetation cover to topography and land use in Beijing[J]. Pratacultural Science, 2023, 40(7): 1742-1753. ]

[24]
He J, Shi X Y, Fu Y J. Identifying vegetation restoration effectiveness and driving factors on different micro-topographic types of hilly Loess Plateau: From the perspective of ecological resilience[J]. Journal of Environmental Management, 2021, 289: 112562, doi: 10.1016/j.jenvman.2021.112562.

[25]
Wang C Y, Wang J N, Naudiyal N, et al. Multiple effects of topographic factors on spatio-temporal variations of vegetation patterns in the three parallel rivers region, southeast Qinghai-Tibet Plateau[J]. Remote Sensing, 2021, 14(1): 151, doi: 10.3390/rs14010151.

[26]
Emran A, Roy S, Bagmar S H, et al. Assessing topographic controls on vegetation characteristics in Chittagong Hill Tracts (CHT) from remotely sensed data[J]. Remote Sensing Applications: Society and Environment, 2018, 11: 198-208.

[27]
Li Q, Shi X Y, Wu Q G. Exploring suitable topographical factor conditions for vegetation growth in Wanhuigou catchment on the Loess Plateau, China: A new perspective for ecological protection and restoration[J]. Ecological Engineering, 2020, 158: 106053, doi: 10.1016/j.ecoleng.2020.106053.

[28]
管亚兵, 杨胜天, 周旭, 等. 黄河十大孔兑流域林草植被覆盖度的遥感估算及其动态研究[J]. 北京师范大学学报, 2016, 52(4): 458-465.

[Guan Yabing, Yang Shengtian, Zhou Xu, et al. Study on shrubs-herbs-arbor vegetation coverage and dynamic changes in the ten tributaries of Yellow River in Inner Mongolia by remote sensing method[J]. Journal of Beijing Normal University (Natural Science Edition), 2016, 52(4): 458-465. ]

[29]
朱吉生, 李纪人, 黄诗峰, 等. 近30年十大孔兑流域植被覆盖度空间变化的遥感调查与分析[J]. 中国水土保持, 2015(7): 68-70.

[Zhu Jisheng, Li Jiren, Huang Shifeng, et al. Remote sensing survey and analysis of spatial changes in vegetation cover in the ten Kongdui basins in the last 30 years[J]. Soil and Water Conservation in China, 2015(7): 68-70. ]

[30]
顾畛逵, 师长兴, 阳辉, 等. 内蒙古十大孔兑流域地貌演化格局及其成因机制[J]. 干旱区地理, 2017, 40(6): 1188-1197.

[Gu Zhenkui, Shi Changxing, Yang Hui, et al. Landform evolution pattern of the ten Kongdui basins and its genetic mechanisms in Inner Mongolia of China[J]. Arid Land Geography, 2017, 40(6): 1188-1197. ]

[31]
曾令建, 杨振奇, 秦富仓, 等. 内蒙古十大孔兑区土地利用类型变化与生态环境效应[J]. 水土保持通报, 2023, 43(1): 214-223.

[Zeng Lingjian, Yang Zhenqi, Qin Fucang, et al. Changes in land use type and ecological environment effect at ten tributaries in Inner Mongolia[J]. Bulletin of Soil and Water Conservation, 2023, 43(1): 214-223. ]

[32]
Ma Q M, Long Y P, Jia X P, et al. Vegetation response to climatic variation and human activities on the Ordos Plateau from 2000 to 2016[J]. Environmental Earth Sciences, 2019, 78(24): 709, doi:10.1007/s12665-019-8732-z.

[33]
唐新明, 王鸿燕, 祝小勇. 资源三号卫星测绘技术与应用[J]. 测绘学报, 2017, 46(10): 1482-1491.

DOI

[Tang Xinming, Wang Hongyan, Zhu Xiaoyong. Technology and applications of surveying and mapping for ZY-3 satellites[J]. Acta Geodaetica et Cartographica Sinica, 2017, 46(10): 1482-1491. ]

DOI

[34]
张棠棣, 张建奎, 王润文. 富县土地坡度分级与制图[J]. 水土保持通报, 1984(5): 34-37.

[Zhang Tangdi, Zhang Jiankui, Wang Runwen. Land slope classification and mapping in Fu County[J]. Bulletin of Soil and Water Conservation, 1984(5): 34-37. ]

[35]
雷斯越. 不同地形条件下退耕草地植被恢复与土壤理化性质分异特征[D]. 咸阳: 西北农林科技大学, 2019.

[Lei Siyue. Vegetation restoration with soil physical and chemical properties’ distribution characteristics of converted grassland in different topographic conditions[D]. Xianyang: Northwest A & F University, 2019. ]

[36]
牟乐, 芦奕晓, 杨惠敏, 等. 1981—2015年中国西北牧区植被覆盖的时空变化[J]. 干旱区研究, 2018, 35(3): 615-623.

DOI

[Mou Le, Lu Yixiao, Yang Huimin, et al. Spatiotemporal variation of vegetation cover in the pastoral area in northwestern China during the period of 1981—2015[J]. Arid Zone Research, 2018, 35(3): 615-623. ]

[37]
马小梅, 杜秉晨曦, 程勇翔, 等. 准噶尔盆地植被变化趋势及相关因素分析[J]. 干旱区研究, 2021, 38(5): 1401-1410.

DOI

[Ma Xiaomei, Du Bingchenxi, Cheng Yongxiang, et al. Analysis of vegetation variation trend and correlative factors in Junggar Basin[J]. Arid Zone Research, 2021, 38(5): 1401-1410. ]

DOI

[38]
孙天瑶, 李雪梅, 许民, 等. 2000—2018年塔里木河流域植被覆盖时空格局[J]. 干旱区地理, 2020, 43(2): 415-424.

[Sun Tianyao, Li Xuemei, Xu Min, et al. Spatial-temporal variations of vegetation coverage in the Tarim River Basin from 2000 to 2018[J]. Arid Land Geography, 2020, 43(2): 415-424. ]

[39]
李雅倩, 杨建华, 夏皓斌, 等. 2000—2022年伊犁河流域植被时空变化特征[J]. 干旱区地理, 2024, 47(5): 741-752.

DOI

[Li Yaqian, Yang Jianhua, Xia Haobin, et al. Spatiotemporal variations of vegetation in the Ili River Basin from 2000 to 2022[J]. Arid Land Geography, 2024, 47(5): 741-752. ]

DOI

[40]
孙琰蕙, 张定海, 张志山. 腾格里沙漠不同类型沙丘土壤水分含量与地形-植被因子关系研究[J]. 干旱区地理, 2022, 45(5): 1570-1578.

DOI

[Sun Yanhui, Zhang Dinghai, Zhang Zhishan. Relationship between soil moisture content and topography-vegetation factors in different types of dunes in the Tengger Desert[J]. Arid Land Geography, 2022, 45(5): 1570-1578. ]

DOI

[41]
成龙, 吴波, 贾晓红, 等. 基于连续观测数据的毛乌素沙地生长季土壤水分动态及其对降雨的响应[J]. 干旱区地理, 2024, 47(4): 648-661.

DOI

[Cheng Long, Wu Bo, Jia Xiaohong, et al. Dynamic change of soil moisture and its response to rainfall during the growing season in Mu Us Sandy Land based on continuous observation data[J]. Arid Land Geography, 2024, 47(4): 648-661. ]

DOI

[42]
常兆丰, 李亚, 张剑挥, 等. 新月形沙丘稳定性机理——以甘肃河西沙区为例[J]. 生态学报, 2017, 37(13): 4375-4383.

[Chang Zhaofeng, Li Ya, Zhang Jianhui, et al. Stability mechanisms of barchan sand dunes: A case study in the Hexi Desert in Gansu[J]. Acta Ecologica Sinica, 2017, 37(13): 4375-4383. ]

[43]
刘殿君, 于森淼, 孟庆东, 等. 黄河流域鄂尔多斯十大孔兑淤地坝减沙效应[J]. 水土保持研究, 2023, 30(2): 42-49.

[Liu Dianjun, Yu Senmiao, Meng Qingdong, et al. Effect of check dams on sediment retention of the ten tributaries in the Ordos Basin of the Yellow River Basin[J]. Research of Soil and Water Conservation, 2023, 30(2): 42-49. ]

Outlines

/