
Impact of urban expansion on habitat quality in the northern Tianshan Mountain economic zone
Received date: 2025-02-16
Revised date: 2025-04-11
Online published: 2026-03-11
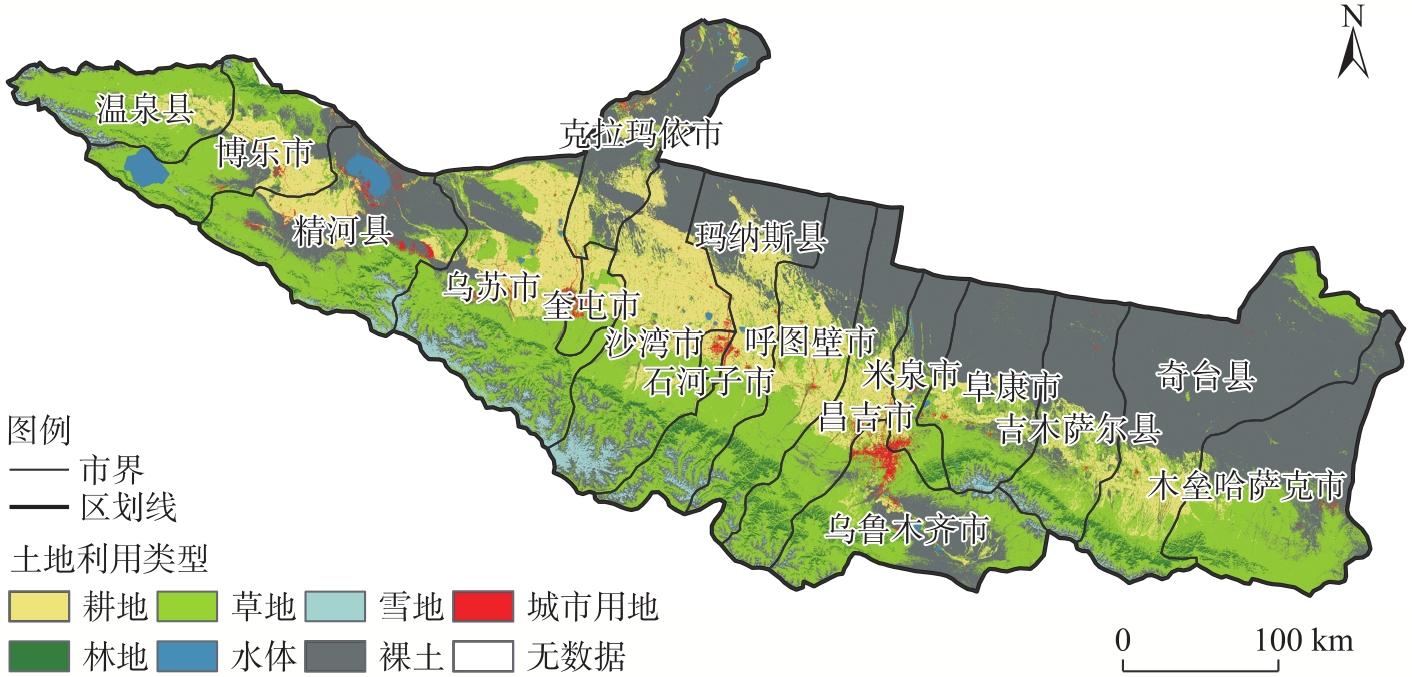
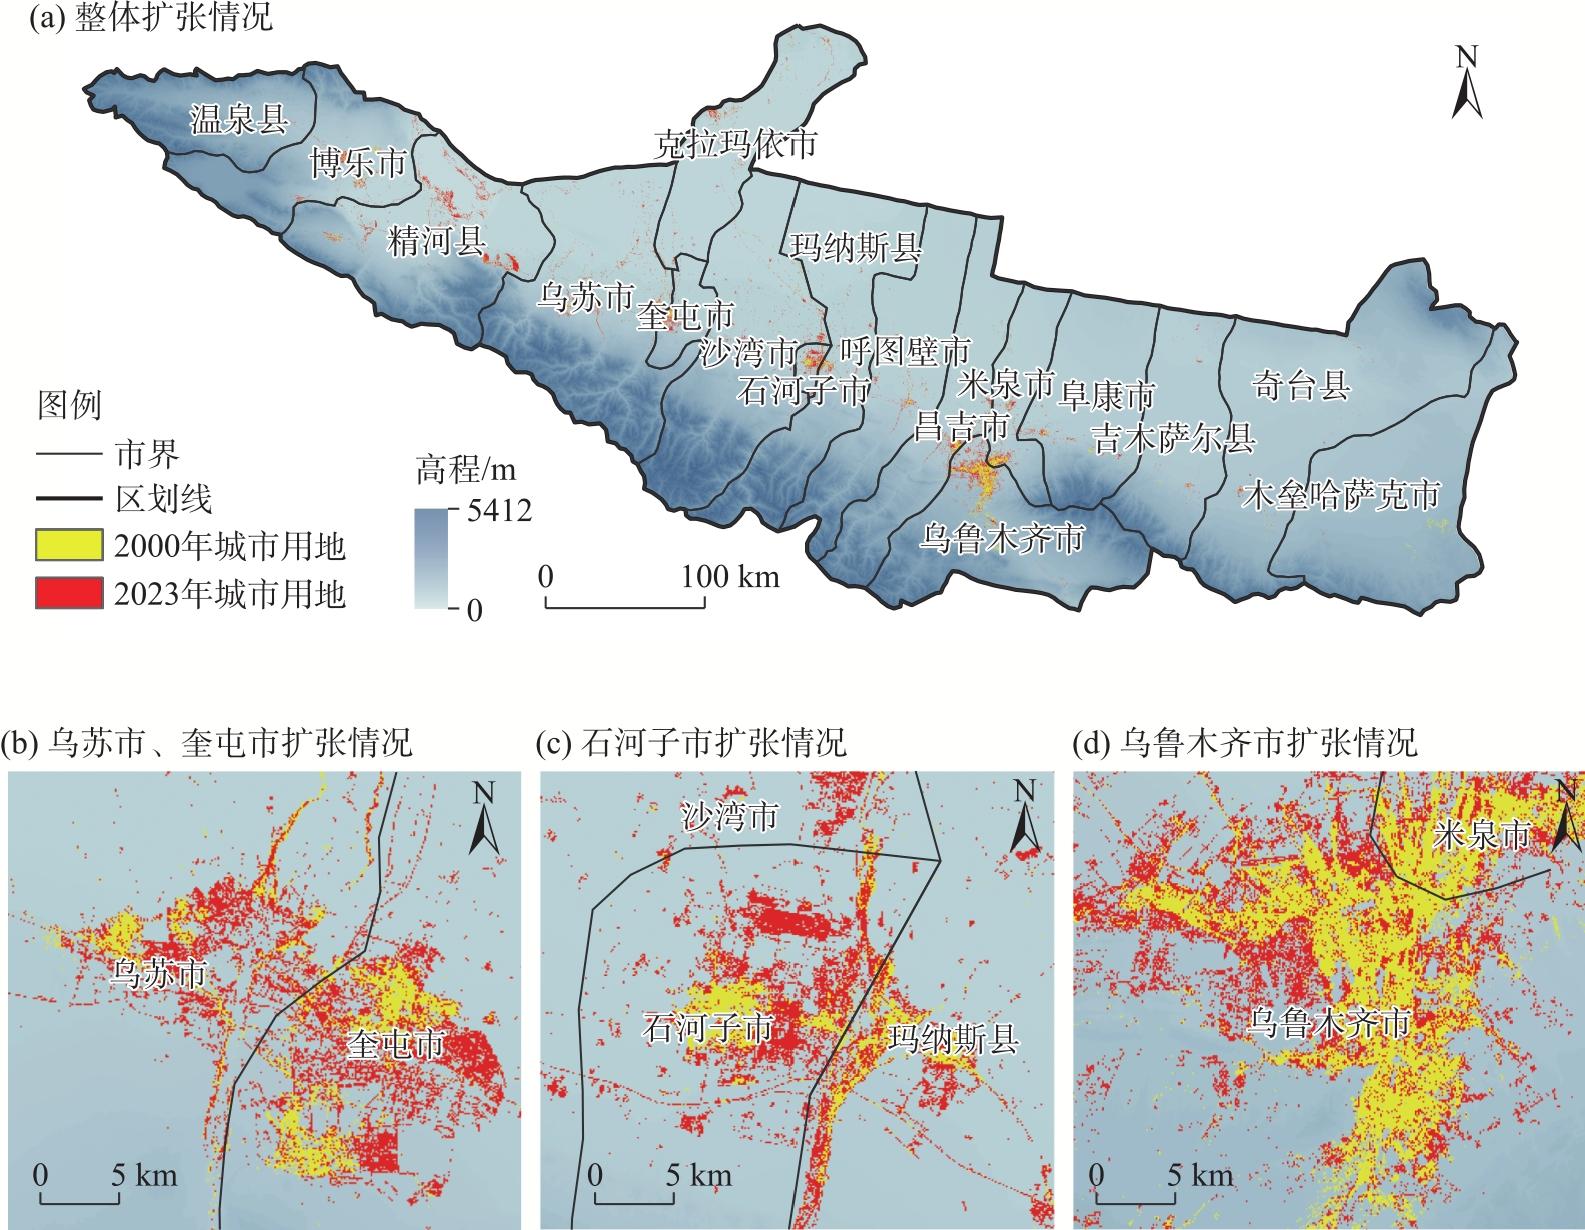
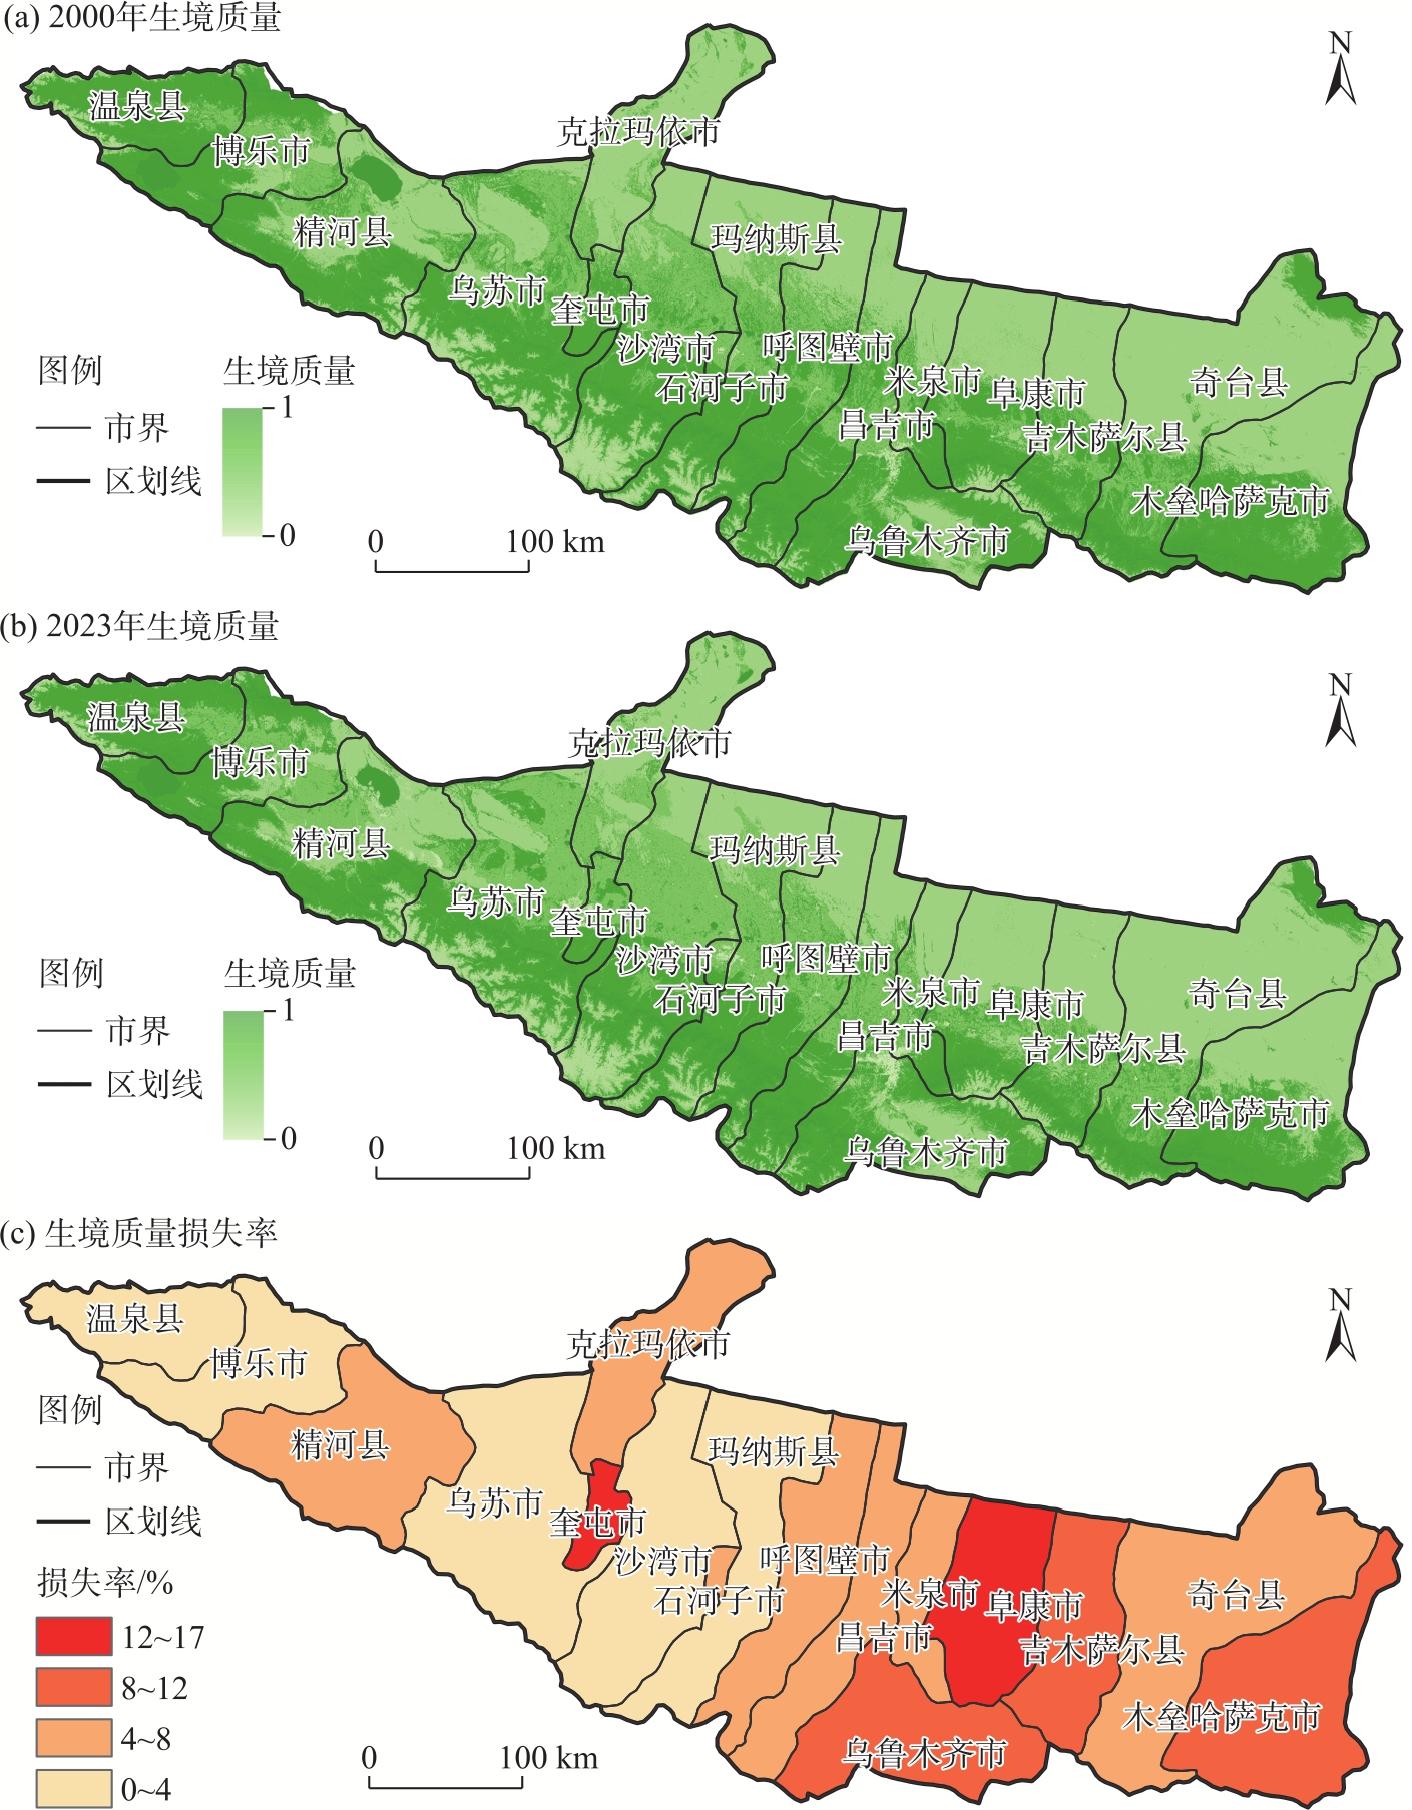
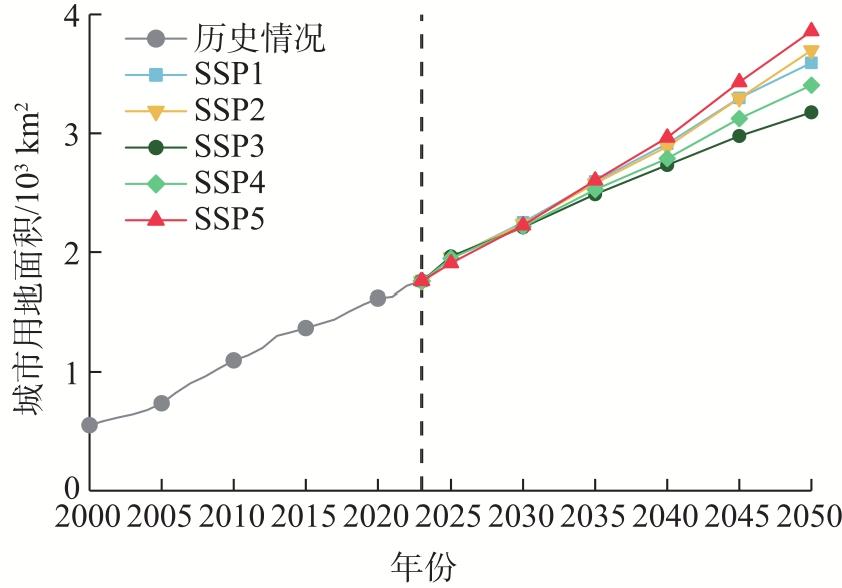
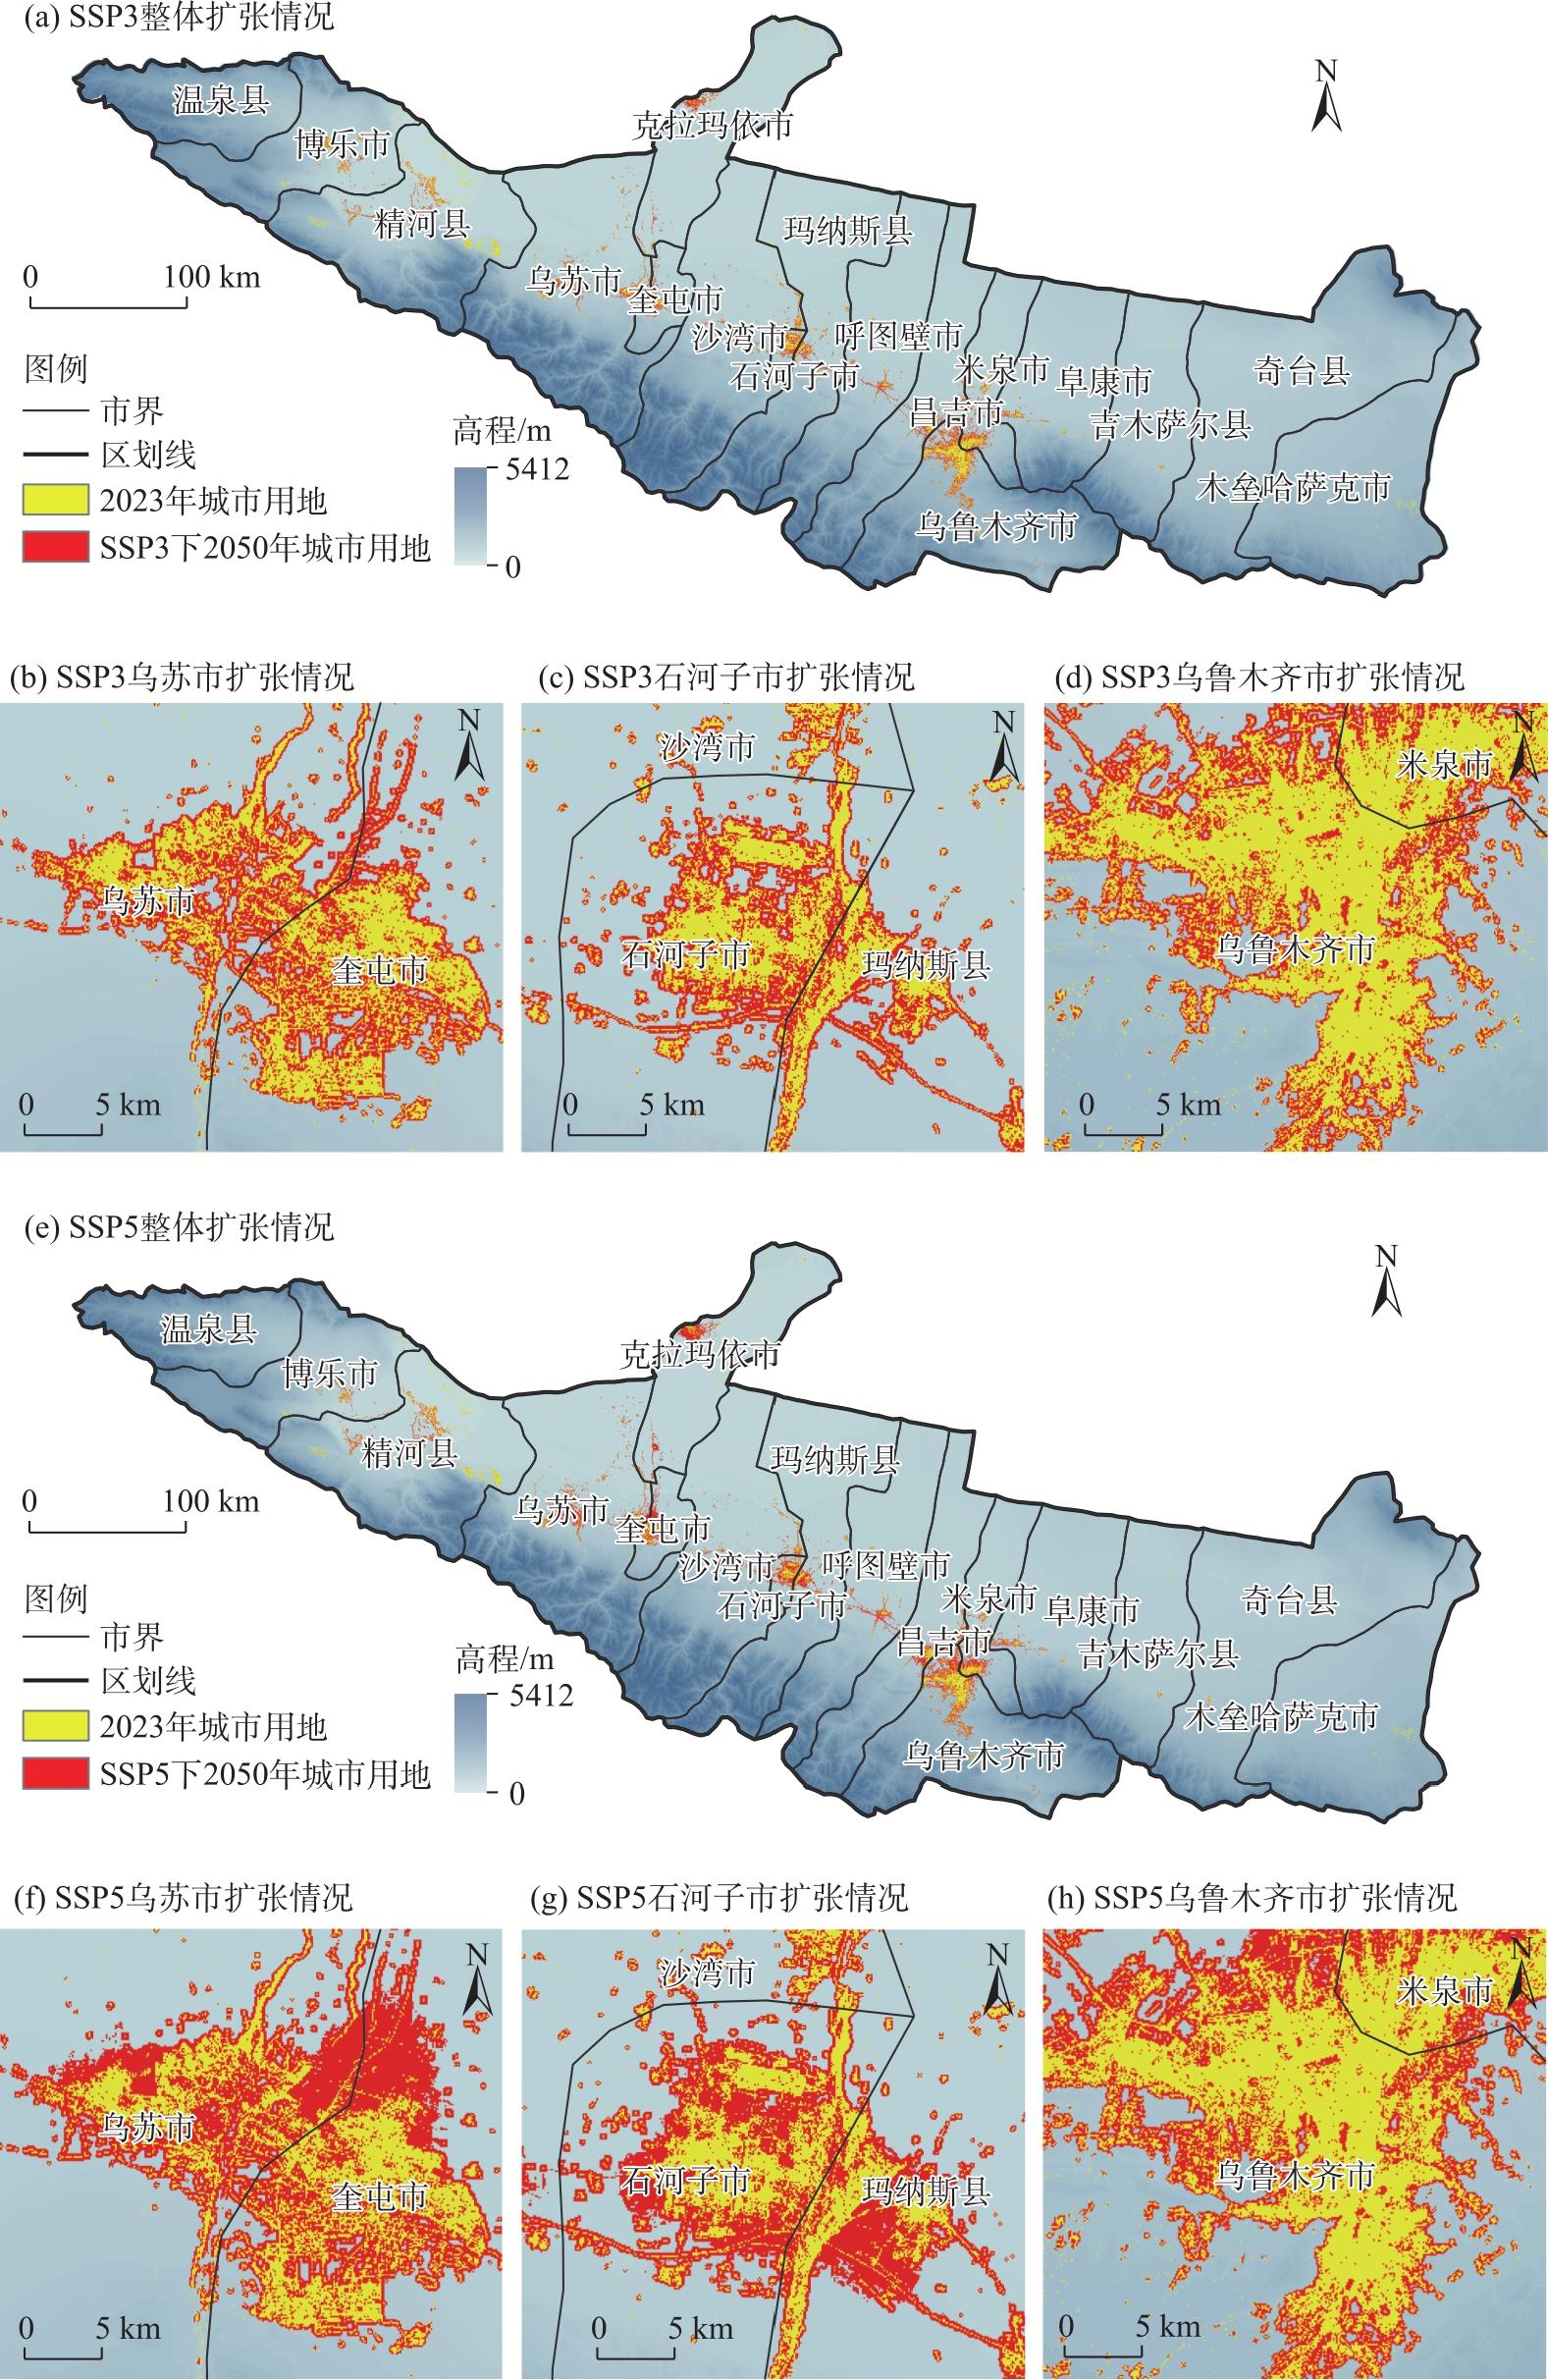
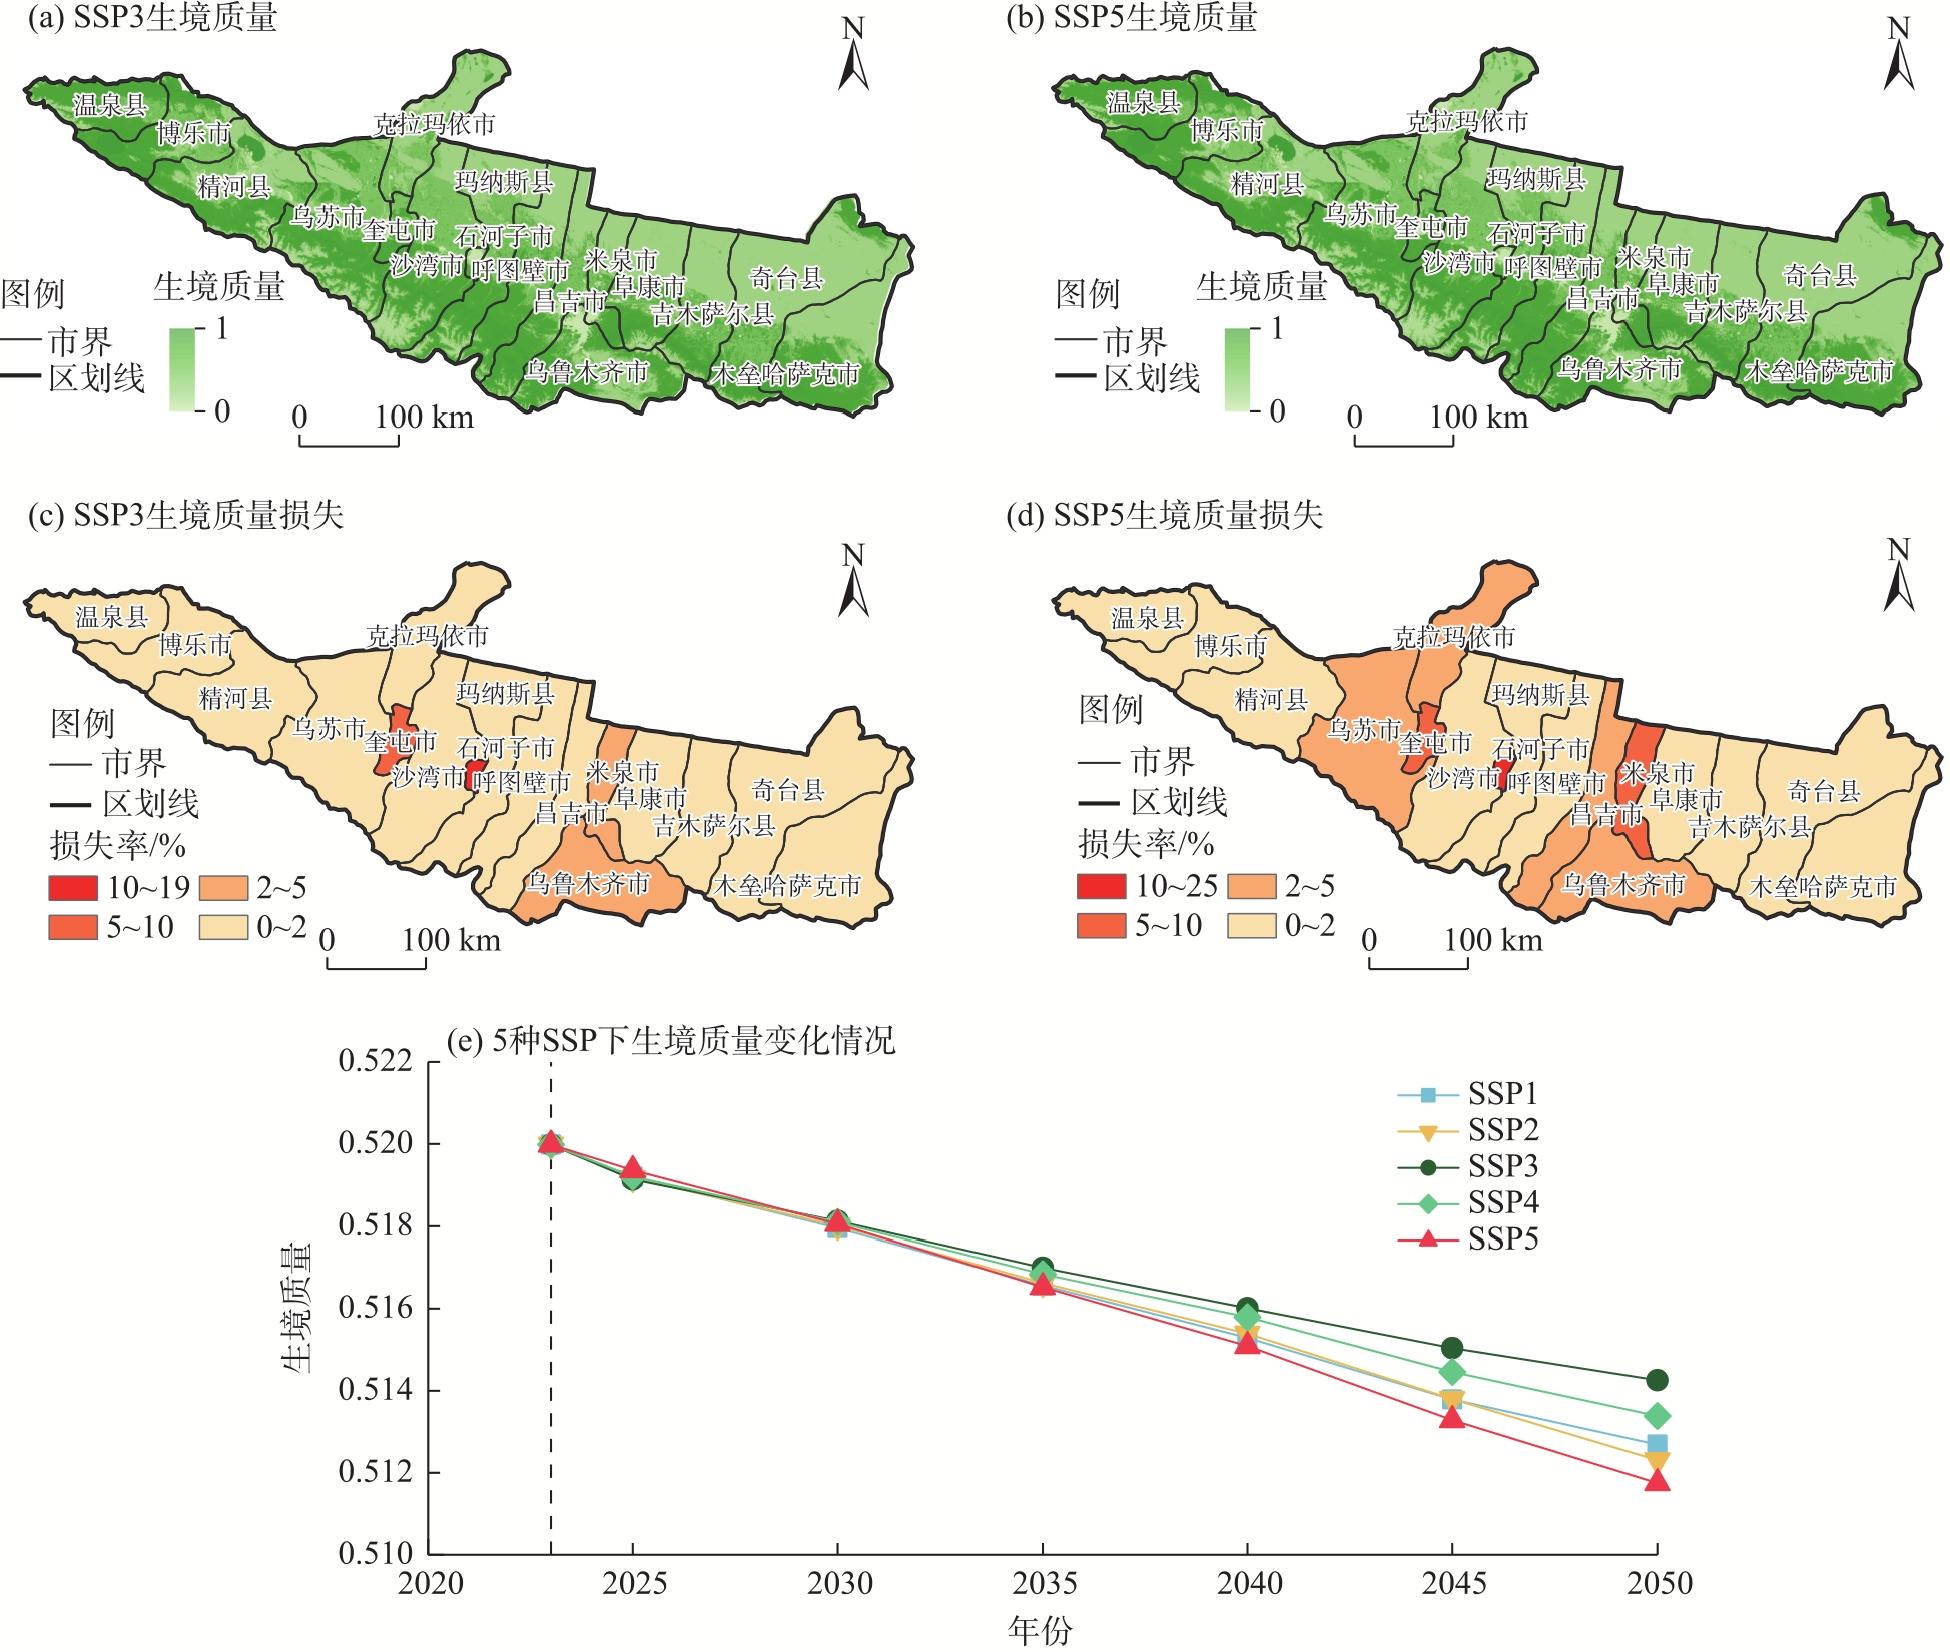
Rapid urbanization and the attendant spatial expansion of urban regions can alter the structure of ecosystems, degrade habitat quality, and thereby impact sustainable development. Investigating the effects of urban expansion on habitat quality is crucial for the rational allocation of land use and supporting the restoration and reconstruction of ecosystems. This study focuses on the northern Tianshan Mountain economic zone (NTMEZ) in Xinjiang, China, where future urban expansion scenarios from 2024 to 2050 under different socioeconomic pathways are predicted using the Land Use Scenario Dynamic-Urban (LUSD-urban) model. The spatiotemporal changes in habitat quality from 2000 to 2050 in the region are also assessed. The results show that: (1) Between 2000 and 2023, urban land in the NTMEZ rapidly expanded from 551.72 km2 to 1756.11 km2, with an annual expansion rate of 54.70 km2. From 2023 to 2050, under the fossil fuel pathway, urban land expansion is expected to be most significant, whereas under the regional competition pathway, expansion is expected to be least pronounced. The area of urban land is expected to further expand to between 3176.27 km2 and 3859.20 km2, with an annual expansion rate ranging from 244.03 km2 to 369.38 km2. (2) From 2000 to 2023, habitat quality in the NTMEZ declined from 0.551 to 0.520, representing a loss rate of 5.574%. From 2023 to 2050, habitat quality is expected to continue to decrease, with an anticipated loss of 0.57×10⁻²‒0.82×10⁻², corresponding to a loss rate of 1.10%~1.58%. (3) The main driver of habitat quality loss is the encroachment of urban land on grasslands. In future urban planning and management, greater emphasis should be placed on the restoration of ecological land in the NTMEZ to ensure the region’s sustainable development.
Yanwen WANG , Huan YANG , Peiyue TU , Hao DING , Ying JING , Chao HE . Impact of urban expansion on habitat quality in the northern Tianshan Mountain economic zone[J]. Arid Land Geography, 2025 , 48(12) : 2232 -2246 . DOI: 10.12118/j.issn.1000-6060.2025.074
表1 本研究使用数据信息Tab. 1 Data information in this study |
| 数据名称 | 类型(分辨率) | 时间跨度 | 来源 |
|---|---|---|---|
| 过去的人口、GDP | 统计数据 | 2000—2023年 | 《中国统计年鉴》 |
| 未来的人口、GDP | 栅格数据/0.5° | 2024—2050年 | Science Data Bank Platform, https://www.scidb.cn/en/detail?dataSetId=73c1ddbd79e54638bd0ca2a6bd48e3ff |
| 土地利用/覆盖(LULC) | 栅格数据/30 m | 2000—2023年 | China Land Cover Dataset, https://zenodo.org/records/8176941 |
| 高程、坡度 | 栅格数据/90 m | 2000年 | Google Earth Engine,SRTM Digital Elevation Data (Version 4) |
| 行政区划、城市中心 | 矢量数据 | 2023年 | 标准地图服务, http://bzdt.ch.mnr.gov.cn/index.html |
| 路网、河流 | 矢量数据 | 2013、2023年 | Open Street Map, https://www.openstreetmap.org |
表2 2000—2023年天山北坡经济带城市用地及生境质量变化Tab. 2 Changes of urban land use and habitat quality in the northern Tianshan Mountain economic zone from 2000 to 2023 |
| 城市 | 城市用地 | 生境质量 | |||||||||
|---|---|---|---|---|---|---|---|---|---|---|---|
| 2000年 | 2023年 | 扩张面积/km2 | 扩张率/% | 趋势/km2·a-1 | 2000年 | 2023年 | 损失 | 损失率/% | 趋势/a-1 | ||
| 温泉县 | 0.23 | 3.44 | 3.21 | 1395.65 | 0.12 | 0.777 | 0.746 | 0.031 | 3.946 | -0.006 | |
| 博乐市 | 30.37 | 90.29 | 59.92 | 197.30 | 2.56 | 0.694 | 0.672 | 0.022 | 3.182 | -0.004 | |
| 精河县 | 26.41 | 270.41 | 244.00 | 923.89 | 10.04 | 0.578 | 0.547 | 0.031 | 5.418 | -0.006 | |
| 乌苏市 | 53.06 | 192.23 | 139.17 | 262.29 | 6.92 | 0.596 | 0.580 | 0.015 | 2.551 | -0.004 | |
| 克拉玛依市 | 15.82 | 82.91 | 67.09 | 424.08 | 3.08 | 0.324 | 0.309 | 0.015 | 4.679 | -0.003 | |
| 奎屯市 | 28.80 | 98.30 | 69.50 | 241.32 | 3.48 | 0.760 | 0.636 | 0.123 | 16.248 | -0.029 | |
| 沙湾市 | 23.84 | 105.12 | 81.28 | 340.94 | 3.70 | 0.575 | 0.553 | 0.021 | 3.739 | -0.006 | |
| 石河子市 | 19.78 | 80.17 | 60.39 | 305.31 | 2.91 | 0.553 | 0.527 | 0.027 | 4.851 | -0.005 | |
| 玛纳斯县 | 20.52 | 80.34 | 59.82 | 291.52 | 2.82 | 0.492 | 0.488 | 0.005 | 0.952 | -0.001 | |
| 呼图壁县 | 11.43 | 47.82 | 36.39 | 318.37 | 1.76 | 0.597 | 0.562 | 0.035 | 5.810 | -0.011 | |
| 昌吉市 | 33.16 | 107.79 | 74.63 | 225.06 | 3.51 | 0.611 | 0.570 | 0.042 | 6.827 | -0.009 | |
| 米泉市 | 49.93 | 124.79 | 74.86 | 149.93 | 3.52 | 0.493 | 0.462 | 0.031 | 6.302 | -0.007 | |
| 阜康市 | 12.43 | 41.68 | 29.25 | 235.32 | 1.38 | 0.491 | 0.428 | 0.063 | 12.886 | -0.013 | |
| 吉木萨尔县 | 5.29 | 18.11 | 12.82 | 242.34 | 0.54 | 0.494 | 0.438 | 0.056 | 11.289 | -0.009 | |
| 奇台县 | 9.29 | 24.46 | 15.17 | 163.29 | 0.63 | 0.387 | 0.364 | 0.022 | 5.805 | -0.005 | |
| 木垒哈萨克县 | 22.55 | 23.37 | 0.82 | 3.64 | 0.01 | 0.586 | 0.530 | 0.056 | 9.622 | -0.010 | |
| 乌鲁木齐市 | 188.81 | 364.88 | 176.07 | 93.25 | 7.56 | 0.674 | 0.615 | 0.059 | 8.738 | -0.012 | |
| 整体 | 551.72 | 1756.11 | 1204.39 | 218.30 | 54.70 | 0.551 | 0.520 | 0.031 | 5.574 | -0.008 | |
图5 2000—2023年天山北坡经济带城市用地面积变化及2024—2050年城市用地需求注:SSP1~SSP5分别为可持续路径、中间路径、区域竞争路径、不平等路径、化石燃料依赖路径。下同。 Fig. 5 Changes in urban land area in the northern Tianshan Mountain economic zone from 2000 to 2023 and urban land demand from 2024 to 2050 |
表3 2023—2050年天山北坡经济带城市用地及生境质量变化Tab. 3 Changes of urban land use and habitat quality in the northern Tianshan Mountain economic zone from 2023 to 2050 |
| 城市 | 城市用地 | 生境质量 | |||||
|---|---|---|---|---|---|---|---|
| 2023—2050年扩张面积/km2 | 扩张率/% | 趋势/km2·a-1 | 2023—2050年损失/10-2 | 损失率/% | 趋势/10-3·a-1 | ||
| 温泉县 | 0.02~0.03 | 0.58~0.87 | 0.00~0.01 | 0.00~0.00 | 0.00~0.00 | 0.00~0.00 | |
| 博乐市 | 51.64~69.02 | 57.19~76.44 | 9.01~12.88 | 0.35~0.46 | 0.52~0.69 | -0.86~-0.61 | |
| 精河县 | 129.59~195.43 | 47.92~72.27 | 24.31~38.13 | 0.50~0.75 | 0.91~1.37 | -1.47~-0.94 | |
| 乌苏市 | 215.74~335.97 | 112.23~174.78 | 37.58~57.39 | 0.81~1.23 | 1.40~2.13 | -2.18~-1.42 | |
| 克拉玛依市 | 90.95~178.02 | 109.70~214.71 | 16.42~25.76 | 0.60~1.14 | 1.94~3.69 | -1.77~-1.10 | |
| 奎屯市 | 98.68~140.91 | 100.39~143.35 | 15.69~23.39 | 3.79~5.26 | 5.95~8.26 | -8.84~-6.17 | |
| 沙湾市 | 77.77~125.63 | 73.98~119.51 | 14.02~21.69 | 0.38~0.59 | 0.69~1.07 | -1.05~-0.68 | |
| 石河子市 | 83.51~114.75 | 104.17~143.13 | 13.92~19.72 | 9.55~12.69 | 18.13~24.10 | -21.38~-15.72 | |
| 玛纳斯县 | 75.82~116.51 | 94.37~145.02 | 12.98~19.78 | 0.43~0.64 | 0.89~1.32 | -1.15~-0.74 | |
| 呼图壁县 | 57.09~84.12 | 119.39~175.91 | 10.68~15.67 | 0.41~0.60 | 0.74~1.07 | -1.15~-0.77 | |
| 昌吉市 | 123.78~184.30 | 114.83~170.98 | 21.93~33.47 | 1.10~1.61 | 1.93~2.82 | -2.99~-1.96 | |
| 米泉市 | 107.76~160.78 | 86.35~128.84 | 18.05~27.41 | 2.01~2.90 | 4.35~6.28 | -5.14~-3.37 | |
| 阜康市 | 36.70~52.41 | 88.05~125.74 | 6.65~10.03 | 0.32~0.45 | 0.74~1.05 | -0.86~-0.58 | |
| 吉木萨尔县 | 1.89~2.48 | 10.44~13.69 | 0.33~0.47 | 0.02~0.03 | 0.05~0.06 | -0.05~-0.03 | |
| 奇台县 | 1.94~2.53 | 7.93~10.34 | 0.34~0.49 | 0.01~0.01 | 0.02~0.03 | -0.02~-0.02 | |
| 木垒哈萨克县 | 0.00~0.00 | 0.00~0.00 | 0.00~0.00 | 0.00~0.00 | 0.00~0.00 | 0.00~0.00 | |
| 乌鲁木齐市 | 267.28~340.20 | 73.25~93.24 | 46.10~59.51 | 1.78~2.24 | 2.89~3.64 | -3.91~-3.06 | |
| 整体 | 1420.16~2103.09 | 80.87~119.76 | 244.03~369.38 | 0.57~0.82 | 1.10~1.58 | -1.48~-0.99 | |
| [1] |
|
| [2] |
王勇, 孙瑞欣. 土地利用变化对区域水-能源-粮食系统耦合协调度的影响——以京津冀城市群为研究对象[J]. 自然资源学报, 2022, 37(3): 582-599.
[
|
| [3] |
张敏, 杨励雅, 胡卓玮, 等. 长江经济带城市扩张的时空分异特征及影响机制[J]. 地理学报, 2024, 79(2): 439-461.
[
|
| [4] |
师静, 鲁雪媛, 陈旭. 昆明市城市化及城市热岛效应对植被净初级生产力的影响[J]. 草业科学, 2022, 39(12): 2589-2603.
[
|
| [5] |
|
| [6] |
王桂林, 张炜. 中国城市扩张及空间特征变化对PM2.5污染的影响[J]. 环境科学, 2019, 40(8): 3447-3456.
[
|
| [7] |
|
| [8] |
马丽莎, 刘殿锋, 刘耀林. 城市扩张与生态空间非线性动态耦合关系梯度分析模型[J]. 地球信息科学学报, 2023, 25(10): 1968-1985.
[
|
| [9] |
|
| [10] |
|
| [11] |
张学儒, 周杰, 李梦梅. 基于土地利用格局重建的区域生境质量时空变化分析[J]. 地理学报, 2020, 75(1): 160-178.
[
|
| [12] |
吴健生, 岳新欣, 秦维. 基于生态系统服务价值重构的生态安全格局构建: 以重庆两江新区为例[J]. 地理研究, 2017, 36(3): 429-440.
[
|
| [13] |
潘耀, 尹云鹤, 侯文娟, 等. 基于土地利用及植被覆盖变化的黄河源区生境质量时空变化特征[J]. 生态学报, 2022, 42(19): 7978-7988.
[
|
| [14] |
戴云哲, 李江风, 杨建新. 长沙都市区生境质量对城市扩张的时空响应[J]. 地理科学进展, 2018, 37(10): 1340-1351.
[
|
| [15] |
|
| [16] |
安文举, 鱼亦凡, 郝姗姗, 等. 基于土地利用变化的陕北多沙粗沙区生境质量演变及响应分析[J]. 干旱区地理, 2024, 47(3): 474-484.
[
|
| [17] |
|
| [18] |
|
| [19] |
|
| [20] |
|
| [21] |
|
| [22] |
周璐红, 曹瑞超. 黄土高原生境质量时空演变及其驱动因素[J]. 水土保持通报, 2022, 42(6): 343-350.
[
|
| [23] |
张露尹, 朱大明, 左小清, 等. 基于InVEST模型的多情景下滇中城市群生境质量时空演变特征及预测[J]. 兰州大学学报(自然科学版), 2024, 60(4): 547-555.
[
|
| [24] |
王新兴, 赵雪雁. 天山北坡经济带经济韧性与生态韧性的时空耦合研究[J]. 生态学报, 2024, 44(21): 9670-9683.
[
|
| [25] |
王婷, 沈赣华, 刘兵, 等. 天山北坡经济带水库群时空变化特征及驱动机制[J]. 干旱区研究, 2024, 41(9): 1456-1467.
[
|
| [26] |
|
| [27] |
|
| [28] |
姜彤, 赵晶, 景丞, 等. IPCC共享社会经济路径下中国和分省人口变化预估[J]. 气候变化研究进展, 2017, 13(2): 128-137.
[
|
| [29] |
姜彤, 赵晶, 曹丽格, 等. 共享社会经济路径下中国及分省经济变化预测[J]. 气候变化研究进展, 2018, 14(1): 50-58.
[
|
| [30] |
|
| [31] |
|
| [32] |
|
| [33] |
|
| [34] |
|
| [35] |
|
| [36] |
|
| [37] |
|
| [38] |
|
| [39] |
黄建毅, 刘毅, 马丽, 等. 城市区域的发展定位研究——以大克拉玛依地区为例[J]. 干旱区资源与环境, 2012, 26(9): 119-124.
[
|
| [40] |
孙桂丽, 陆海燕, 禹明柱, 等. 天山北坡经济带生态脆弱性评价及驱动力分析[J]. 西南农业学报, 2022, 35(9): 2161-2170.
[
|
| [41] |
邓铭江. 天山北坡经济带 “三生空间”发展格局与智能水网体系建设[J]. 干旱区地理, 2020, 43(5): 1155-1168.
[
|
| [42] |
廖娜, 王月健, 徐海量, 等. 新疆玛纳斯河流域绿洲耕地扩张差异与驱动力研究[J]. 中国生态农业学报(中英文), 2021, 29(6): 1008-1017.
[
|
| [43] |
如克亚·热合曼, 阿里木江·卡斯木, 哈力木拉提·阿布来提, 等. 基于InVEST模型的天山北坡城市群生境质量时空演化研究[J]. 生态与农村环境学报, 2022, 38(9): 1112-1121.
[
|
| [44] |
唐宏, 杨德刚, 乔旭宁, 等. 天山北坡区域发展与生态环境协调度评价[J]. 地理科学进展, 2009, 28(5): 805-813.
[
|
| [45] |
|
| [46] |
陈武迪, 刘晓煌, 李洪宇, 等. 新疆天山1990—2050年生态系统服务功能及安全格局[J]. 中国地质, 2024, 51(5): 1644-1663.
[
|
/
| 〈 |
|
〉 |