



Carbon budget balance and carbon compensation zoning of land use in Xinjiang’s counties
Received date: 2025-04-23
Revised date: 2025-06-25
Online published: 2026-03-11
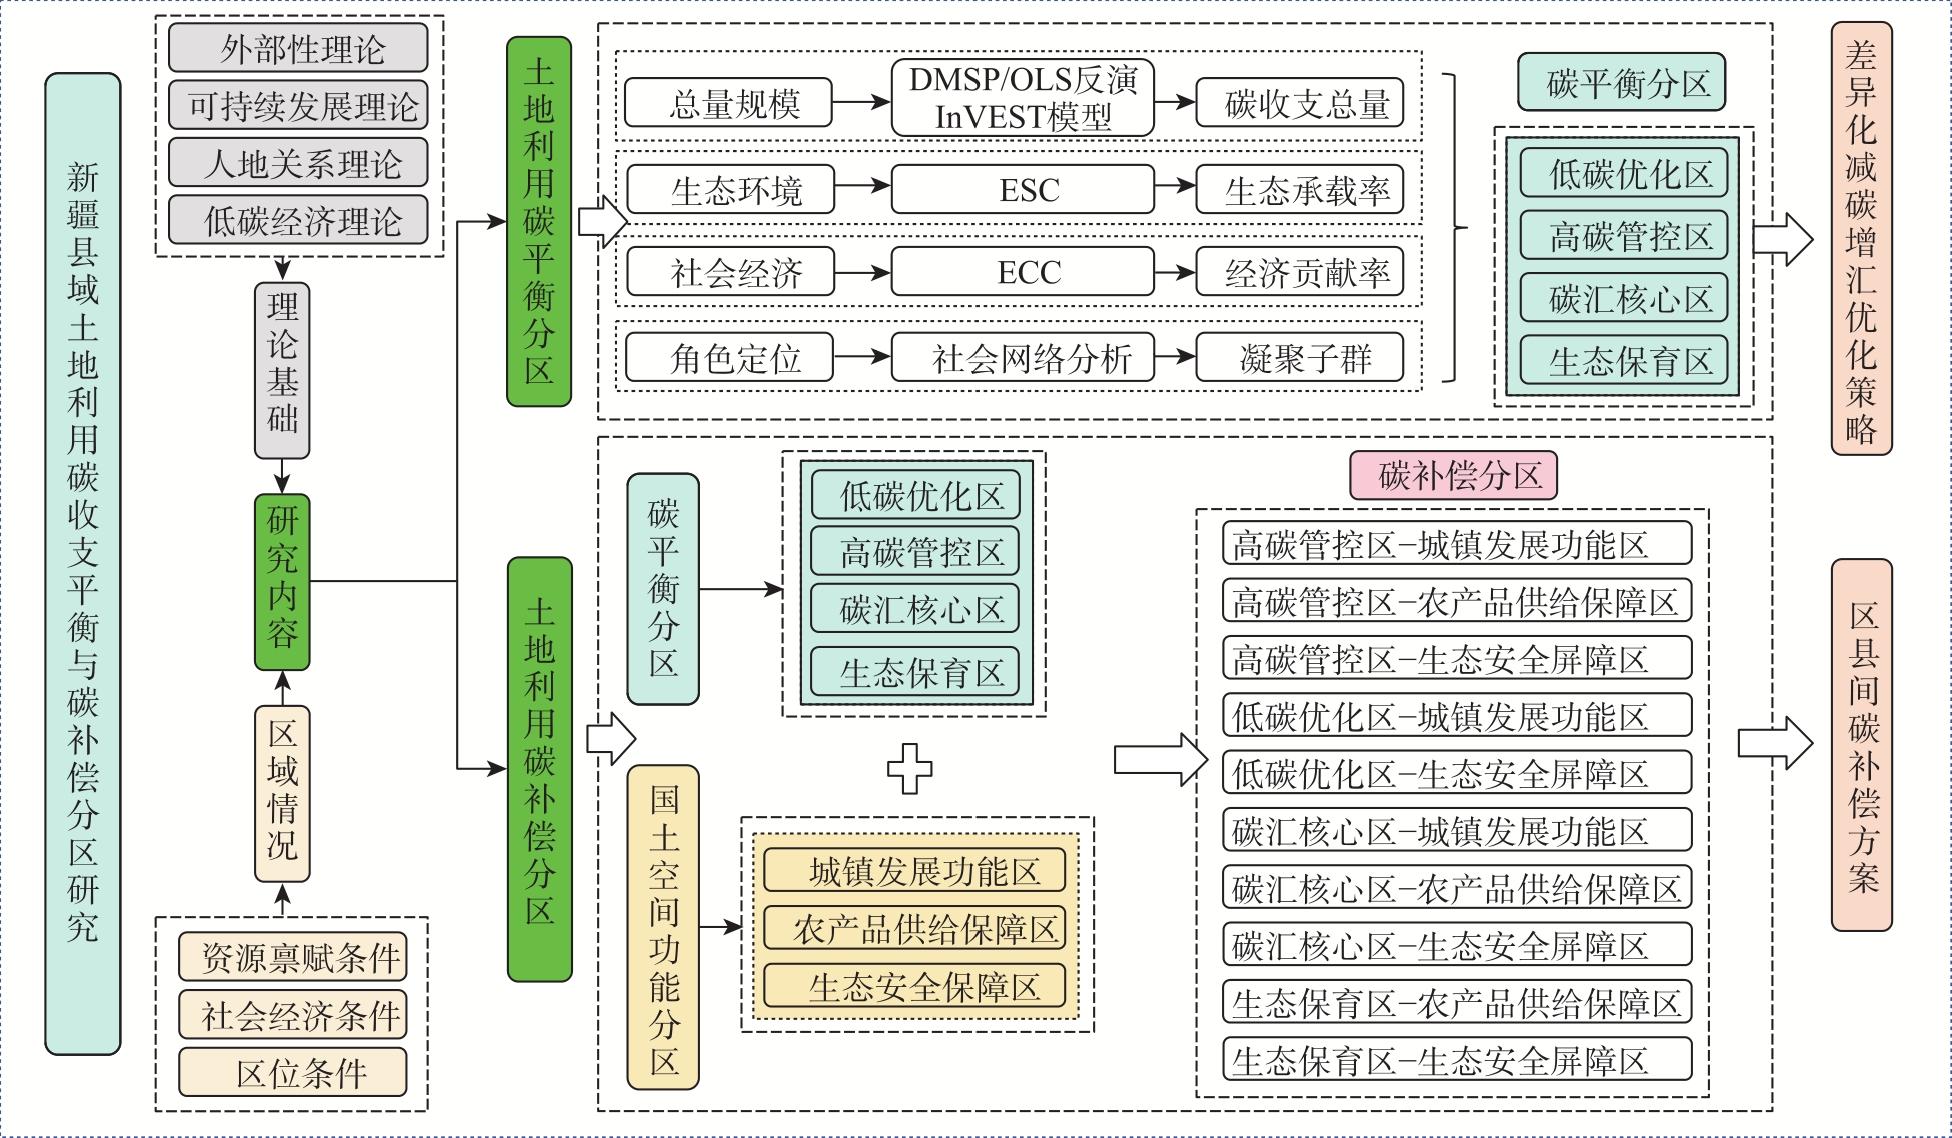
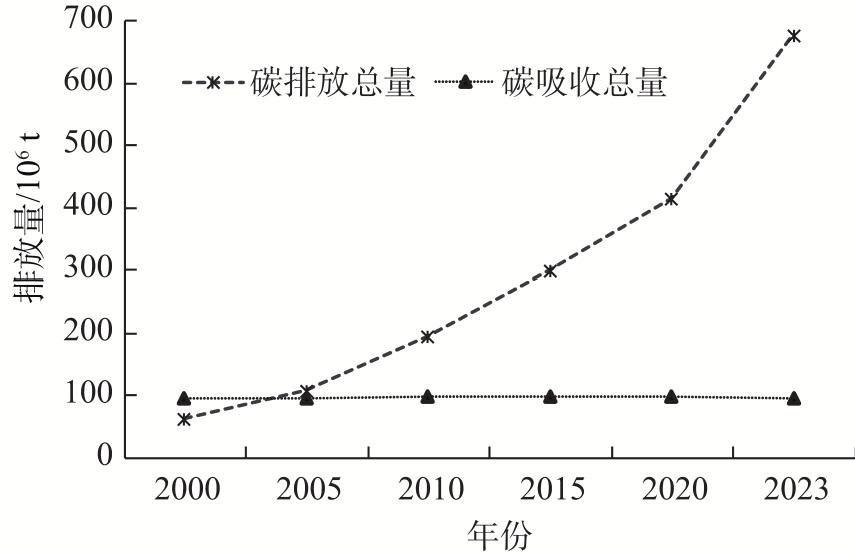
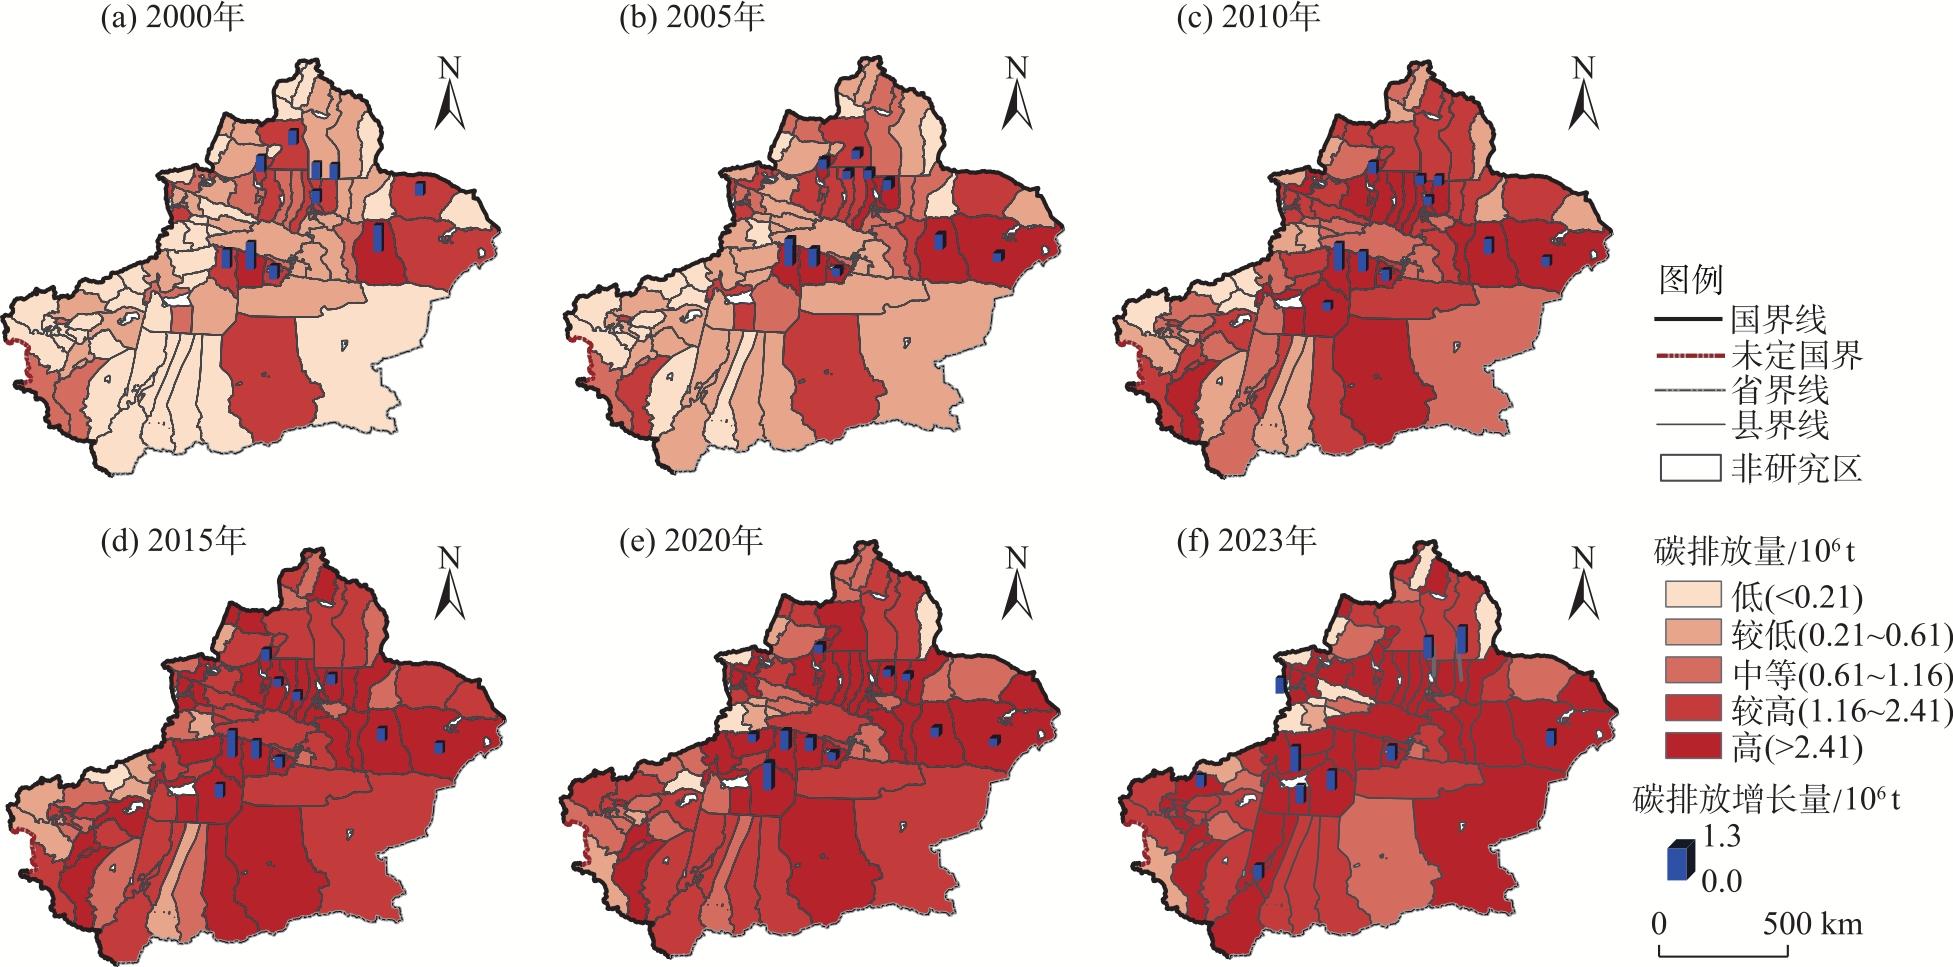
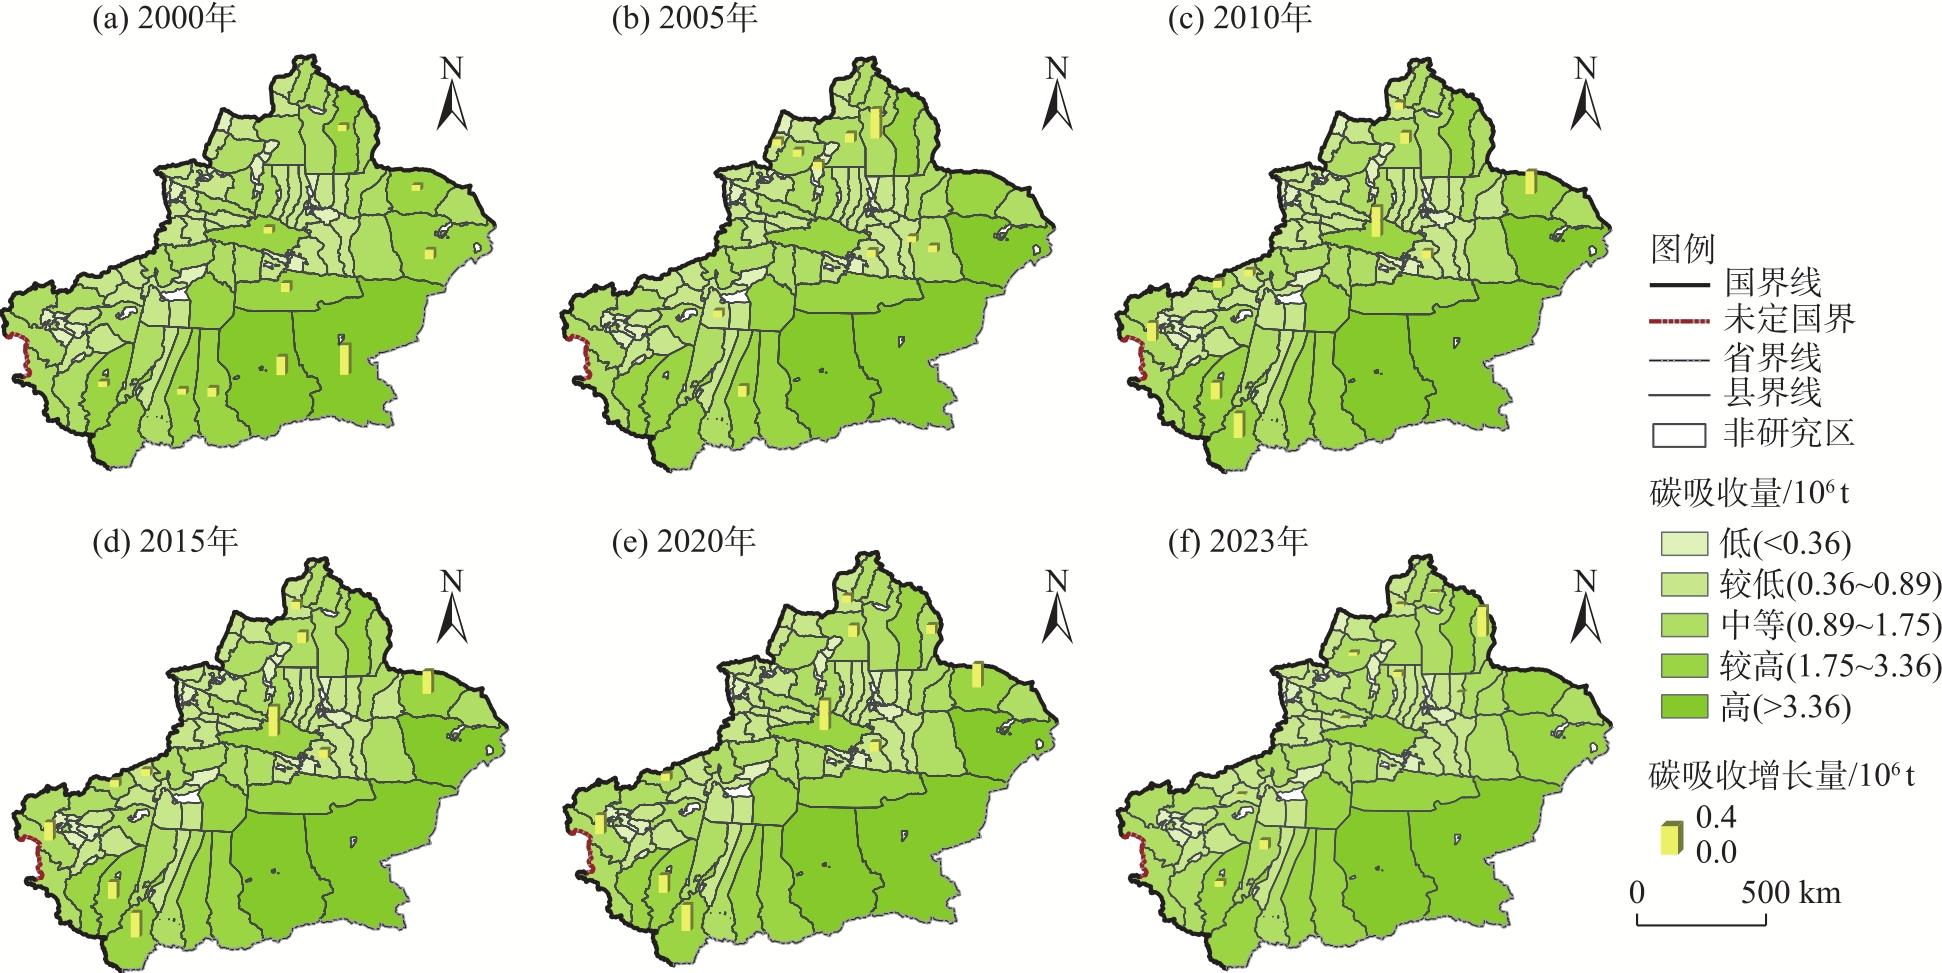
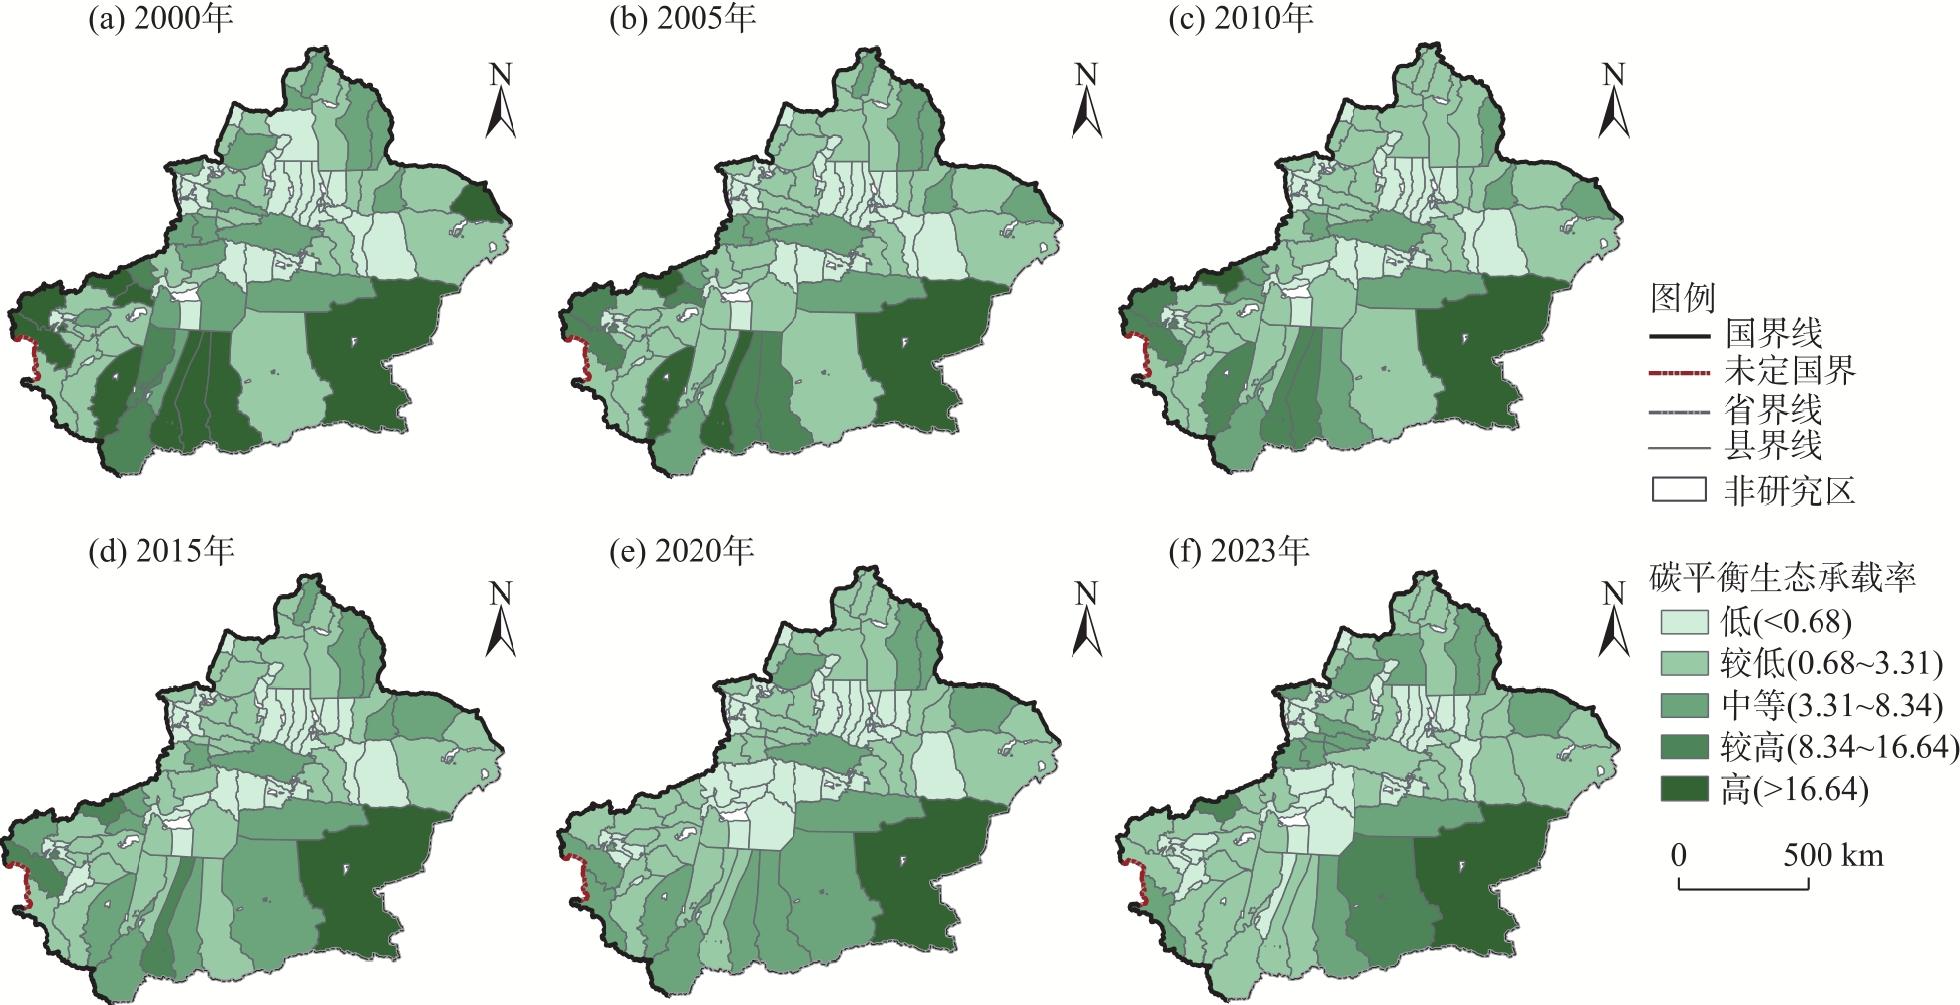
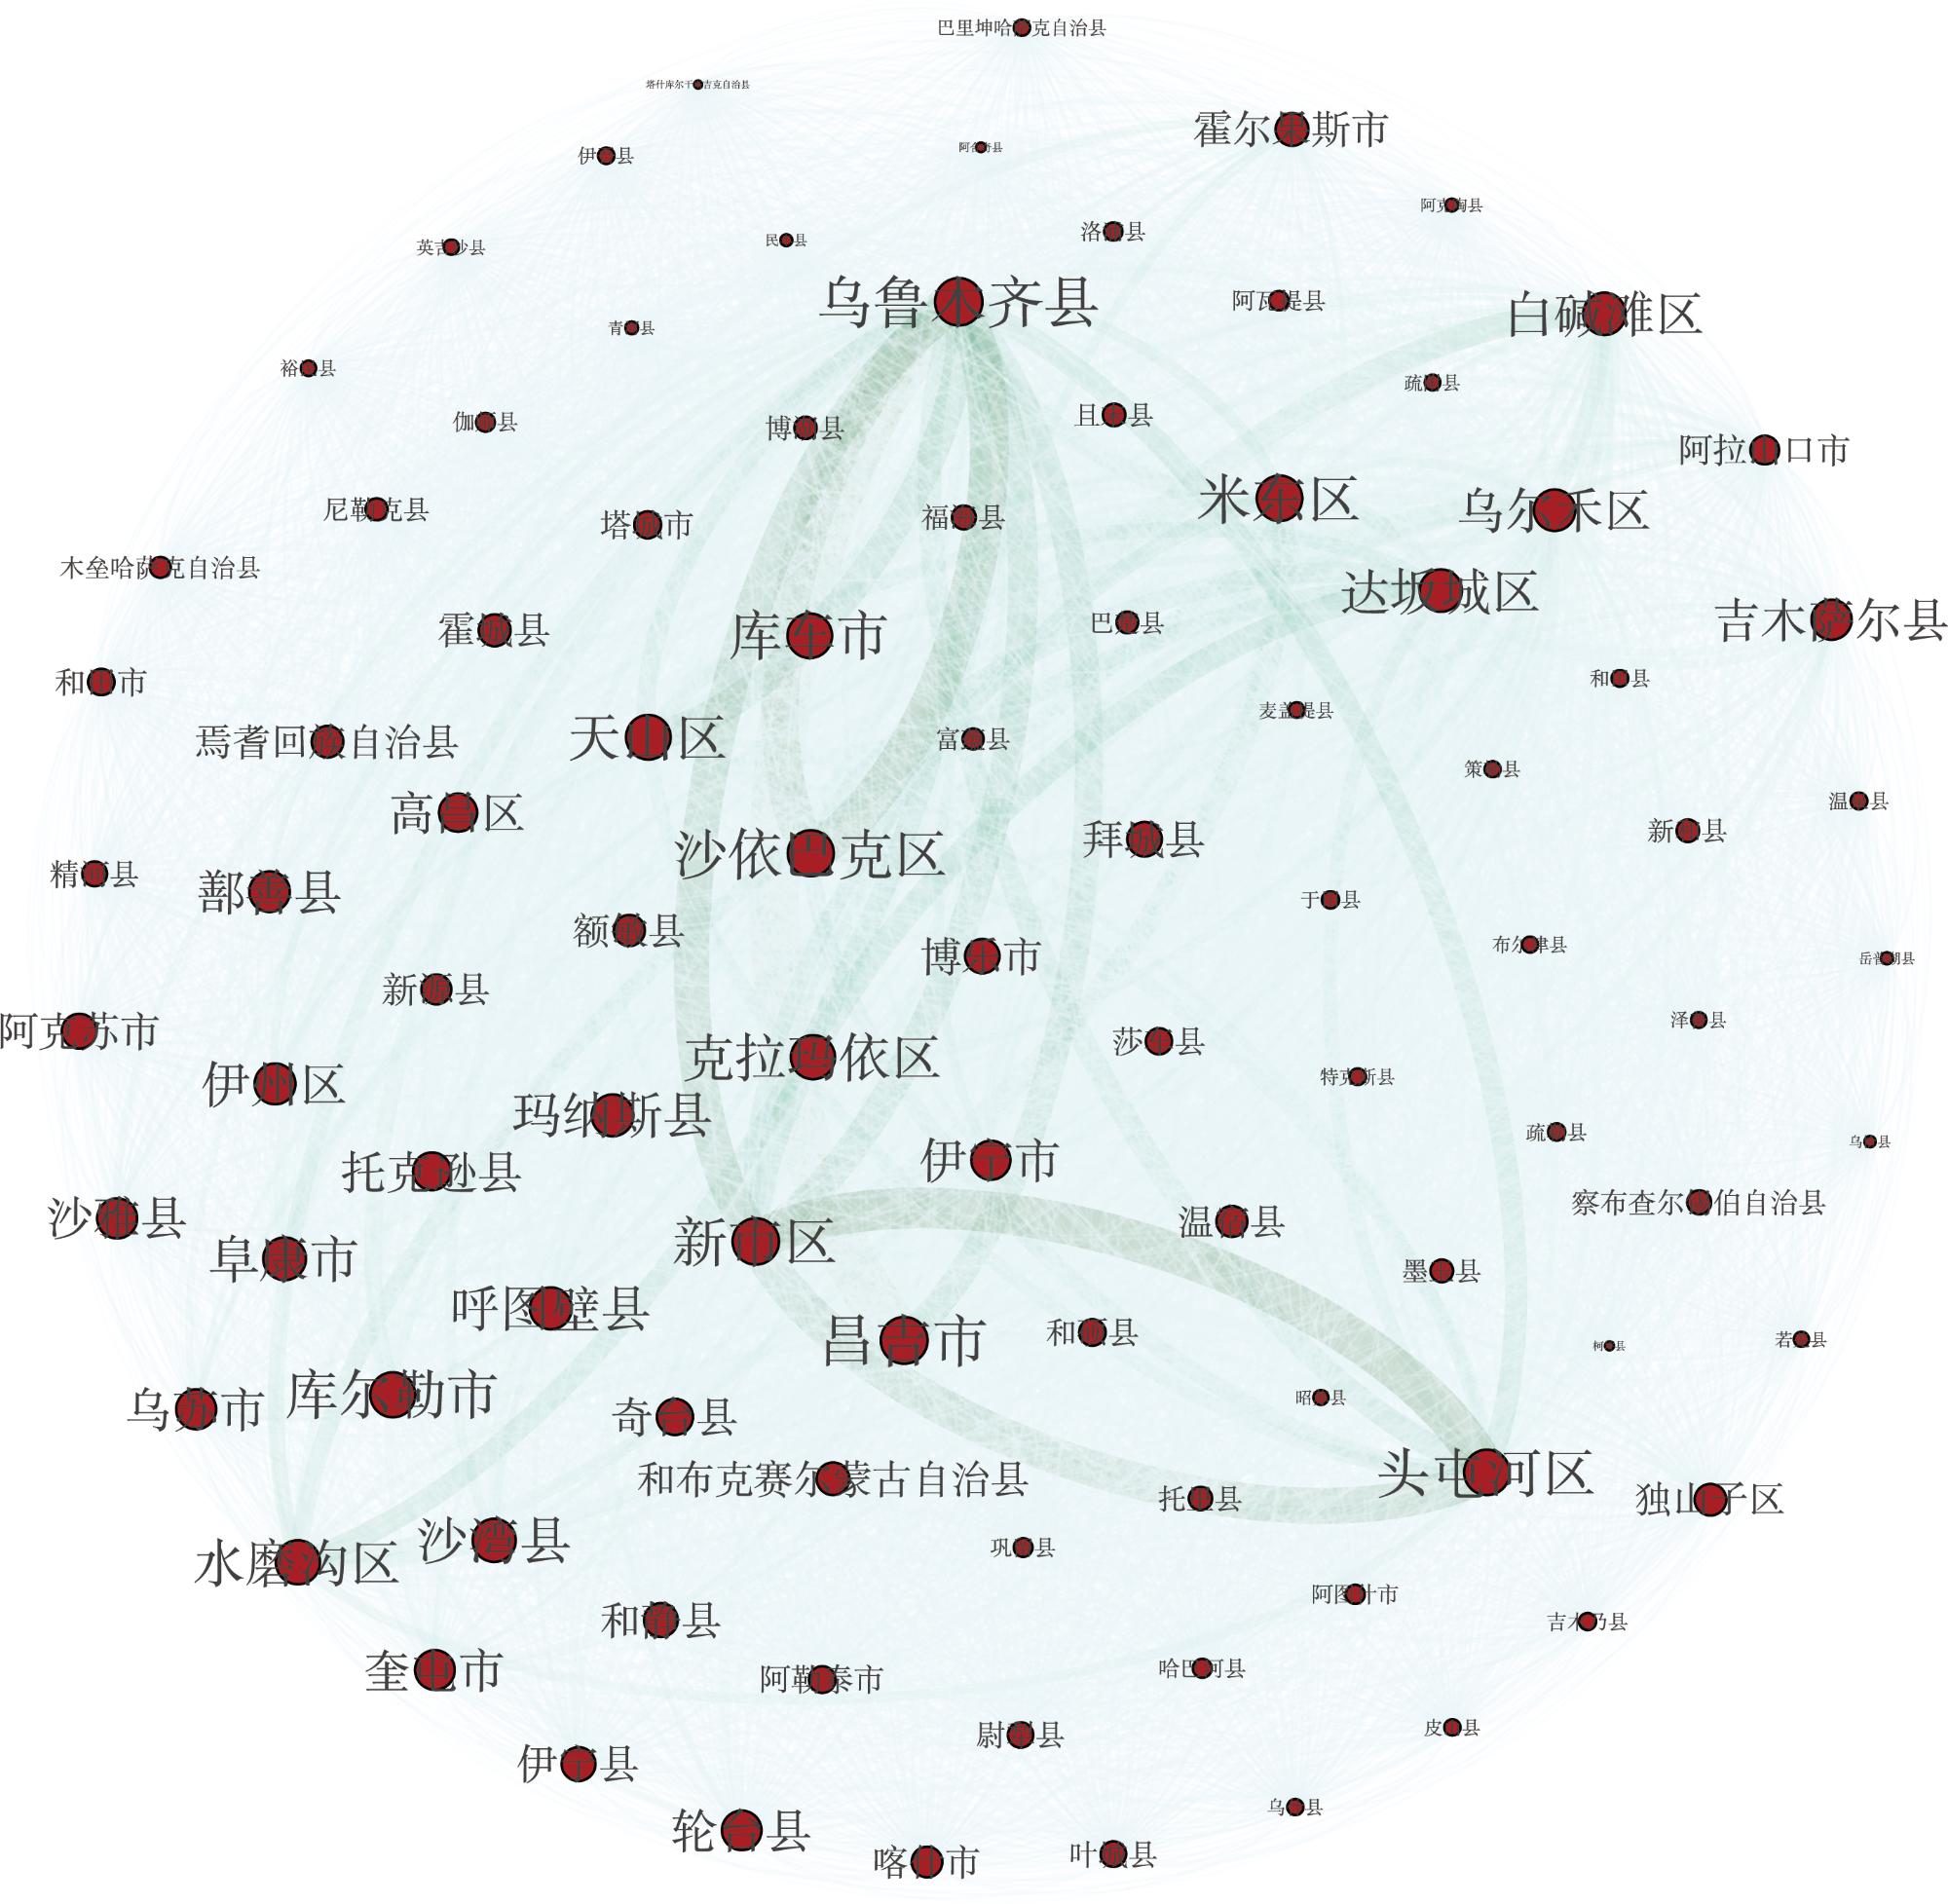
Xinjiang, a resource-rich region in China, faces interconnected challenges under the “Dual Carbon” strategy: Resource exploitation, ecological conservation, and carbon emission reduction. Analyzing land-use carbon budgets and their balancing mechanisms provides a theoretical basis for optimizing regional low-carbon land use. This study quantified county-level carbon budgets from 2000 to 2023, including carbon absorption, carbon emissions, the ecological support coefficient (ESC), and the economic contribution coefficient (ECC), across 96 counties in Xinjiang. Social network analysis was employed to characterize spatial correlations of carbon emissions, and a carbon-balance-oriented zoning framework was developed. Spatial overlay analysis integrated carbon balance zoning with major functional zoning to delineate carbon compensation zones. Key findings include: (1) A growing disparity between carbon emissions (surging from 60.28×10⁶ t to 677.81×10⁶ t) and absorption, forming a core-periphery spatial structure radiating from urban hubs; post-2020, carbon absorption declined significantly, displaying an inverse spatial pattern to emissions. (2) ESC exhibited persistent decline from 2000 to 2023, while ECC showed marked spatial heterogeneity. (3) The carbon emission network demonstrated high density (0.877) and polycentric dispersion, with core nodes dominating carbon flows. (4) Four functional zones were identified: Low-carbon optimization zones (12), high-carbon control zones (25), ecological conservation zones (22), and carbon sequestration core zones (37). Overlaying these with major functional zoning yielded 10 carbon compensation zones. To address socio-ecological conflicts in achieving carbon neutrality, Xinjiang requires spatially differentiated governance, regional collaborative emission reduction, and ecological compensation mechanisms.
Xiujuan SHI , Zhiqiang WANG . Carbon budget balance and carbon compensation zoning of land use in Xinjiang’s counties[J]. Arid Land Geography, 2025 , 48(12) : 2183 -2196 . DOI: 10.12118/j.issn.1000-6060.2025.210
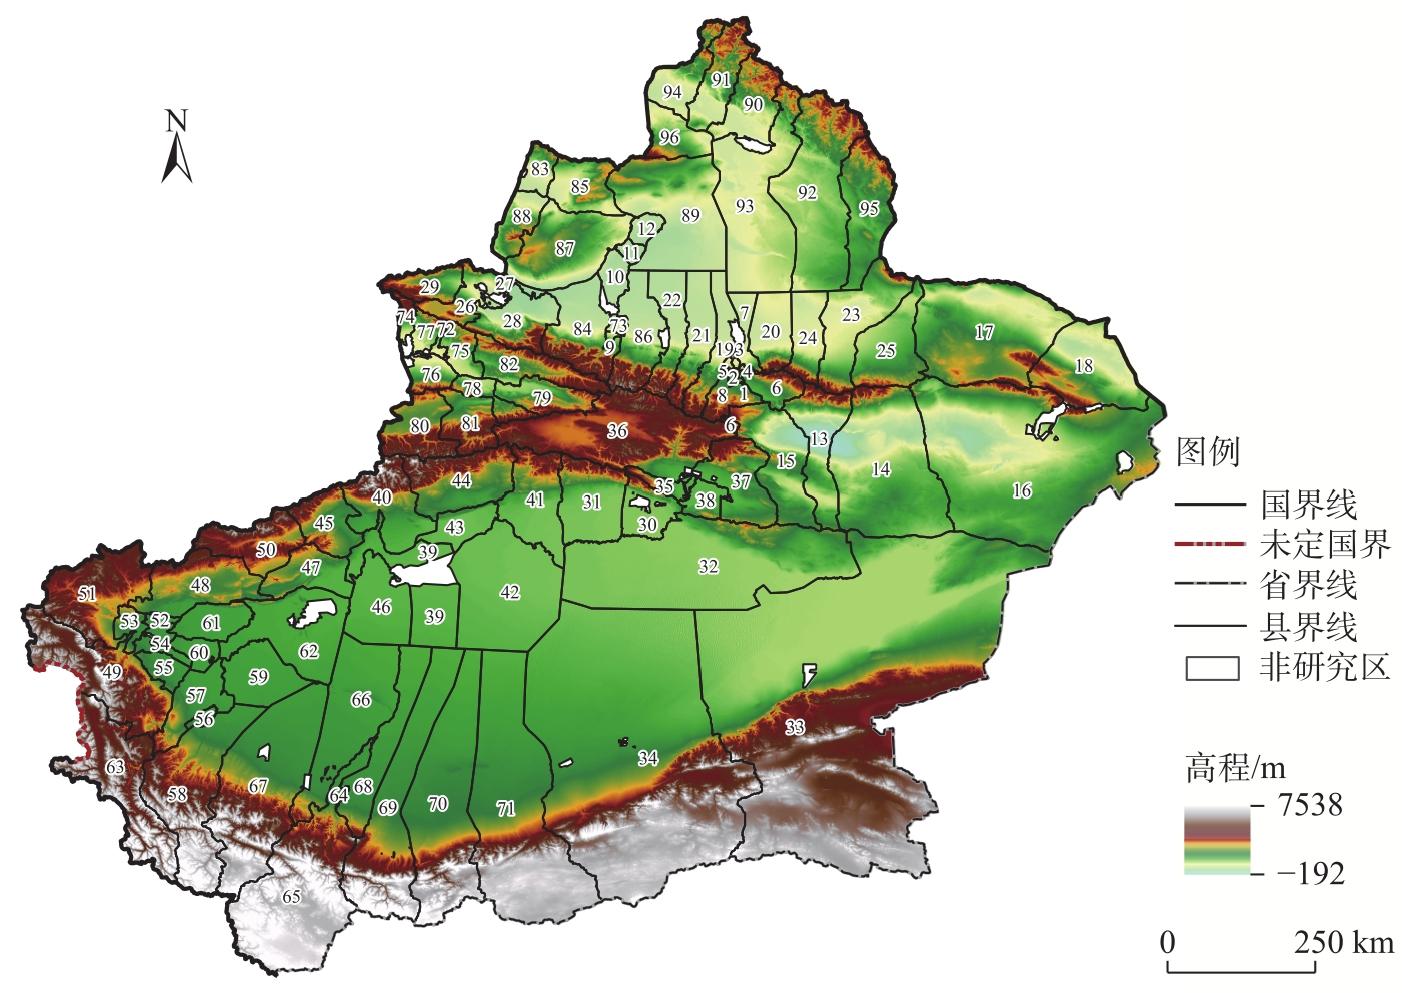
图1 研究区示意图注:基于自然资源部标准地图服务网站审图号为GS(2023)2767号的标准地图制作,底图边界无修改。图中数字1~96为本研究涉及的96个县域单元编号,其具体名称与编号对应关系见表1。下同。 Fig. 1 Schematic diagram of the study area |
表1 研究区县(区)级行政单元Tab. 1 County and district administrative units of the study area |
| 编号 | 县(区) | 编号 | 县(区) | 编号 | 县(区) | 编号 | 县(区) | 编号 | 县(区) |
|---|---|---|---|---|---|---|---|---|---|
| 1 | 天山区 | 21 | 呼图壁县 | 40 | 温宿县 | 59 | 麦盖提县 | 78 | 巩留县 |
| 2 | 沙依巴克区 | 22 | 玛纳斯县 | 41 | 库车市 | 60 | 岳普湖县 | 79 | 新源县 |
| 3 | 新市区 | 23 | 奇台县 | 42 | 沙雅县 | 61 | 伽师县 | 80 | 昭苏县 |
| 4 | 水磨沟区 | 24 | 吉木萨尔县 | 43 | 新和县 | 62 | 巴楚县 | 81 | 特克斯县 |
| 5 | 头屯河区 | 25 | 木垒哈萨克自治县 | 44 | 拜城县 | 63 | 塔什库尔干塔吉克自治县 | 82 | 尼勒克县 |
| 6 | 达坂城区 | 26 | 博乐市 | 45 | 乌什县 | 64 | 和田市 | 83 | 塔城市 |
| 7 | 米东区 | 27 | 阿拉山口市 | 46 | 阿瓦提县 | 65 | 和田县 | 84 | 乌苏市 |
| 8 | 乌鲁木齐县 | 28 | 精河县 | 47 | 柯坪县 | 66 | 墨玉县 | 85 | 额敏县 |
| 9 | 独山子区 | 29 | 温泉县 | 48 | 阿图什市 | 67 | 皮山县 | 86 | 沙湾市 |
| 10 | 克拉玛依区 | 30 | 库尔勒市 | 49 | 阿克陶县 | 68 | 洛浦县 | 87 | 托里县 |
| 11 | 白碱滩区 | 31 | 轮台县 | 50 | 阿合奇县 | 69 | 策勒县 | 88 | 裕民县 |
| 12 | 乌尔禾区 | 32 | 尉犁县 | 51 | 乌恰县 | 70 | 于田县 | 89 | 和布克赛尔蒙古自治县 |
| 13 | 高昌区 | 33 | 若羌县 | 52 | 喀什市 | 71 | 民丰县 | 90 | 阿勒泰市 |
| 14 | 鄯善县 | 34 | 且末县 | 53 | 疏附县 | 72 | 伊宁市 | 91 | 布尔津县 |
| 15 | 托克逊县 | 35 | 焉耆回族自治县 | 54 | 疏勒县 | 73 | 奎屯市 | 92 | 富蕴县 |
| 16 | 伊州区 | 36 | 和静县 | 55 | 英吉沙县 | 74 | 霍尔果斯市 | 93 | 福海县 |
| 17 | 巴里坤哈萨克自治县 | 37 | 和硕县 | 56 | 泽普县 | 75 | 伊宁县 | 94 | 哈巴河县 |
| 18 | 伊吾县 | 38 | 博湖县 | 57 | 莎车县 | 76 | 察布查尔锡伯自治县 | 95 | 青河县 |
| 19 | 昌吉市 | 39 | 阿克苏市 | 58 | 叶城县 | 77 | 霍城县 | 96 | 吉木乃县 |
| 20 | 阜康市 |
表2 新疆县域各类土地利用类型碳库Tab. 2 Carbon pools of various land use types in Xinjiang /Mg·hm-2 |
| 土地利用类型 | ${C}_{{i}_{\_\mathrm{a}\mathrm{b}\mathrm{o}\mathrm{v}\mathrm{e}}}$ | ${C}_{{i}_{\_\mathrm{b}\mathrm{e}\mathrm{l}\mathrm{o}\mathrm{w}}}$ | ${C}_{{i}_{\_\mathrm{s}\mathrm{o}\mathrm{i}\mathrm{l}}}$ | ${C}_{{i}_{\_\mathrm{d}\mathrm{e}\mathrm{a}\mathrm{d}}}$ |
|---|---|---|---|---|
| 耕地 | 1.96 | 6.83 | 59.32 | 0.65 |
| 林地 | 27.52 | 11.62 | 92.67 | 4.54 |
| 草地 | 2.98 | 6.74 | 55.07 | 1.26 |
| 水域 | 1.45 | 0.66 | 0.00 | 0.00 |
| 建设用地 | 2.59 | 2.11 | 0.00 | 0.00 |
| 未利用地 | 1.19 | 1.26 | 26.24 | 0.00 |
注:${C}_{{i}_{\_\mathrm{a}\mathrm{b}\mathrm{o}\mathrm{v}\mathrm{e}}}$为第i种土地利用类型的地上生物量碳吸收量;${C}_{{i}_{\_\mathrm{b}\mathrm{e}\mathrm{l}\mathrm{o}\mathrm{w}}}$为第i种土地利用类型的地下生物量碳吸收量;${C}_{{i}_{\_\mathrm{s}\mathrm{o}\mathrm{i}\mathrm{l}}}$为第i种土地利用类型的土壤碳吸收量;${C}_{{i}_{\_\mathrm{d}\mathrm{e}\mathrm{a}\mathrm{d}}}$为第i种土地利用类型的死亡有机质碳吸收量。 |
表3 2020年新疆县域碳排放凝聚子群识别标准及特征Tab. 3 Identification criteria and characteristics of carbon emission cohesive subgroups in Xinjiang’s counties in 2020 |
| 板块 | 分类 | 关键特征 |
|---|---|---|
| 板块1 | 净受益板块 | 内部密度极高,依赖外部资源输入 |
| 板块2 | 净受益板块 | 内部高度封闭,流入略高于流出 |
| 板块3 | 净溢出板块 | 内部松散,资源单向向外输出 |
| 板块4 | 经纪人板块 | 连接板块1和板块2,控制关键资源流动路径 |
表4 碳平衡分区划分依据Tab. 4 Criteria for carbon balance zoning |
| 区域类型 | 区域划分依据 | 空间功能特征 |
|---|---|---|
| 低碳优化区 | ECC<1,ESC<1,CAi<Ci | 呈“高排放-低效益”特征:碳排放总量与经济产出效率倒挂,生态本底脆弱性显著,是网络中的“净溢出板块” |
| 高碳管控区 | ECC>1,ESC<1,CAi<Ci | 呈“高排放-高增长”特征:能源密集型产业集聚,生态赤字持续扩大,是网络中的“经纪人板块” |
| 生态保育区 | ECC<1,ESC>1,CAi<Ci | 呈“低经济-高生态”特征:碳汇经济转化效率不足,生态系统服务价值突出,是网络中的弱“净受益板块” |
| 碳汇核心区 | ECC<1,ESC>1,CAi>Ci | 呈“强碳汇-稳生态”特征:自然碳库储量优势显著,碳抵消贡献度突出,是网络中的强“净受益板块” |
注:ESC为碳平衡生态承载率;ECC为碳平衡经济贡献率;CAi为i县域单元的碳吸收量;Ci为i县域单元的碳排放量。 |
| [1] |
王新令. 积极应对气候变化, 推动清洁低碳转型——《2030年前碳达峰行动方案》解读[J]. 中国电业, 2021(12): 22-25.
[
|
| [2] |
Intergovernmental Panel on Climate Change. Climate change 2013: The physical science basis[R]. Cambridge: Cambridge University Press, 2013.
|
| [3] |
|
| [4] |
|
| [5] |
|
| [6] |
|
| [7] |
|
| [8] |
|
| [9] |
|
| [10] |
|
| [11] |
章登锋. 长江经济带土地利用碳排放时空特征及影响因素分析[D]. 武汉: 华中农业大学, 2023.
[
|
| [12] |
陈靖松, 张建军, 李金龙, 等. 京津冀地区碳排放时空格局变化及其驱动因子[J]. 生态学报, 2024, 44(6): 2270-2283.
[
|
| [13] |
易丹, 欧名豪, 郭杰, 等. 土地利用碳排放及低碳优化研究进展与趋势展望[J]. 资源科学, 2022, 44(8): 1545-1559.
[
|
| [14] |
李寒雨, 毛春梅. 碳中和目标下长三角城市群碳收支时空分异与碳补偿量化研究[J]. 环境保护科学, 2024, 50(5): 67-75.
[
|
| [15] |
程番苑, 石培基, 张韦萍, 等. 主体功能区视角下兰西城市群碳收支时空分异及碳补偿分区——基于DMSP/OLS和NPP/VIIRS夜间灯光数据[J]. 环境科学学报, 2023, 43(11): 398-410.
[
|
| [16] |
|
| [17] |
|
| [18] |
|
| [19] |
|
| [20] |
|
| [21] |
|
| [22] |
自然资源部. 标准地图服务系统(审图号: GS(2023)2767)[EB/OL]. [2025-02-18]. http://bzdt.ch.mnr.gov.cn/browse.
[Ministry of Natural Resources. Standard map service system (approval map number: GS(2023)2767)[EB/OL]. [2025-02-18]. http://bzdt.ch.mnr.gov.cn/browse.]
|
| [23] |
|
| [24] |
|
| [25] |
徐丽, 何念鹏, 于贵瑞. 2010s中国陆地生态系统碳密度数据集[J]. 中国科学数据(中英文网络版), 2019, 4(1): 90-96.
[
|
| [26] |
傅楷翔, 贾国栋, 余新晓, 等. 耦合PLUS-InVEST-Geodector模型的新疆地区碳储量时空变化及驱动机制分析[J]. 环境科学, 2024, 45(9): 5416-5430.
[
|
| [27] |
|
| [28] |
|
| [29] |
苑韶峰, 唐奕钰. 低碳视角下长江经济带土地利用碳排放的空间分异[J]. 经济地理, 2019, 39(2): 190-198.
[
|
| [30] |
赵荣钦, 张帅, 黄贤金, 等. 中原经济区县域碳收支空间分异及碳平衡分区[J]. 地理学报, 2014, 69(10): 1425-1437.
[
|
| [31] |
刘华军, 刘传明, 孙亚男. 中国能源消费的空间关联网络结构特征及其效应研究[J]. 中国工业经济, 2015(5): 83-95.
[
|
| [32] |
刘军. 整体网分析—UCINET软件使用指南[M]. 上海: 格致出版社&上海人民出版社, 2021: 1-11.
[
|
| [33] |
王丽蓉, 石培基, 尹君锋, 等. 碳中和视角下甘肃省县域碳收支时空分异与国土空间分区优化[J]. 环境科学, 2024, 45(7): 4101-4111.
[
|
| [34] |
郑航, 叶阿忠. 空间关联网络结构特征的减排效应: 基于城市群视角[J]. 环境科学, 2022, 43(10): 4401-4407.
[
|
/
| 〈 |
|
〉 |