
Spatiotemporal changes and driving factors of ecological environment quality in the Shanxi section of the Yellow River Basin from 2000 to 2023
Received date: 2025-04-22
Revised date: 2025-08-03
Online published: 2026-03-11
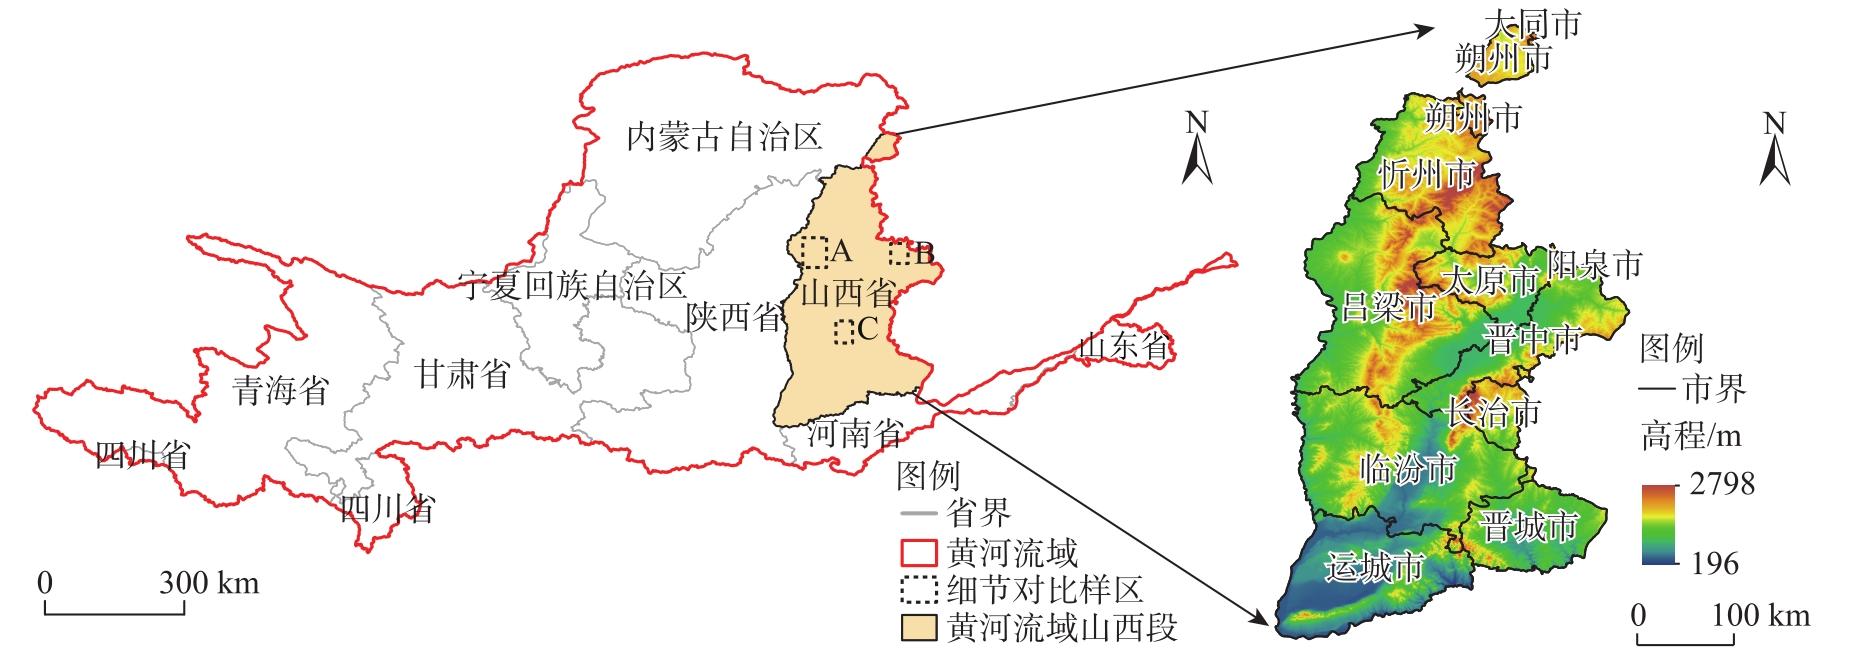
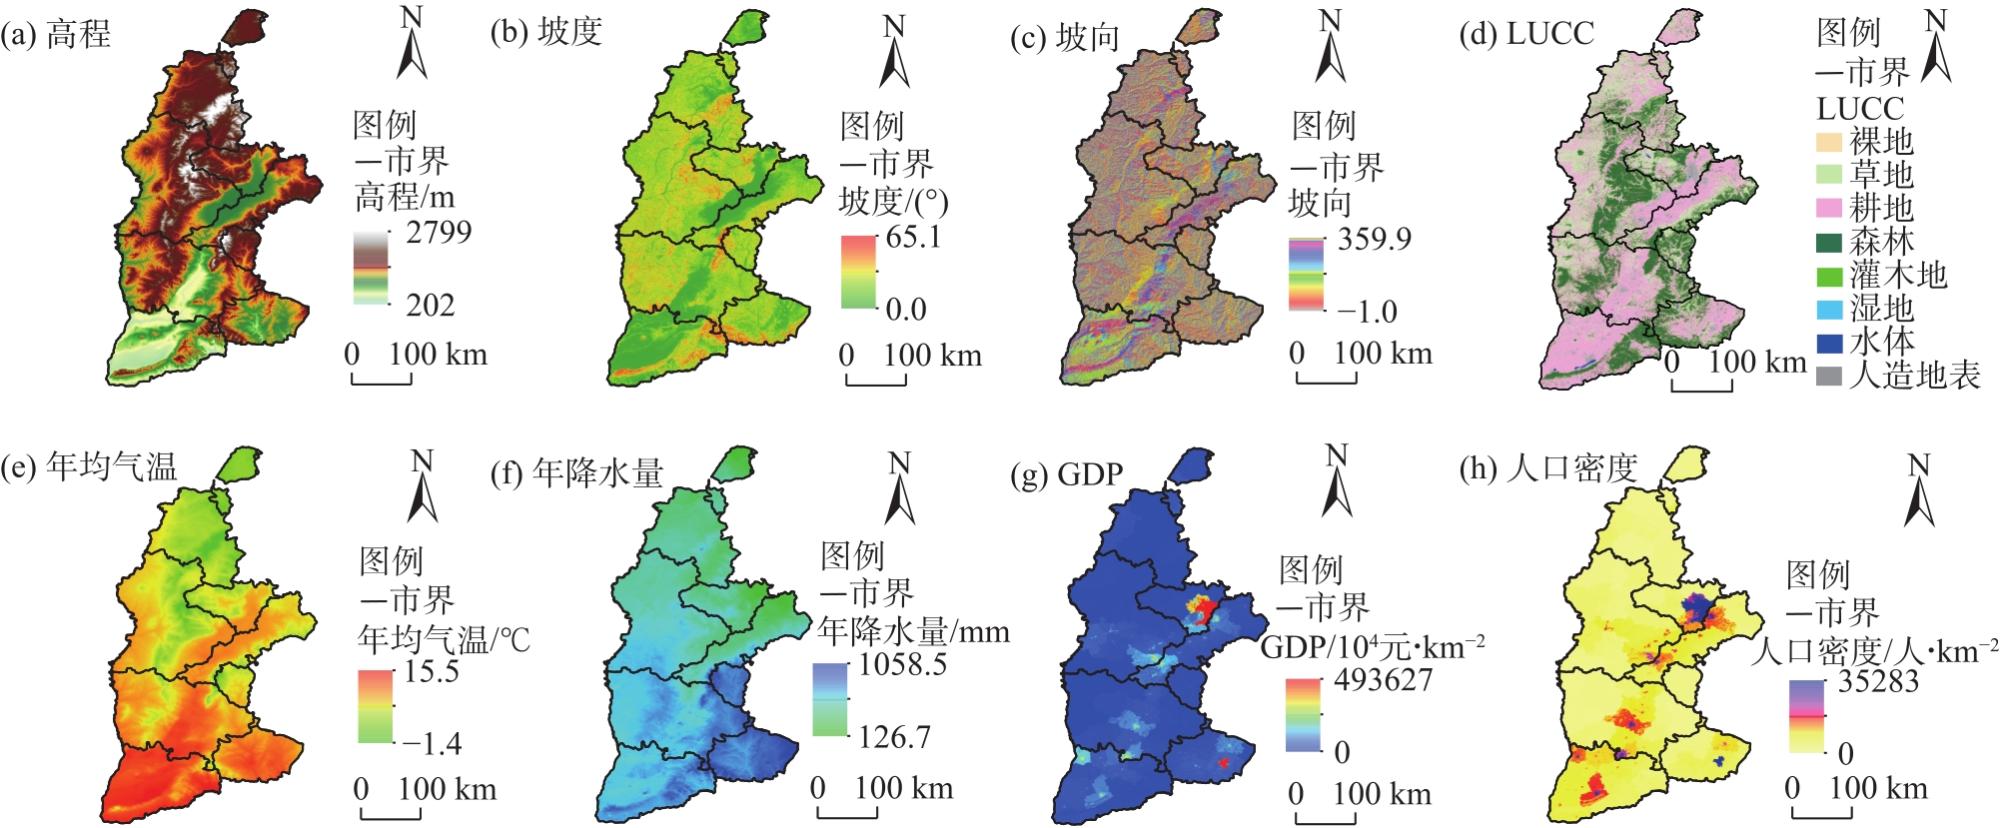
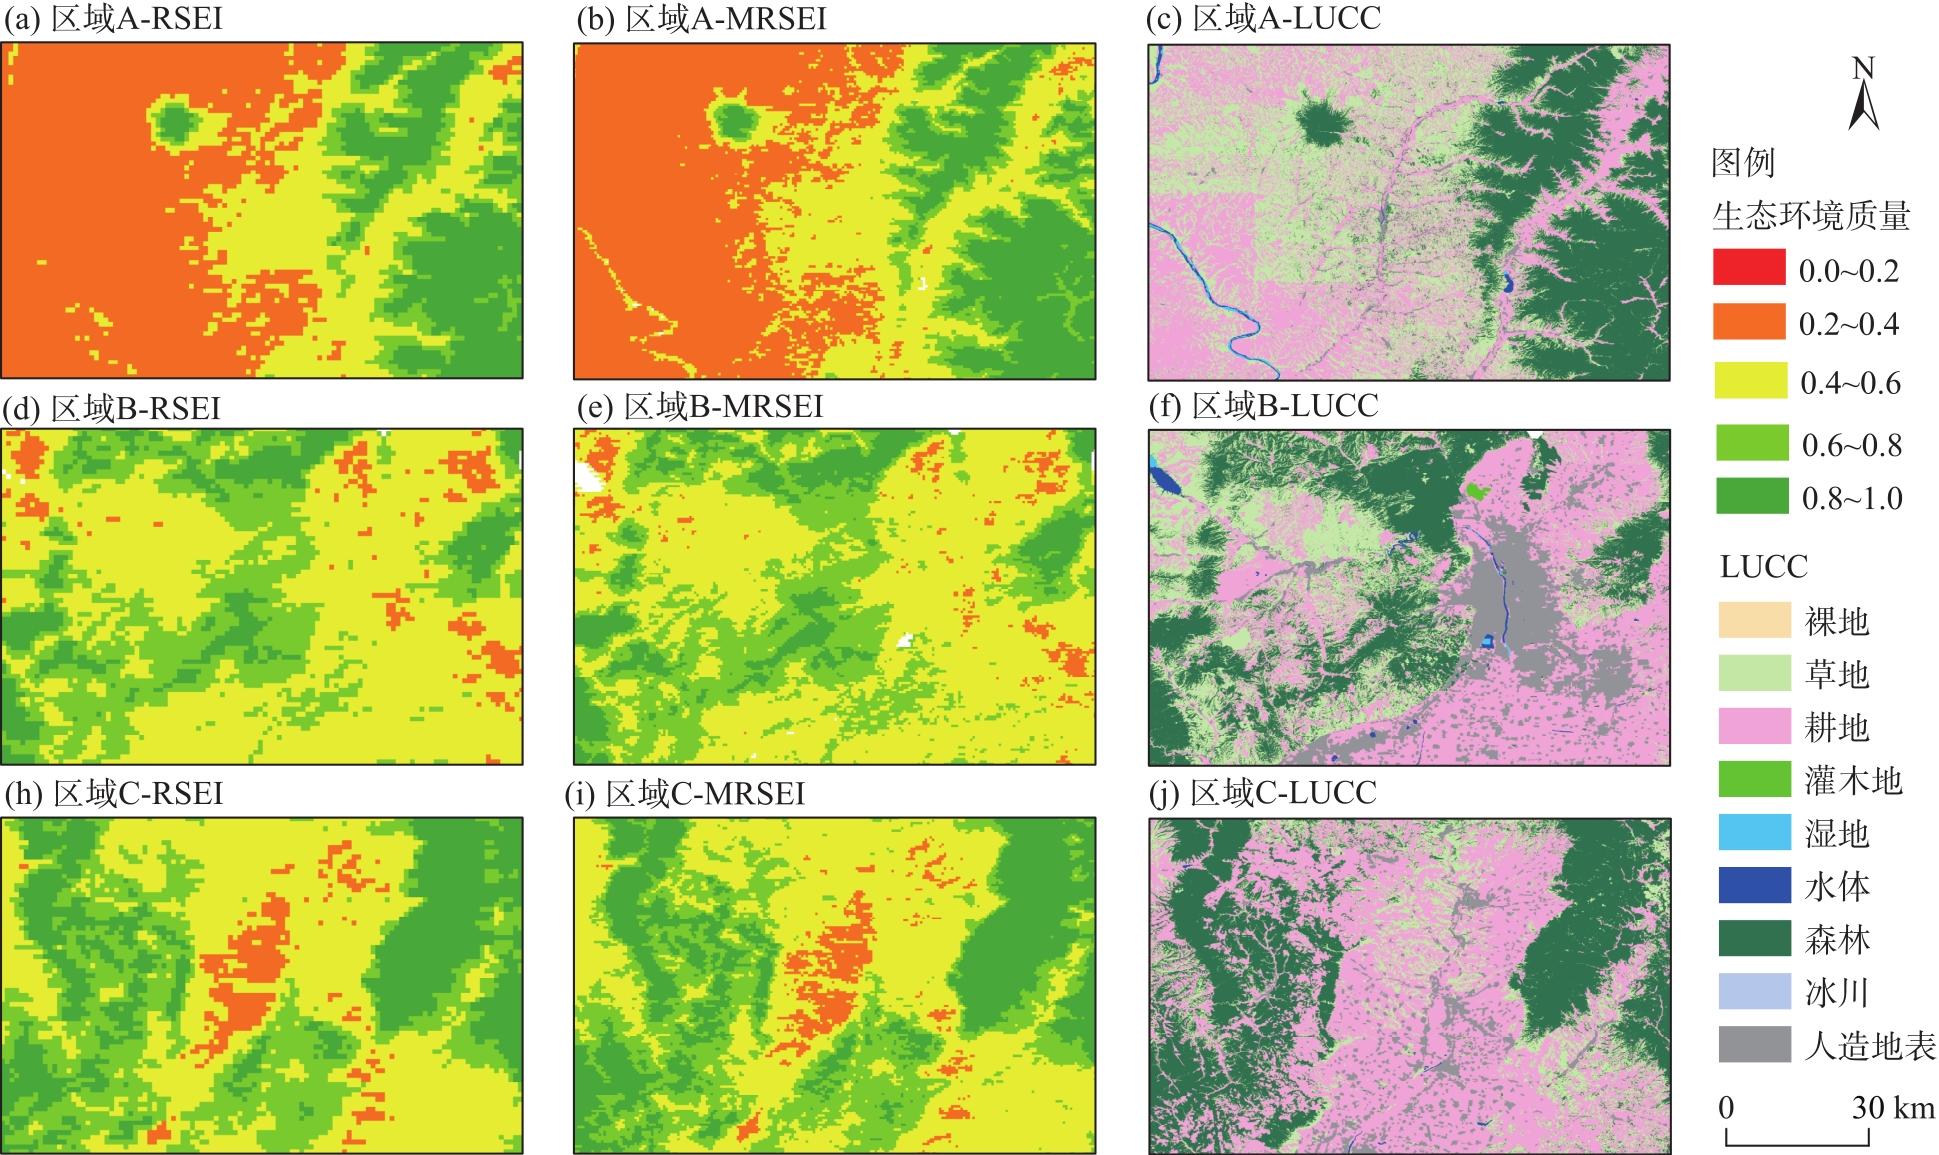
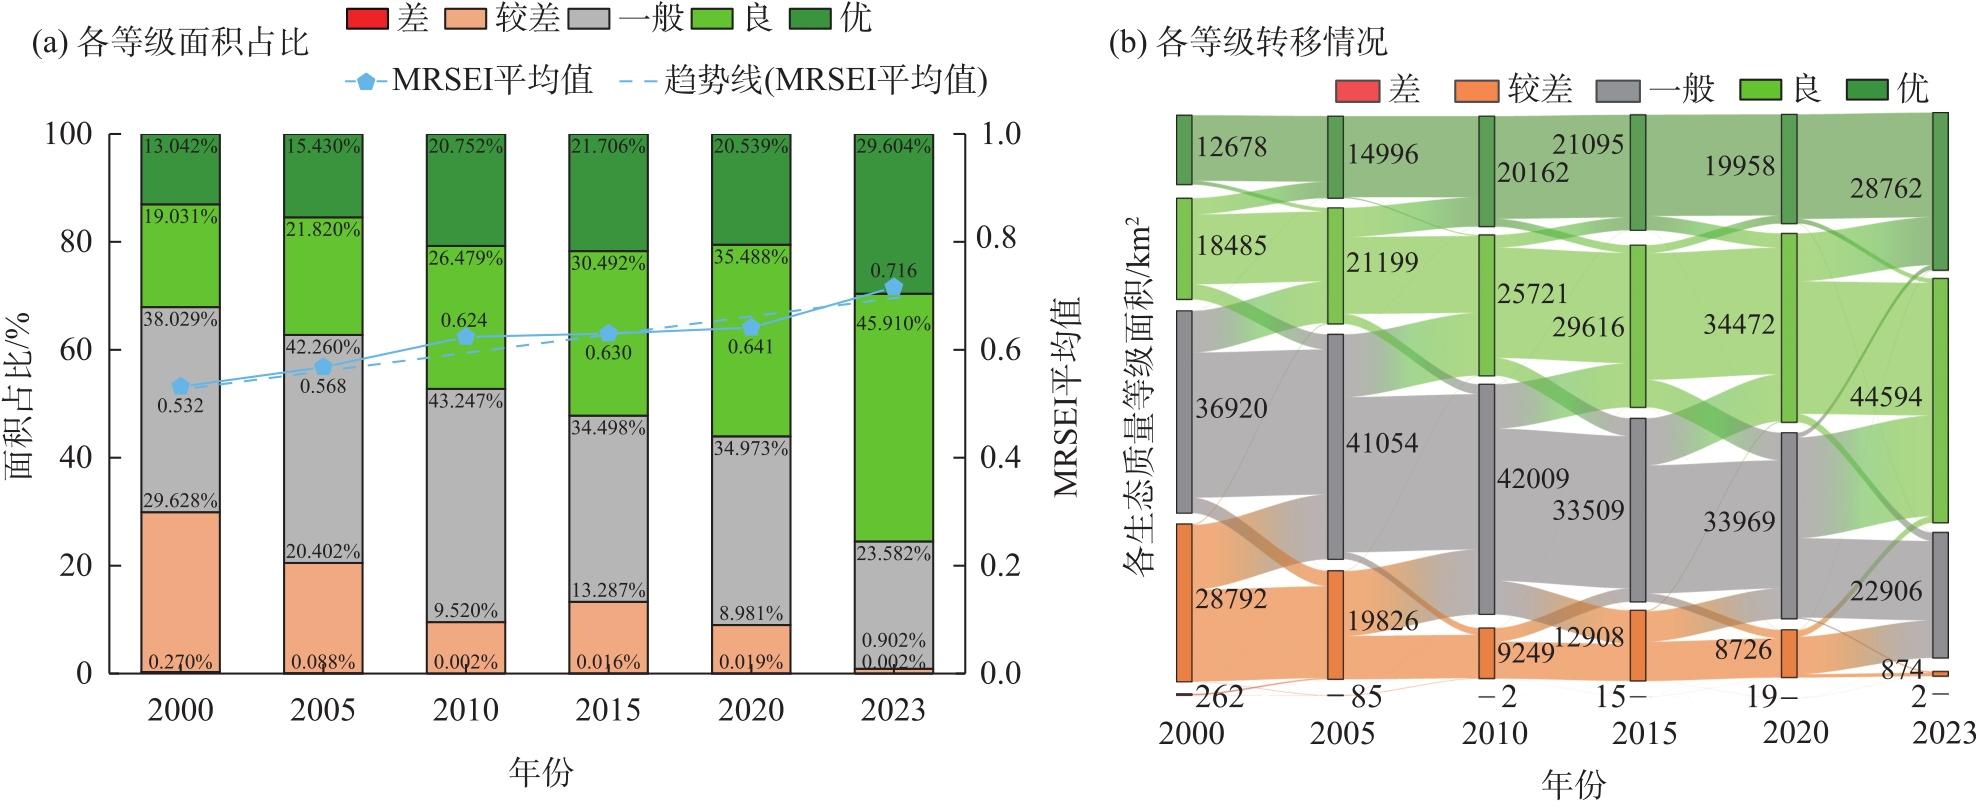
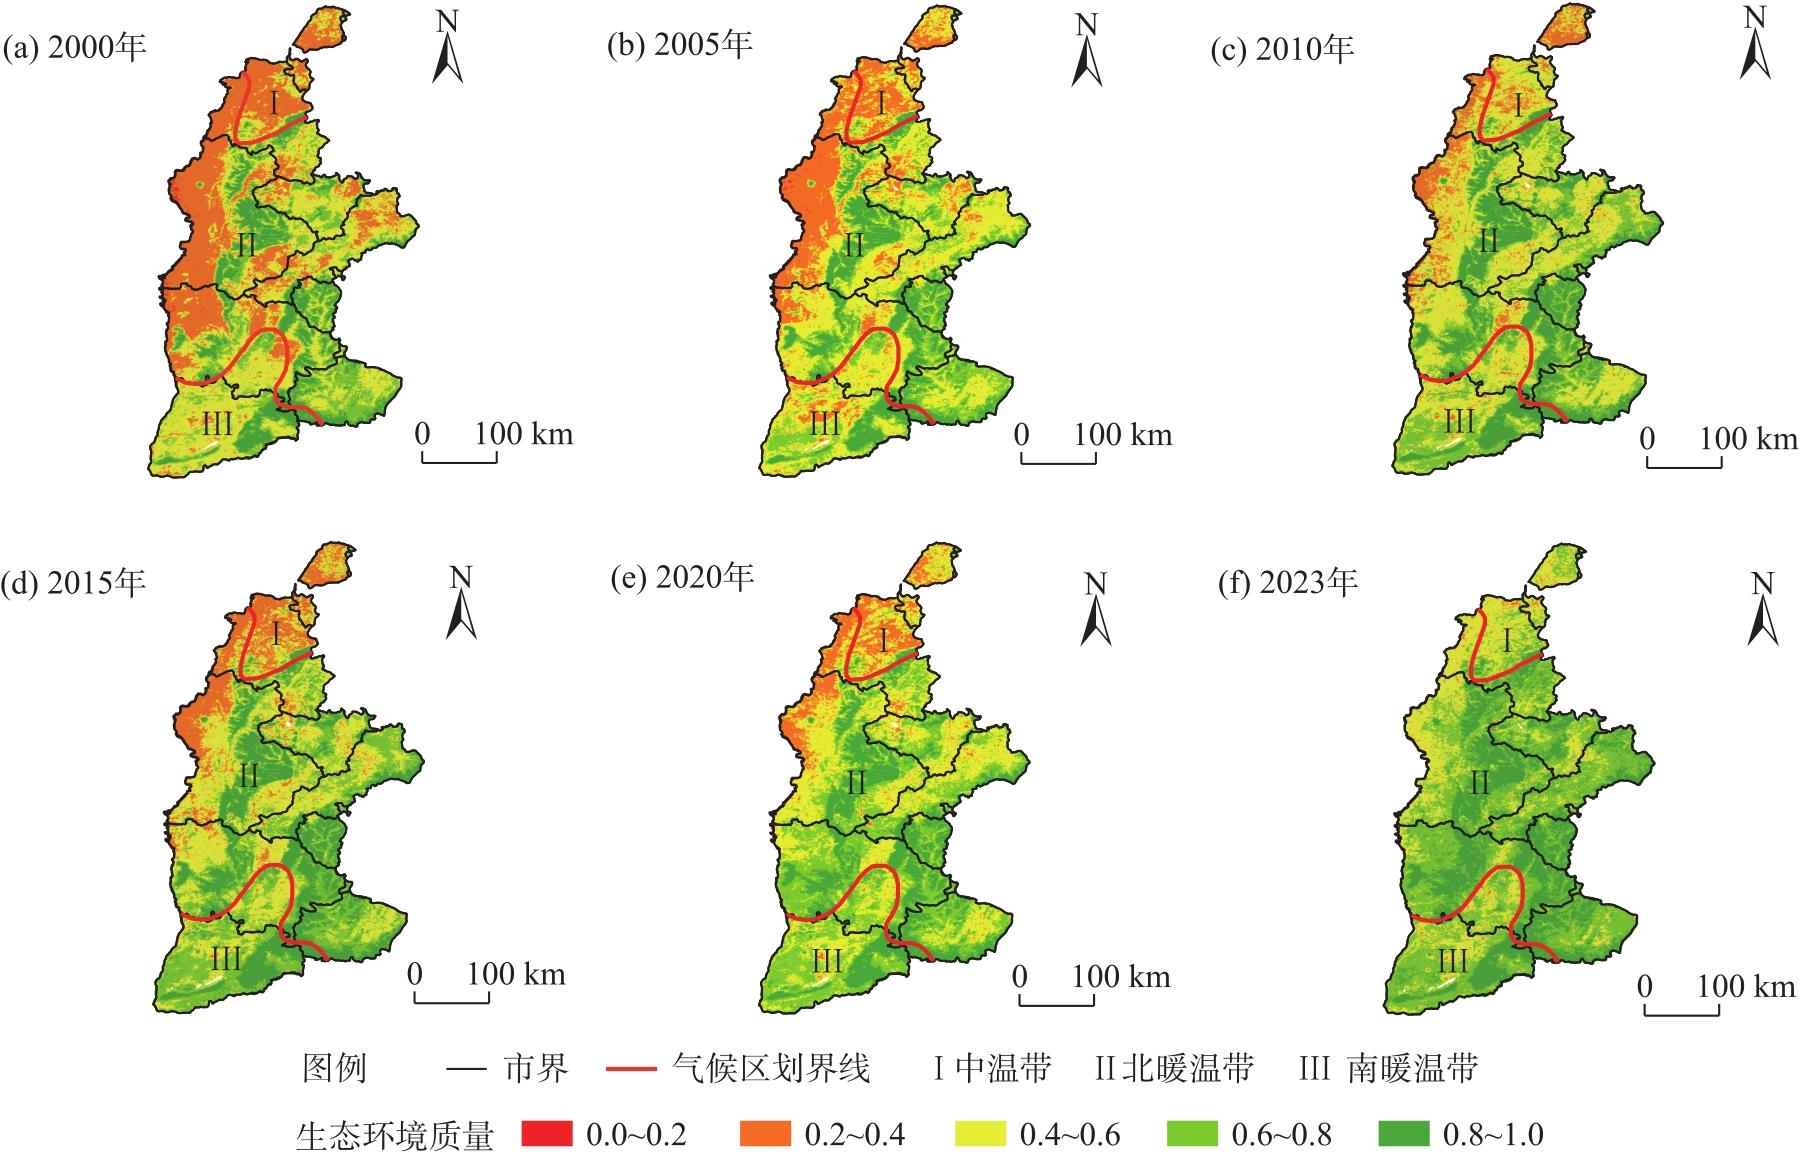
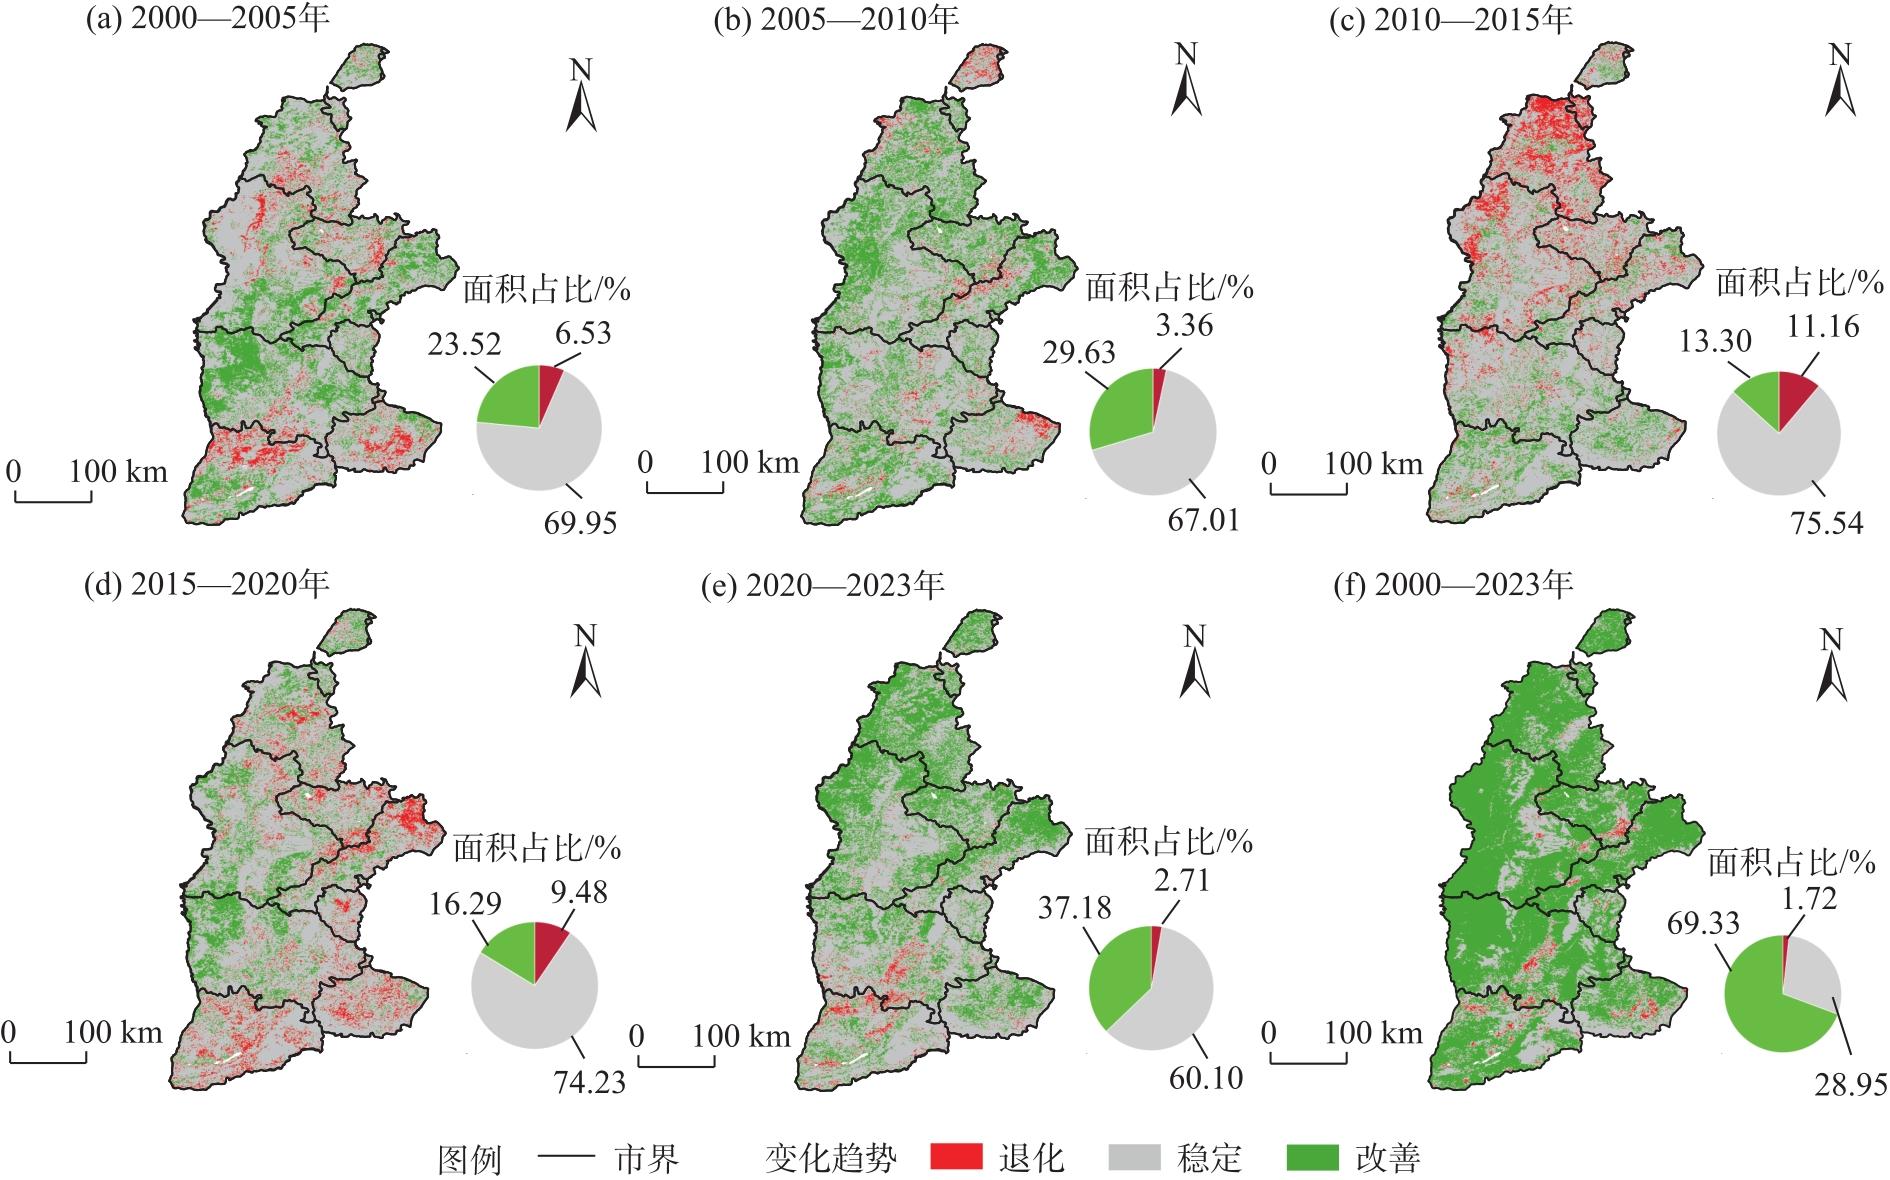
Based on the Google Earth Engine (GEE) platform, this study coupled aerosol optical depth with the remote sensing ecological index to construct a modified remote sensing ecological index (MRSEI) for comprehensively evaluating the spatiotemporal variation and driving mechanisms of ecological environment quality in the Shanxi section of the Yellow River Basin, China, from 2000 to 2023. The results show that: (1) MRSEI substantially improved the accuracy of ecological environment quality assessment, with stronger texture features and better detail representation. (2) From 2000 to 2023, ecological environment quality in the study area improved overall. Most areas were classified as general or good, with only a small proportion at poor levels. Spatially, MRSEI indicated a low-high gradient from northwest to southeast. The western part of Lüliang City exhibited the poorest ecological quality, with unfavorable conditions also observed in Datong City, Shuozhou City, and Xinzhou City. In contrast, Changzhi City, eastern Linfen City, parts of Jincheng City, and eastern Yuncheng City showed the best conditions. (3) Land use type exerted the greatest influence on ecological environment quality, followed by annual precipitation, slope, and elevation. Interactions among factors were significantly enhanced, particularly between land use type and other variables. This study provides a scientific basis for ecological environment protection and sustainable development in the Shanxi section of the Yellow River Basin.
Yin ZHANG , Congjian SUN , Geng LIU , Jinlong CHAO , Tianwei GENG , Honghong LIU . Spatiotemporal changes and driving factors of ecological environment quality in the Shanxi section of the Yellow River Basin from 2000 to 2023[J]. Arid Land Geography, 2025 , 48(11) : 1983 -1994 . DOI: 10.12118/j.issn.1000-6060.2025.221
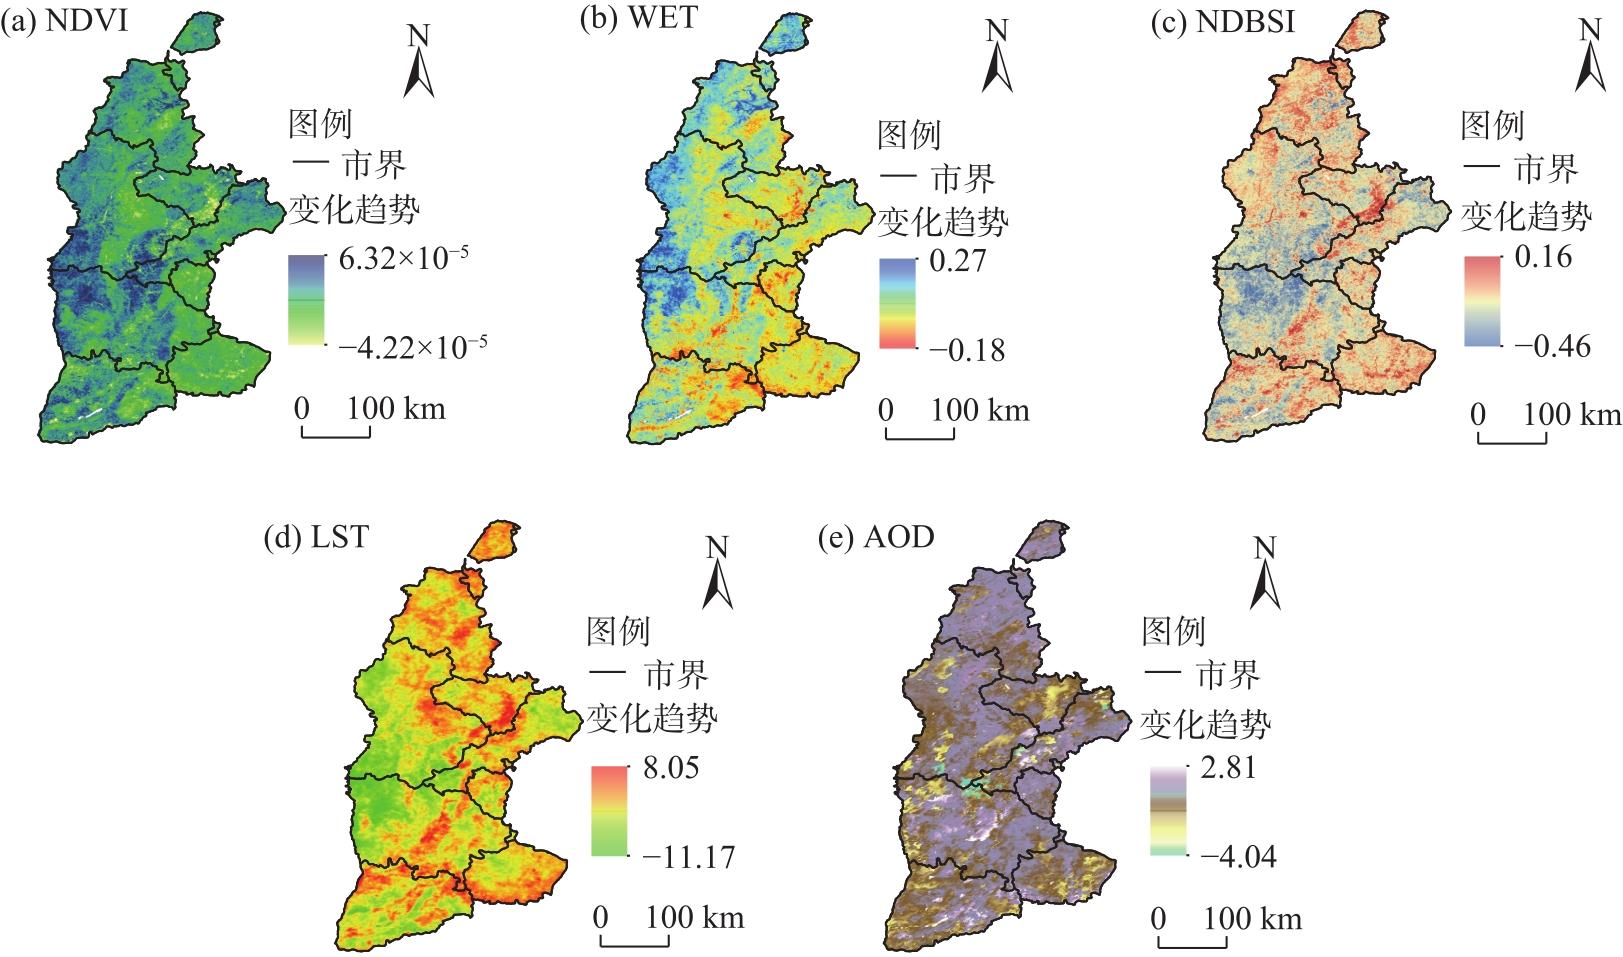
表1 2000—2023年改进型遥感生态指数(MRSEI)与5个生态因子的相关性分析Tab. 1 Correlation analysis between MRSEI and five ecological factors from 2000 to 2023 |
| 年份 | NDVI | WET | NDBSI | LST | AOD | 平均相关度 |
|---|---|---|---|---|---|---|
| 2000 | 0.971** | 0.898** | -0.961** | -0.816** | -0.213** | 0.772** |
| 2005 | 0.856** | 0.972** | -0.969** | -0.814** | -0.201** | 0.762** |
| 2010 | 0.963** | 0.882** | -0.958** | -0.785** | -0.149** | 0.747** |
| 2015 | 0.967** | 0.896** | -0.961** | -0.757** | -0.231** | 0.762** |
| 2020 | 0.963** | 0.882** | -0.944** | -0.750** | -0.213** | 0.750** |
| 2023 | 0.967** | 0.891** | -0.959** | -0.712** | -0.084** | 0.723** |
| 相关系数均值 | 0.948** | 0.904** | -0.959** | -0.772** | -0.182** | 0.753** |
注:NDVI、WET、NDBSI、LST、AOD分别为归一化植被指数、湿度指数、干度指数、地表温度、气溶胶光学厚度;**表示相关性在0.01水平上显著。 |
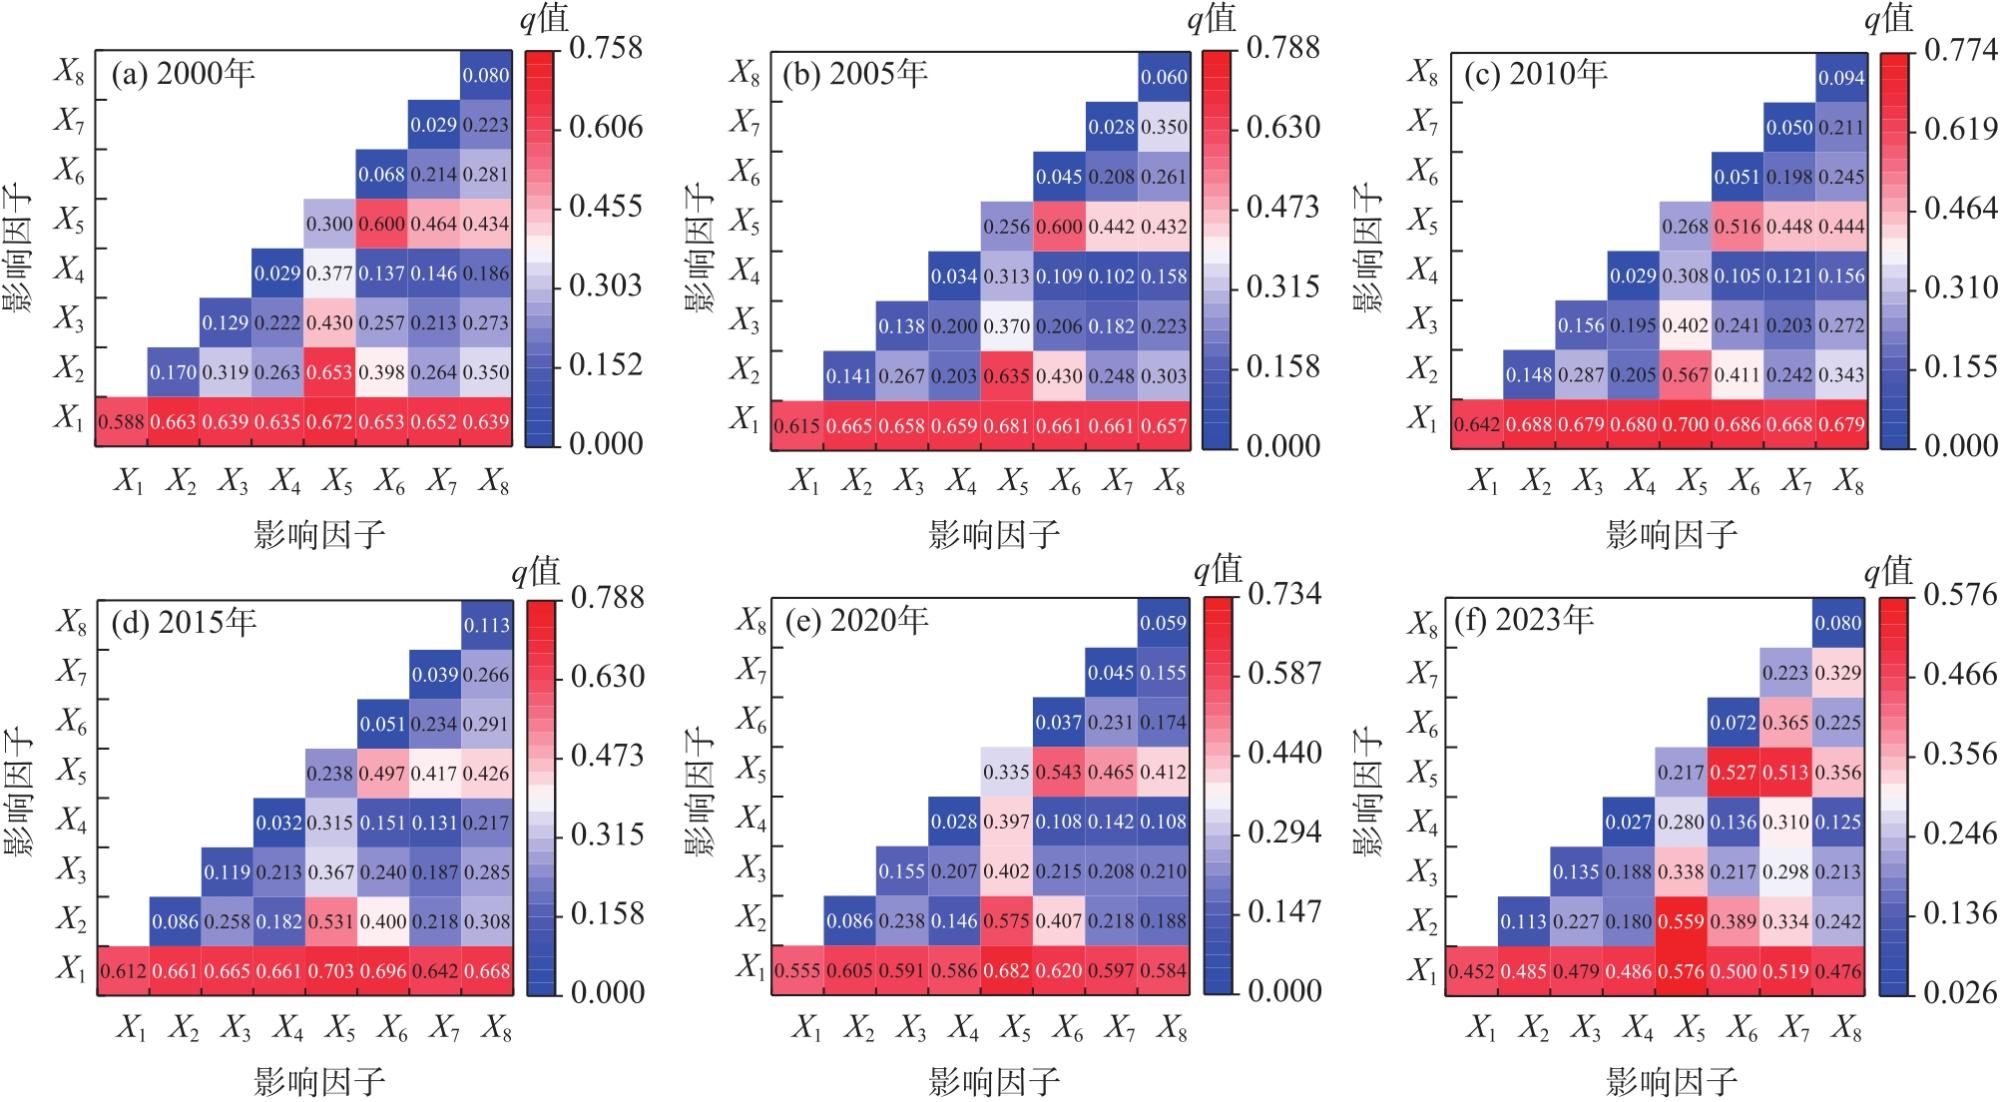
表2 2000—2023年因子探测结果Tab. 2 Factor detection results from 2000 to 2023 |
| 驱动因素 | 2000年 | 2005年 | 2010年 | 2015年 | 2020年 | 2023年 | 2000—2023年均值 | |||||||||||||
|---|---|---|---|---|---|---|---|---|---|---|---|---|---|---|---|---|---|---|---|---|
| q值 | 排序 | q值 | 排序 | q值 | 排序 | q值 | 排序 | q值 | 排序 | q值 | 排序 | q值 | 排序 | |||||||
| LUCC | 0.588 | 1 | 0.615 | 1 | 0.642 | 1 | 0.612 | 1 | 0.555 | 1 | 0.452 | 1 | 0.577 | 1 | ||||||
| 高程 | 0.170 | 3 | 0.141 | 3 | 0.148 | 4 | 0.086 | 5 | 0.086 | 4 | 0.113 | 5 | 0.124 | 4 | ||||||
| 坡度 | 0.129 | 4 | 0.138 | 4 | 0.156 | 3 | 0.119 | 3 | 0.155 | 3 | 0.135 | 4 | 0.139 | 3 | ||||||
| 坡向 | 0.029 | 7 | 0.034 | 7 | 0.029 | 8 | 0.032 | 8 | 0.028 | 8 | 0.027 | 8 | 0.030 | 8 | ||||||
| 年降水量 | 0.300 | 2 | 0.256 | 2 | 0.268 | 2 | 0.238 | 2 | 0.335 | 2 | 0.217 | 3 | 0.269 | 2 | ||||||
| 年均气温 | 0.068 | 6 | 0.045 | 6 | 0.051 | 6 | 0.051 | 6 | 0.037 | 7 | 0.072 | 6 | 0.054 | 7 | ||||||
| 人口密度 | 0.029 | 8 | 0.028 | 8 | 0.050 | 7 | 0.039 | 7 | 0.045 | 6 | 0.223 | 2 | 0.069 | 6 | ||||||
| GDP | 0.080 | 5 | 0.060 | 5 | 0.094 | 5 | 0.113 | 4 | 0.059 | 5 | 0.080 | 7 | 0.081 | 5 | ||||||
注:LUCC为土地利用类型;q为各影响因子对生态环境质量的影响力。 |
| [1] |
IPCC. Climate change 2021: The physical science basis[M/OL]. Cambridge: Cambridge University Press, 2021.
|
| [2] |
陶健, 林昱辰, 王冰鑫, 等. 黄河流域生态环境脆弱性时空特征[J]. 生态学杂志, 2025, 44(9): 3054-3064.
[
|
| [3] |
杨永春, 穆焱杰, 张薇. 黄河流域高质量发展的基本条件与核心策略[J]. 资源科学, 2020, 42(3): 409-423.
[
|
| [4] |
|
| [5] |
徐涵秋. 城市遥感生态指数的创建及其应用[J]. 生态学报, 2013, 33(24): 7853-7862.
[
|
| [6] |
郑彩之, 边振, 桑国庆. 基于遥感生态指数的济南市生态环境质量动态监测[J]. 生态科学, 2024, 43(5): 175-182.
[
|
| [7] |
|
| [8] |
|
| [9] |
|
| [10] |
陈宜欣, 宁晓刚, 张翰超, 等. 遥感生态指数(RSEI)模型及应用综述[J]. 自然资源遥感, 2024, 36(3): 28-40.
[
|
| [11] |
李艺霖, 赵先超. 长株潭城市群生态环境与城镇化时空耦合协调关系——基于遥感生态指数和夜间灯光指数[J]. 地球科学与环境学报, 2024, 46(3): 307-320.
[
|
| [12] |
杨羽佳, 张怡, 匡天琪, 等. 利用改进城市遥感生态指数的苏州市生态分析[J]. 测绘科学技术学报, 2021, 38(3): 323-330.
[
|
| [13] |
|
| [14] |
王雁, 郭伟, 闫世明, 等. 山西省气溶胶光学厚度时空变化特征及气候效应分析[J]. 生态环境学报, 2018, 27(5): 900-907.
[
|
| [15] |
于志翔, 李霞, 于晓晶, 等. 2003—2019年新疆气溶胶光学厚度时空变化特征[J]. 干旱区地理, 2022, 45(2): 346-358.
[
|
| [16] |
|
| [17] |
|
| [18] |
李豪, 张蕾, 梁晓磊, 等. 基于GeoSOM网络的生态修复分区——以黄河流域山西段为例[J]. 干旱区研究, 2025, 42(2): 321-332.
[
|
| [19] |
张伟, 杜培军, 郭山川, 等. 改进型遥感生态指数及干旱区生态环境评价[J]. 遥感学报, 2023, 27(2): 299-317.
[
|
| [20] |
陈彦光. 基于Moran统计量的空间自相关理论发展和方法改进[J]. 地理研究, 2009, 28(6): 1449-1463.
[
|
| [21] |
张若婧, 陈跃红, 张晓祥, 等. 基于参数最优地理探测器的江西省山洪灾害时空格局与驱动力研究[J]. 地理与地理信息科学, 2021, 37(4): 72-80.
[
|
| [22] |
侯亚鹏, 龙斌, 刘高, 等. 渭河流域(甘肃段)生态环境质量时空演变[J]. 环境生态学, 2024, 6(5): 19-26.
[
|
| [23] |
岳奕帆, 赵文智, 刘任涛, 等. 宁夏荒漠草原带生态环境质量时空变化及其驱动机制[J]. 生态学报, 2024, 44(20): 9067-9080.
[
|
| [24] |
刘伟, 凌红波, 公延明, 等. 基于改进型遥感生态指数的塔里木河干流生态环境质量评价[J]. 干旱区地理, 2025, 48(2): 271-282.
[
|
| [25] |
李朋轩, 王德应, 王涛. 黄河流域近20多年来植被生态环境质量季节特征及其对干湿变化的响应[J]. 水土保持研究, 2025, 32(5): 174-182.
[
|
| [26] |
刘佳琪, 周璐红, 席小雅. 2000—2020年黄河流域土地生态质量及其变化趋势预测[J]. 干旱区地理, 2023, 46(10): 1654-1662.
[
|
| [27] |
李朋轩, 王涛, 王德应, 等. 黄河流域生态环境质量对气候变化的响应及其与水沙变化的关系[J]. 测绘通报, 2025(1): 59-65.
[
|
/
| 〈 |
|
〉 |