
Research on the impact of civil aviation opening on tourism economy in Xinjiang
Received date: 2024-12-03
Revised date: 2025-04-17
Online published: 2026-03-11
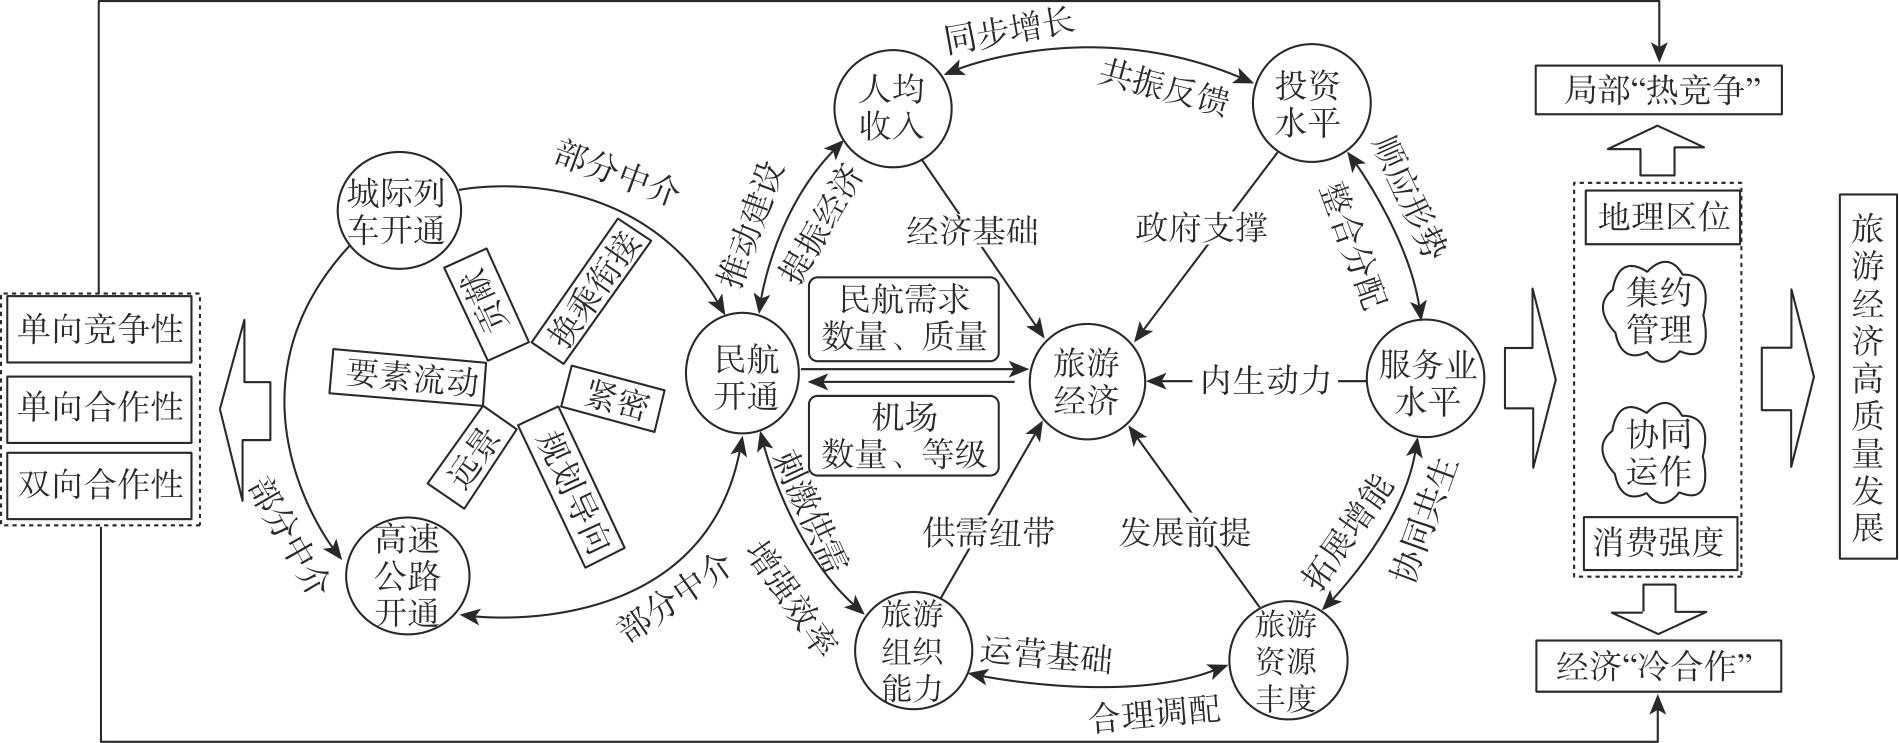
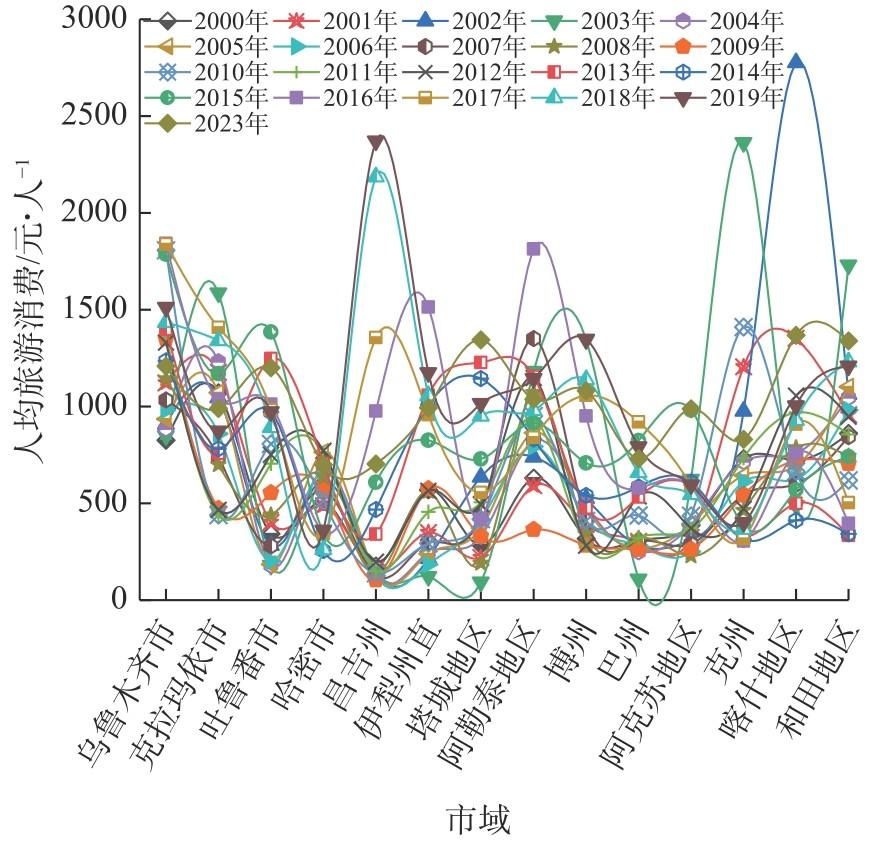
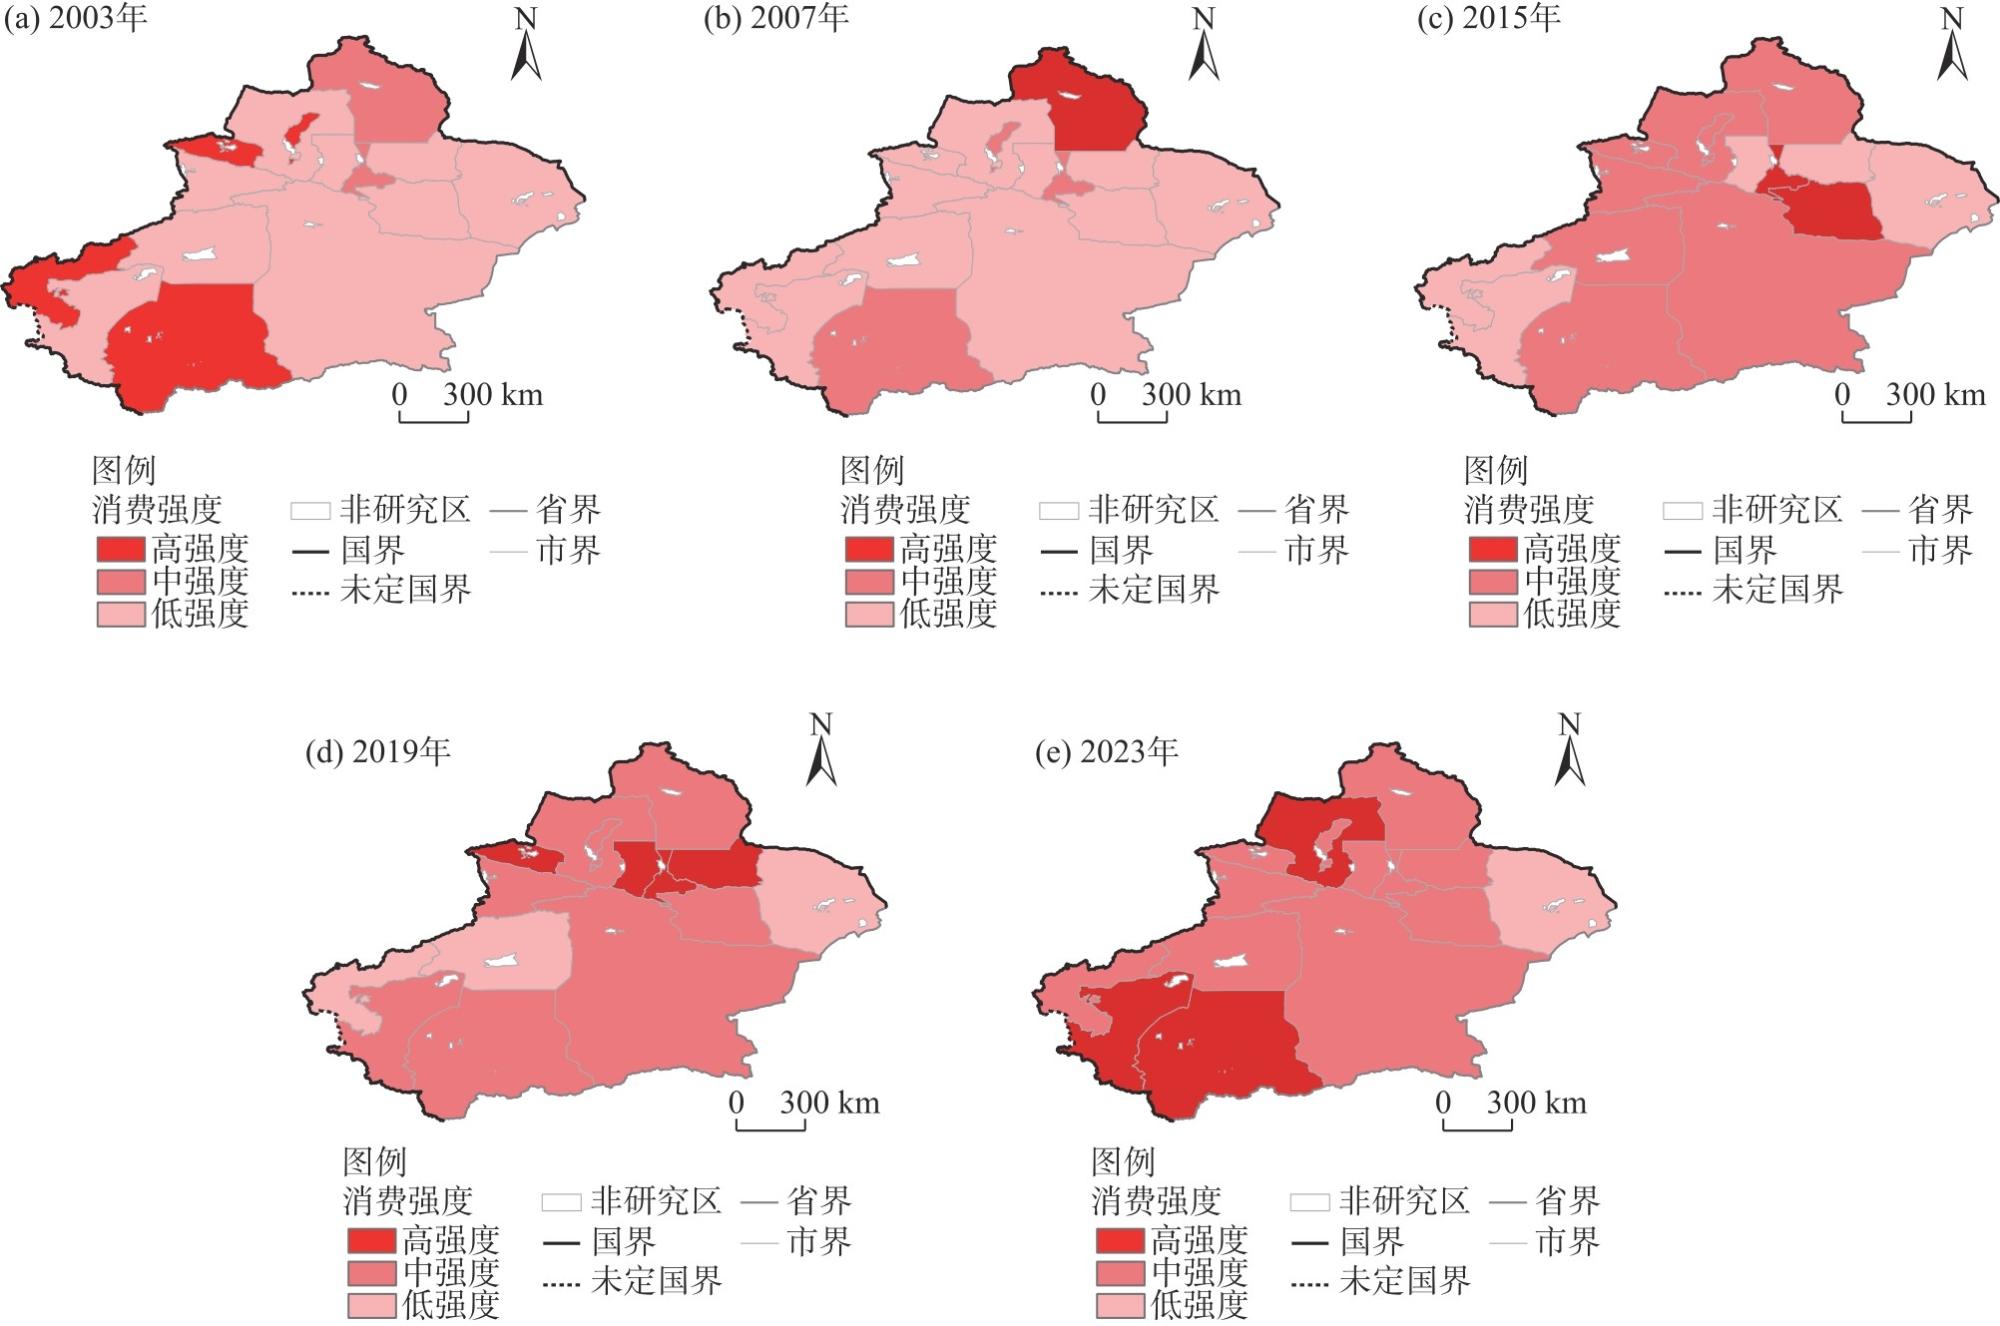
Using city panel data from Xinjiang, China, this paper summarizes the civil aviation opening to the regional tourism economy. It uses a multi-period difference-in-differences (DID) model and mediation effect model to analyze the direct and moderating effects of the civil aviation opening on the tourism economy in Xinjiang. It also examines the mediating effect of the combination of different modes of rapid transportation on tourism economy in Xinjiang. The study finds that: (1) In the driving mechanism of civil aviation opening on the regional tourism economy, the construction of civil aviation facilities and the demand for civil aviation tourism are external pull forces and internal push forces affecting the tourism economy. (2) Xinjiang's tourism economy shows an evolutionary trend of high growth and high volatility and an evolution pattern of edge multi-point aggregation→central aggregation diffusion. (3) The opening of civil aviation effectively reduces travel time costs, positively and significantly impacting Xinjiang's tourism economy, with the validation model passing a series of robustness tests. (4) The moderating effects of the quantity and quality of civil aviation tourism demand on the tourism economy of southern and northern Xinjiang have obvious differences, and the heterogeneous impact effects of the civil aviation opening on tourism economy in southern and northern Xinjiang and the different consumption-intensity city regions are significantly different. (5) The combination of different rapid transportation modes has complex mediating effects and exhibits multiple competition and cooperation relationships in terms of the tourism economy of Xinjiang.
Yang BAI , Ping ZHAO , Jian WU , Xiaoyan LIU . Research on the impact of civil aviation opening on tourism economy in Xinjiang[J]. Arid Land Geography, 2025 , 48(10) : 1866 -1877 . DOI: 10.12118/j.issn.1000-6060.2024.744
表1 变量描述性统计Tab. 1 Descriptive statistics of variables |
| 变量 | 样本量 | 均值 | 标准差 | 最小值 | 最大值 | 变量 | 样本量 | 均值 | 标准差 | 最小值 | 最大值 |
|---|---|---|---|---|---|---|---|---|---|---|---|
| PTC | 294 | 6.392 | 0.660 | 4.540 | 7.930 | pgdp | 294 | 9.686 | 1.030 | 7.390 | 11.910 |
| 294 | 0.575 | 0.495 | 0.000 | 1.000 | inv | 294 | 4.985 | 1.395 | 0.900 | 7.660 | |
| 294 | 0.136 | 0.343 | 0.000 | 1.000 | ser | 294 | 3.581 | 0.394 | 2.150 | 4.290 | |
| 294 | 0.337 | 0.473 | 0.000 | 1.000 | dtr | 294 | 4.057 | 1.773 | -2.300 | 6.650 | |
| FS | 294 | 12.509 | 29.972 | 0.000 | 178.230 | toa | 294 | 1.541 | 1.841 | -2.300 | 6.330 |
| APT | 294 | 109.369 | 359.585 | 0.000 | 2508.900 | - | - | - | - | - | - |
注:PTC、 、 、 、FS、APT分别为旅游经济、民航开通、城际列车开通、高速公路开通、民航需求数量、民航需求质量;pgdp、inv、ser、dtr、toa分别为人均收入、投资水平、服务业水平、旅游资源丰度、旅游组织能力。下同。 |
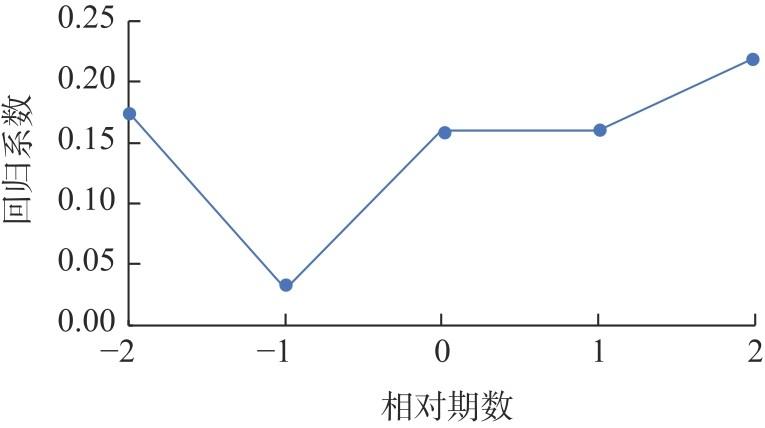
表2 平行趋势检验Tab. 2 Parallel trend tests |
| 变量 | 前2期 | 前1期 | 后3期 | 后4期 | 控制变量 | 时间固定效应 | 地区固定效应 | 观测值 | R2 |
|---|---|---|---|---|---|---|---|---|---|
| PTC | 0.142(0.100) | 0.043(0.150) | 0.101**(0.050) | 0.232**(0.080) | 是 | 是 | 否 | 294 | 0.402 |
注:***、**、*分别表示在1%、5%和10%水平上显著;R2为拟合优度;括号内数值为稳健标准误差。下同。 |
表3 基准回归结果Tab. 3 Benchmark regression results |
| 变量 | PTC | ||||
|---|---|---|---|---|---|
| 回归1 | 回归2 | 回归3 | 回归4 | 回归5 | |
| 0.482***(0.060) | 0.340***(0.090) | 0.299***(0.080) | 0.102(0.080) | 0.107(0.080) | |
| pgdp | - | 0.166***(0.040) | 0.114**(0.050) | 0.176(0.190) | 0.373*(0.180) |
| inv | - | -0.182**(0.070) | -0.310***(0.100) | -0.244(0.170) | -0.086(0.130) |
| ser | - | 0.548***(0.090) | 0.347***(0.070) | 0.338(0.300) | 0.729***(0.170) |
| dtr | - | -0.089***(0.030) | -0.093***(0.030) | -0.089**(0.030) | -0.083**(0.030) |
| toa | - | 0.190***(0.030) | 0.241***(0.030) | 0.071*(0.040) | 0.073(0.050) |
| 常数项 | 6.115***(0.070) | 3.608***(0.540) | 5.945***(0.680) | 5.875**(2.690) | 0.924(1.650) |
| 时间固定效应 | 否 | 否 | 是 | 是 | 否 |
| 地区固定效应 | 否 | 否 | 否 | 是 | 是 |
| 观测值 | 294 | 294 | 294 | 294 | 294 |
| R2 | 0.131 | 0.340 | 0.419 | 0.503 | 0.462 |
表4 稳健性检验回归结果Tab. 4 Regression results of robustness tests |
| 变量 | PTC | |||
|---|---|---|---|---|
| 回归6 | 回归7 | 回归8 | 回归9 | |
| DTCA_1 | 0.502***(0.070) | 0.331*** (0.090) | - | - |
| DTCA_2 | - | - | 0.438*** (0.060) | 0.284*** (0.080) |
| 控制变量 | 否 | 是 | 否 | 是 |
| 常数项 | 6.257*** (0.000) | 5.834*** (0.660) | 6.331*** (0.000) | 6.030*** (0.680) |
| 时间固定效应 | 是 | 是 | 是 | 是 |
| 地区固定效应 | 否 | 否 | 否 | 否 |
| 观测值 | 294 | 294 | 294 | 294 |
| R2 | 0.233 | 0.424 | 0.212 | 0.416 |
注:DTCA_1、DTCA_2分别为当年民航开通和滞后1期民航开通。 |
表5 异质性分析Tab. 5 Heterogeneity analysis |
| 变量 | PTC | ||||
|---|---|---|---|---|---|
| 回归10 南疆 | 回归11 北疆 | 回归12 高 | 回归13 中 | 回归14 低 | |
| 0.626*** (0.190) | -0.332** (0.130) | -0.446*** (0.150) | 0.619* (0.310) | -0.382 (0.230) | |
| 控制变量 | 是 | 是 | 是 | 是 | 是 |
| 常数项 | 15.959** (7.380) | 0.000 (0.000) | 11.649** (5.330) | 0.000 (0.000) | 0.000 (0.000) |
| 时间固定效应 | 是 | 是 | 是 | 是 | 是 |
| 地区固定效应 | 是 | 是 | 是 | 是 | 是 |
| 观测值 | 105 | 189 | 105 | 84 | 105 |
| R2 | 0.646 | 0.596 | 0.490 | 0.579 | 0.600 |
表6 调节效应分析Tab. 6 Moderating effect analysis |
| 变量 | PTC | |||||||||
|---|---|---|---|---|---|---|---|---|---|---|
| 回归15 南疆 | 回归16 南疆 | 回归17 北疆 | 回归18 北疆 | 回归19 高 | 回归20 高 | 回归21 中 | 回归22 中 | 回归23 低 | 回归24 低 | |
| 0.490**(0.210) | 0.497**(0.220) | -0.346**(0.150) | -0.381**(0.170) | -0.381**(0.140) | -0.396**(0.160) | 0.275(0.340) | 0.630*(0.310) | -0.233(0.240) | -0.170(0.240) | |
| 0.021* (0.010) | - | -0.003*(0.000) | - | 0.003 (0.000) | - | 0.020**(0.010) | - | -0.025(0.020) | - | |
| - | 0.002(0.000) | - | -0.000*(0.000) | - | 0.000(0.000) | - | 0.006**(0.000) | - | -0.005**(0.000) | |
| 控制变量 | 是 | 是 | 是 | 是 | 是 | 是 | 是 | 是 | 是 | 是 |
| 常数项 | 17.344**(7.370) | 17.954**(7.260) | 0.000 (0.000) | 0.000(0.000) | 12.846**(5.940) | 12.368**(5.780) | 1.083(2.920) | 0.000(0.000) | 0.000(0.000) | 0.000(0.000) |
| 时间固定效应 | 是 | 是 | 是 | 是 | 是 | 是 | 是 | 是 | 是 | 是 |
| 地区固定效应 | 是 | 是 | 是 | 是 | 是 | 是 | 是 | 是 | 是 | 是 |
| 观测值 | 105 | 105 | 189 | 189 | 105 | 105 | 84 | 84 | 105 | 105 |
| R2 | 0.659 | 0.658 | 0.602 | 0.602 | 0.504 | 0.495 | 0.630 | 0.607 | 0.617 | 0.633 |
表7 不同快速交通方式组合的中介效应分析Tab. 7 Analysis of the mediating effects of different combinations of rapid transit modes |
| 交通方式 | 变量 | 控制变量 | 常数项 | 观测值 | R2 | ||||
|---|---|---|---|---|---|---|---|---|---|
| 民航与城际列车 | 回归25 | PTC | 0.340***(-0.090) | - | - | 是 | 3.608***(-0.540) | 294 | 0.340 |
| 回归26 | 0.110*(-0.060) | - | - | 是 | -2.190***(-0.570) | 294 | 0.273 | ||
| 回归27 | PTC | 0.328***(-0.090) | - | 0.110(-0.130) | 是 | 3.848***(-0.600) | 294 | 0.343 | |
| 回归28 | PTC | - | - | 0.164(-0.130) | 是 | 4.084***(-0.660) | 294 | 0.311 | |
| 回归29 | - | - | 0.166***(-0.040) | 是 | 0.719(-0.690) | 294 | 0.472 | ||
| 回归30 | PTC | 0.328***(-0.090) | - | 0.110(-0.130) | 是 | 3.848***(-0.600) | 294 | 0.343 | |
| 民航与高速公路 | 回归31 | PTC | 0.340***(-0.090) | - | - | 是 | 3.608***(-0.540) | 294 | 0.340 |
| 回归32 | 0.106**(-0.050) | - | - | 是 | -3.047***(-0.730) | 294 | 0.426 | ||
| 回归33 | PTC | 0.311***(-0.090) | 0.270**(-0.120) | - | 是 | 4.430***(-0.520) | 294 | 0.362 | |
| 回归34 | PTC | - | 0.303**(-0.120) | - | 是 | 4.643***(-0.530) | 294 | 0.333 | |
| 回归35 | - | 0.107***(-0.030) | - | 是 | 0.684(-0.710) | 294 | 0.469 | ||
| 回归36 | PTC | 0.311***(-0.090) | 0.270**(-0.120) | - | 是 | 4.430***(-0.520) | 294 | 0.362 | |
| 城际列车与高速公路 | 回归37 | PTC | - | - | 0.164(-0.130) | 是 | 4.084***(-0.660) | 294 | 0.311 |
| 回归38 | - | - | 0.400***(-0.120) | 是 | -2.148***(-0.710) | 294 | 0.482 | ||
| 回归39 | PTC | - | 0.290**(-0.120) | 0.048(-0.110) | 是 | 4.707***(-0.540) | 294 | 0.333 | |
| 回归40 | PTC | - | 0.303**(-0.120) | - | 是 | 4.643***(-0.530) | 294 | 0.333 | |
| 回归41 | - | 0.269***(-0.070) | - | 是 | -1.341**(-0.480) | 294 | 0.339 | ||
| 回归42 | PTC | - | 0.290**(-0.120) | 0.048(-0.110) | 是 | 4.707***(-0.540) | 294 | 0.333 | |
表8 不同快速交通方式的中介效应路径Tab. 8 Paths of mediating effects in rapid transits |
| 民航开通影响新疆旅游经济 | 城际列车开通影响新疆旅游经济 | 高速公路开通影响新疆旅游经济 |
|---|---|---|
| 城际列车开通(部分中介) β2(0.328***)<β0(0.340***) | 民航开通(遮掩效应) β2(0.110)<β0(0.164) | 民航开通(部分中介) β2(0.270**)<β0(0.303**) |
| 高速公路开通(部分中介) β2(0.311***)<β0(0.340***) | 高速公路开通(遮掩效应) β2(0.048)<β0(0.164) | 城际列车开通(部分中介) β2(0.290**)<β0(0.303**) |
注:β0、β2分别为不同快速交通方式(民航开通、城际列车开通、高速公路开通)影响新疆旅游经济的直接效应和中介效应。 |
| [1] |
张蕾, 孙伟, 宋彦. 世界级机场群航空网络时空演化特征与模式[J]. 地理学报, 2024, 79(6): 1540-1555.
[
|
| [2] |
张伟, 殷瑞阳, 战莹, 等. 西部地区民航运输与旅游业发展的互动关系[J]. 地理科学, 2023, 43(10): 1774-1782.
[
|
| [3] |
|
| [4] |
樊学秀, 刘文萍, 江可申. 民航运输对入境旅游经济的影响——基于异质性与空间溢出效应视角[J]. 干旱区地理, 2024, 47(6): 1026-1035.
[
|
| [5] |
|
| [6] |
|
| [7] |
|
| [8] |
姚瑞, 彭睿娟, 李勃昕. 互联网驱动、航空运输提升与区域旅游业发展——“十四五”期间提升旅游业发展的前瞻性分析[J]. 价格理论与实践, 2020(6): 60-63.
[
|
| [9] |
|
| [10] |
简海云, 潘海啸. 民用航空导向型城镇发展模式探究——以云南省为例[J]. 城市规划学刊, 2019(5): 77-84.
[
|
| [11] |
|
| [12] |
|
| [13] |
肖芸. 成都航空枢纽建设背景下四川入境旅游发展的思考[J]. 对外经贸实务, 2014(12): 87-89.
[
|
| [14] |
蔡鸿云, 明庆忠, 韩剑磊, 等. 中国城市航空交通关联网络对旅游经济发展的影响效应研究[J]. 人文地理, 2024, 39(1): 142-152.
[
|
| [15] |
刘书舟, 韩增林, 郭建科, 等. 高铁-民航空间竞合研究进展与展望[J]. 经济问题, 2024(10): 41-50.
[
|
| [16] |
高明蕾, 左袁丸. 高速铁路与航空运输竞争关系的研究[J]. 铁道运输与经济, 2016, 38(9): 35-38.
[
|
| [17] |
|
| [18] |
周国华, 陈德捷, 周芳汀, 等. 高速铁路与公路客运竞争的市场分担率模型研究[J]. 铁道学报, 2020, 42(1): 1-8.
[
|
| [19] |
孙枫, 汪德根, 牛玉. 高速铁路与汽车和航空的竞争格局分析[J]. 地理研究, 2017, 36(1): 171-187.
[
|
| [20] |
中国民用航空局. 2020年民航行业发展统计公报[EB/OL]. [2021-06-10]. http://www.caac.gov.cn/XXGK/XXGK/TJSJ/20210 6/t20210610_207915.html.
[Civil Aviation Administration of China. Statistical report on the development of civil aviation industry in 2020[EB/OL]. [2021-06-10]. http://www.caac.gov.cn/XXGK/XXGK/TJSJ/20210 6/t20210610_207915.html.]
|
| [21] |
于尚坤, 苗毅, 王成新, 等. 中国民航客运区位熵的时空特征与影响因素[J]. 经济地理, 2023, 43(3): 35-43.
[
|
| [22] |
卓丽洪, 李红昌, 鲍越. 高铁发展背景下民航价格弹性研究——基于中国449个城市面板数据的实证分析[J]. 价格理论与实践, 2021(10): 66-70.
[
|
| [23] |
石晓腾, 吴晋峰, 吴宝清, 等. 旅游交通方式比例结构跃迁现象与跃迁带模型——以国内旅游为例[J]. 经济地理, 2020, 40(2): 189-199.
[
|
| [24] |
骆嘉琪, 匡海波, 杨月, 等. 基于旅客出行视角的高铁民航竞争因素分析[J]. 管理评论, 2018, 30(11): 209-222.
[
|
| [25] |
白洋, 谭李娜, 刘晓燕, 等. 高铁开通对西北地区旅游经济的影响效应及其融合路径[J]. 干旱区地理, 2024, 47(12): 2124-2134.
[
|
| [26] |
温忠麟, 叶宝娟. 中介效应分析: 方法和模型发展[J]. 心理科学进展, 2014, 22(5): 731-745.
[
|
| [27] |
何芙蓉, 胡北明. “一带一路”倡议对我国沿线省份旅游高质量发展影响效应评估——基于DID模型的实证分析[J]. 经济体制改革, 2020(3): 46-52.
[
|
| [28] |
李建明, 王丹丹, 刘运材. 高速铁路网络建设推动中国城市产业结构升级了吗?[J]. 产业经济研究, 2020(3): 30-42.
[
|
| [29] |
王垚, 年猛. 高速铁路带动了区域经济发展吗?[J]. 上海经济研究, 2014(2): 82-91.
[
|
| [30] |
赵学彧, 杨家其, 彭亚美. 城市轨道交通与地面公交竞合关系演化机制[J]. 吉林大学学报(工学版), 2017, 47(3): 756-764.
[
|
/
| 〈 |
|
〉 |