Plant Ecology

Distribution characteristics and its influencing factors of surface soil pollen in the marginal monsoon region of China

  • Siqi WU , 1 ,
  • Haiqin WEI 2 ,
  • Chunzhu CHEN , 1 ,
  • Lisi WEI 1 ,
  • Wenwei ZHAO 1 ,
  • Huan LI 1 ,
  • Yi SUN 1 ,
  • Qingfeng JIANG 1 ,
  • Xiaojian ZHANG 3 ,
  • Yan ZHAO 4
Expand
  • 1. School of Geographic Science, Nantong University, Nantong 226019, Jiangsu, China
  • 2. Shanwang National Nature Reserve Management and Conservation Center at Linqu, Weifang 262617, Shandong, China
  • 3. School of Geography and Ocean Sciences, Nanjing University, Nanjing 210023, Jiangsu, China
  • 4. Institute of Geographic Sciences and Natural Resources Research, Chinese Academy of Sciences, Beijing 100101, Beijing, China

Received date: 2024-01-26

  Revised date: 2024-05-30

  Online published: 2026-03-11

Abstract

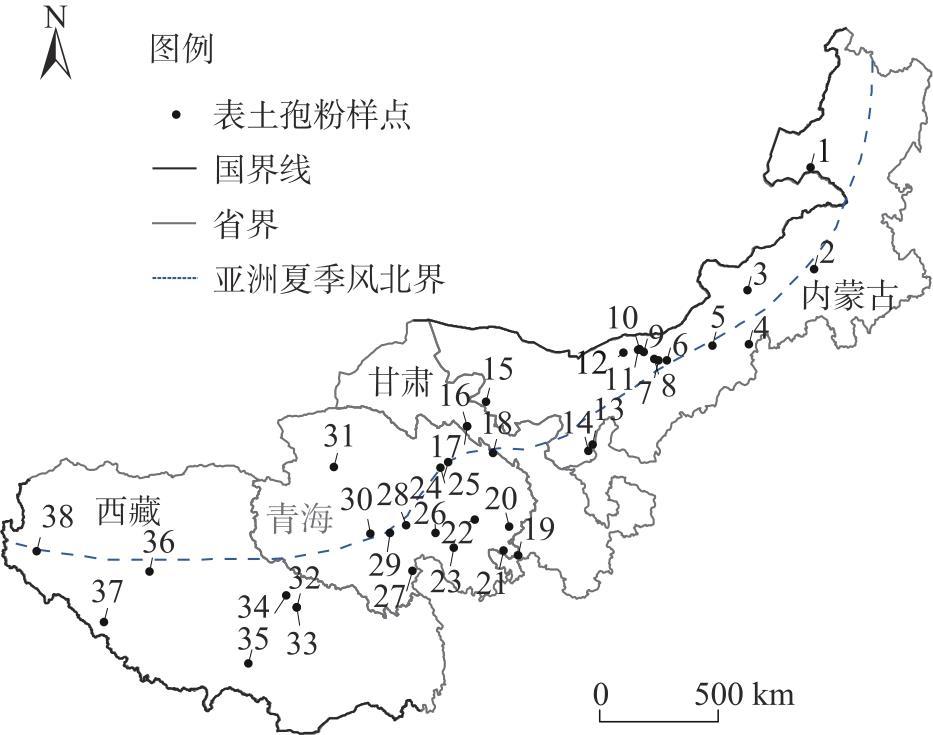
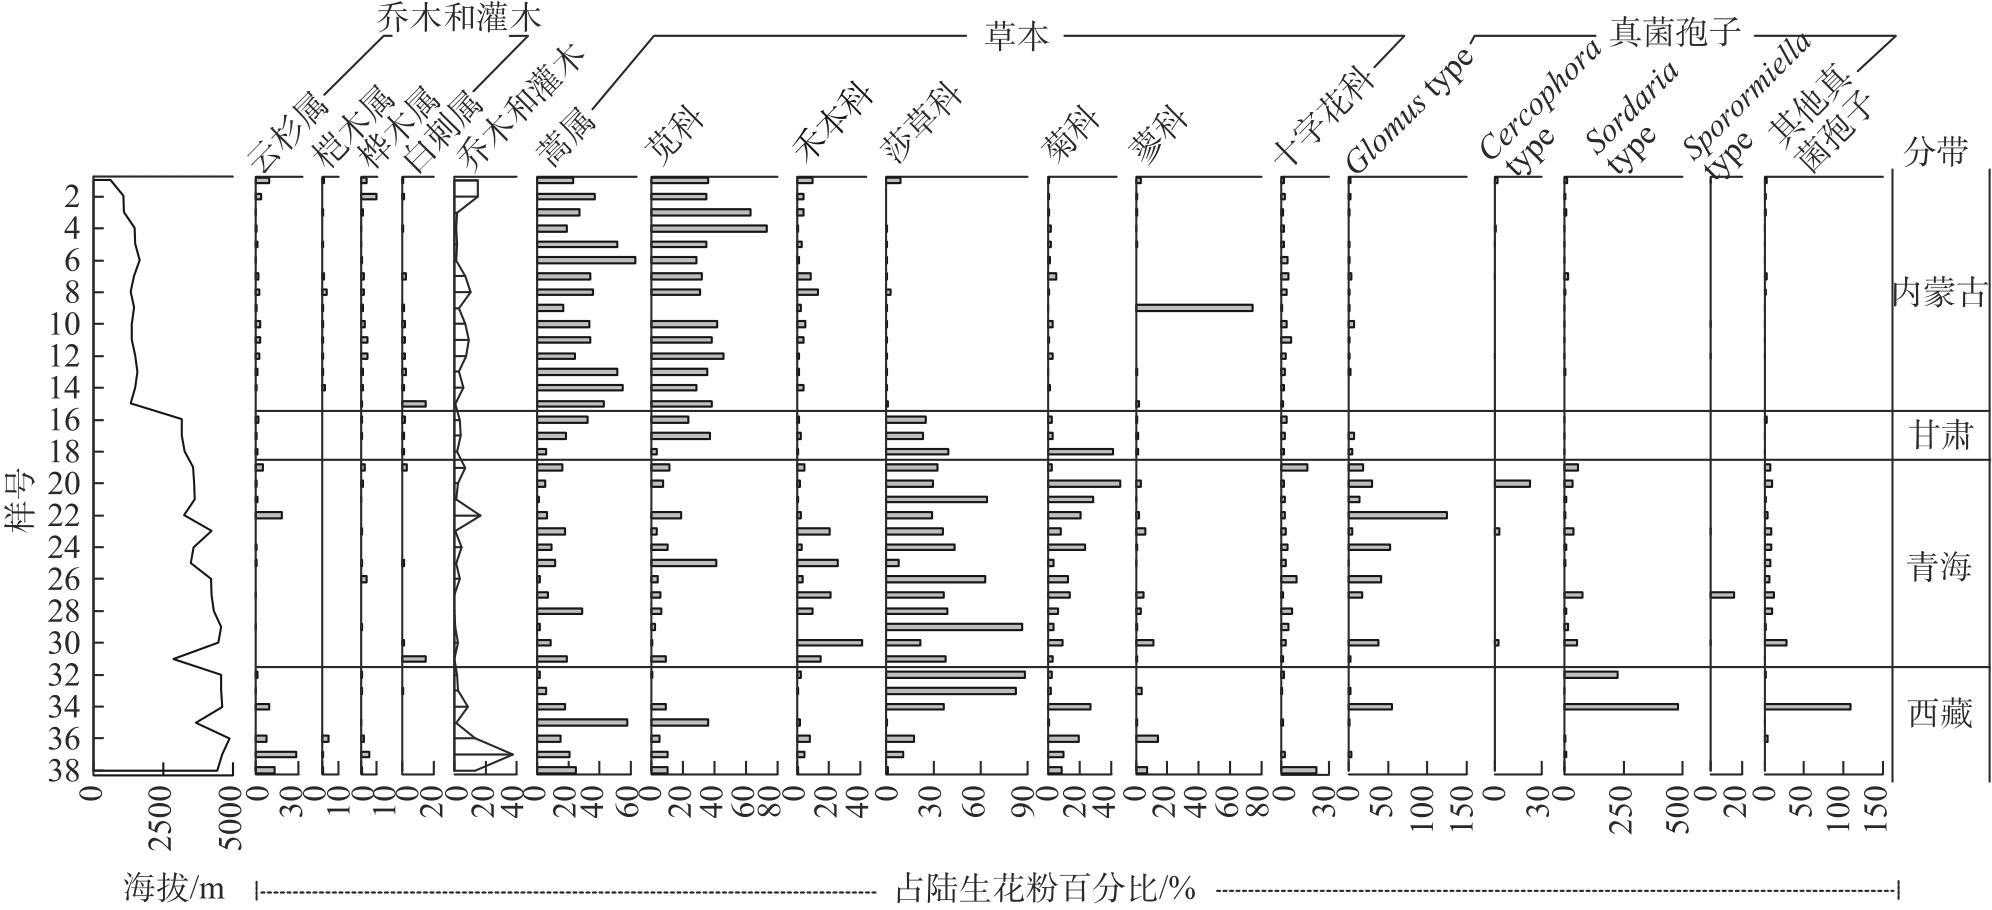
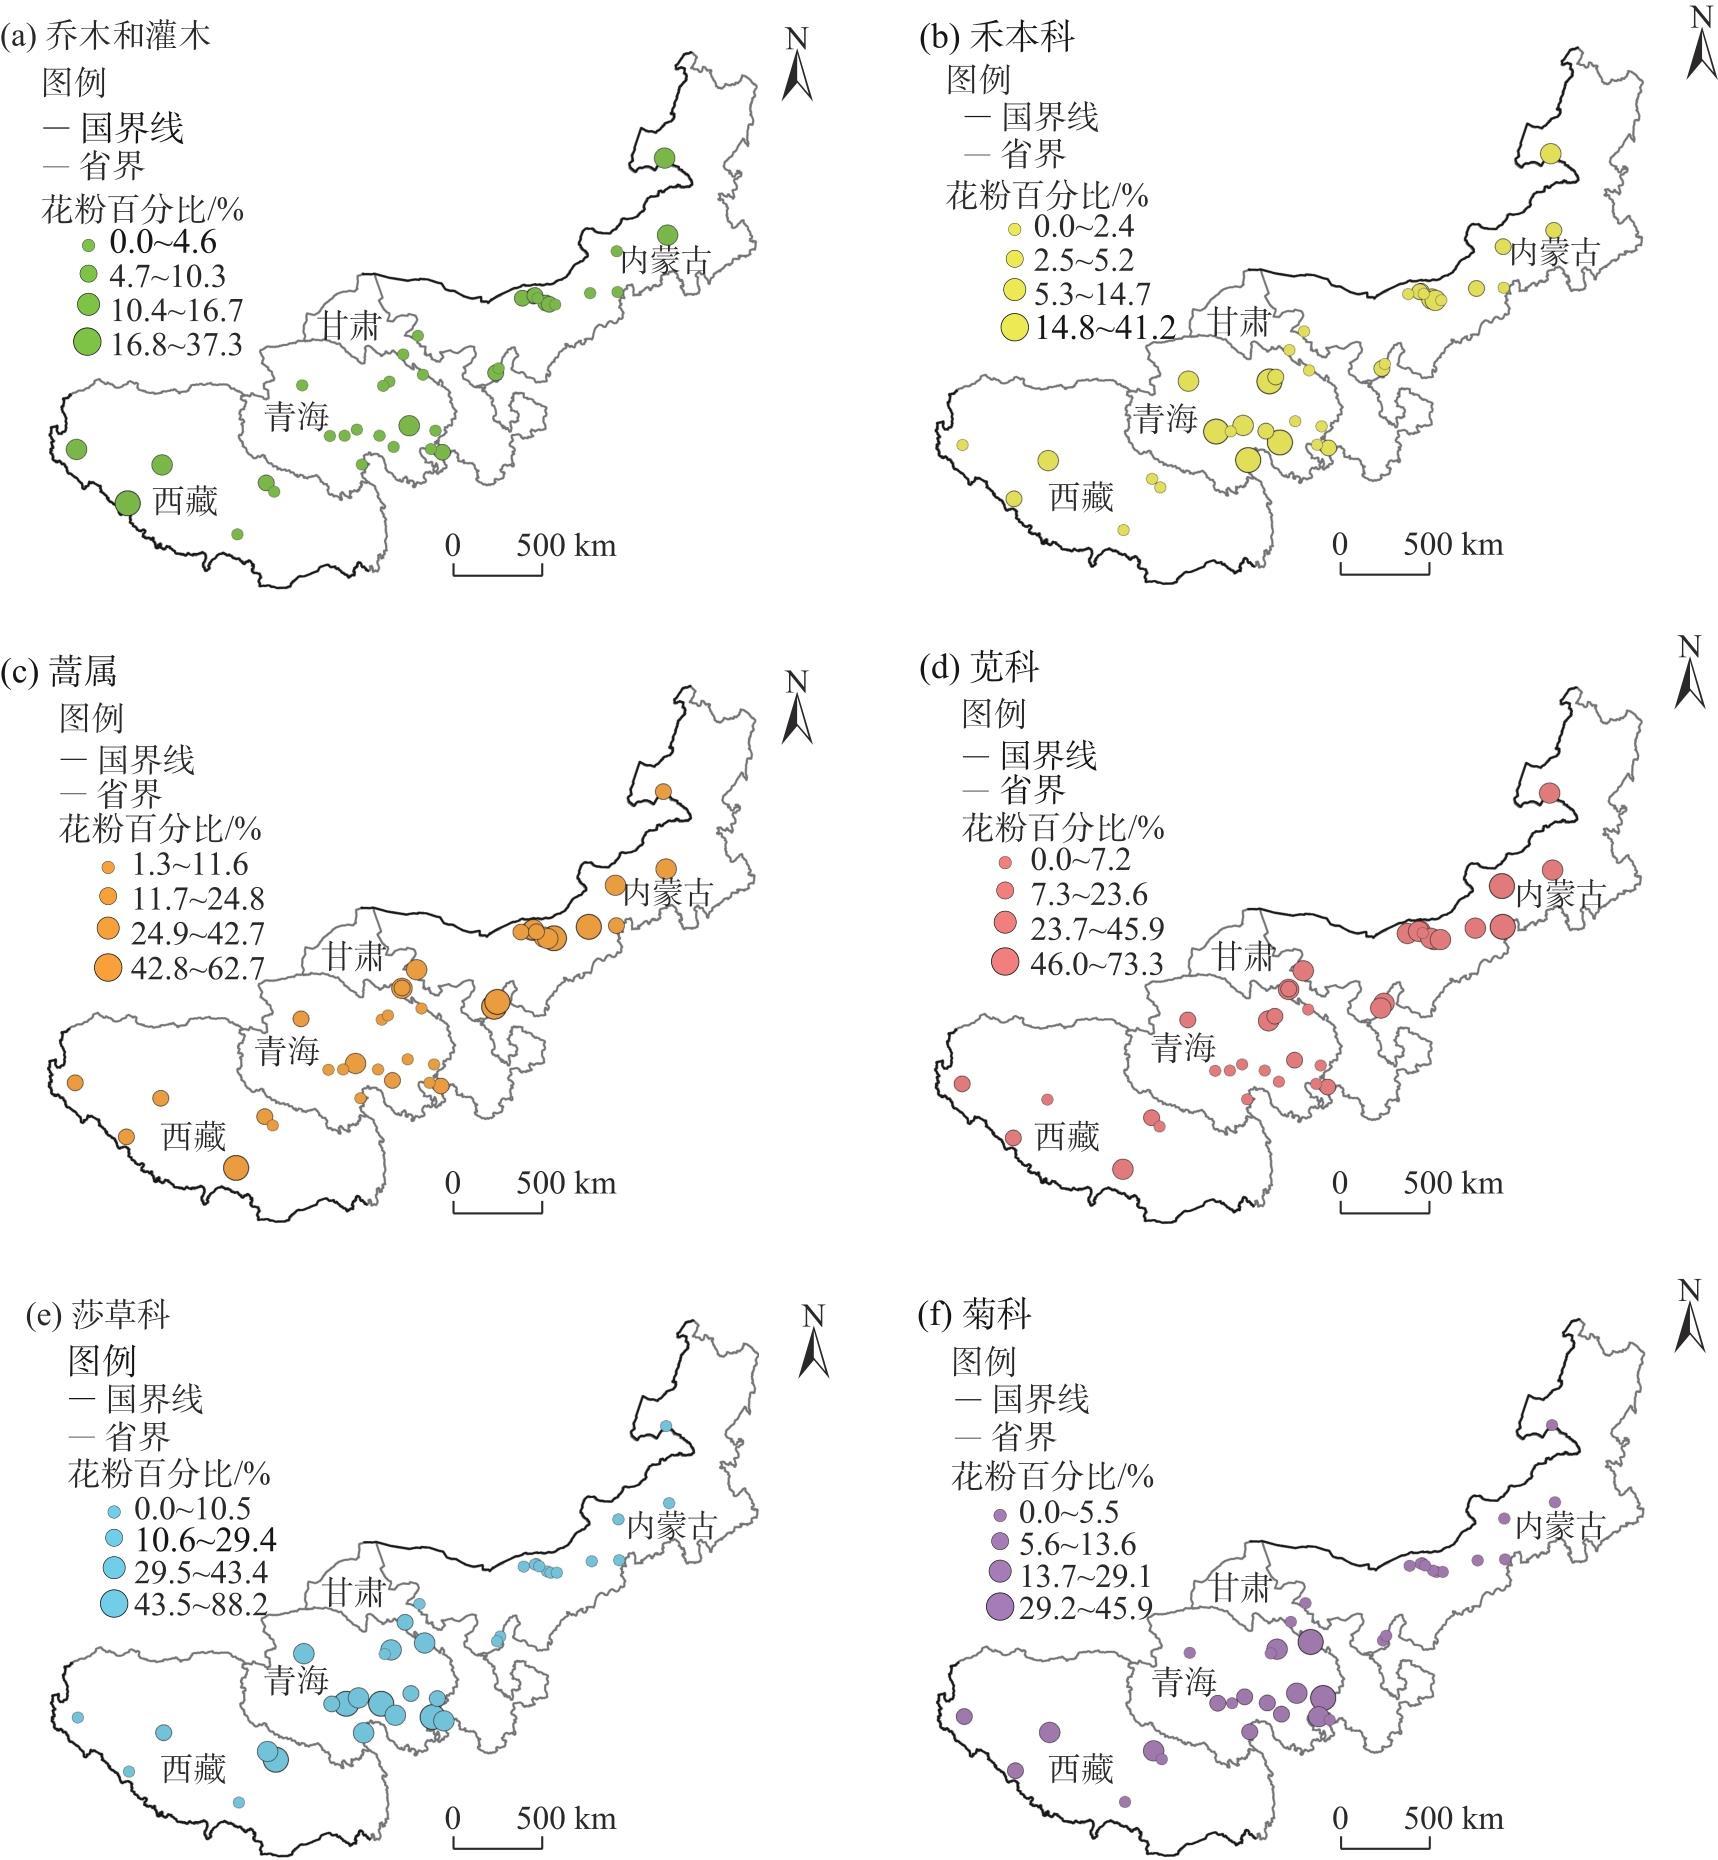
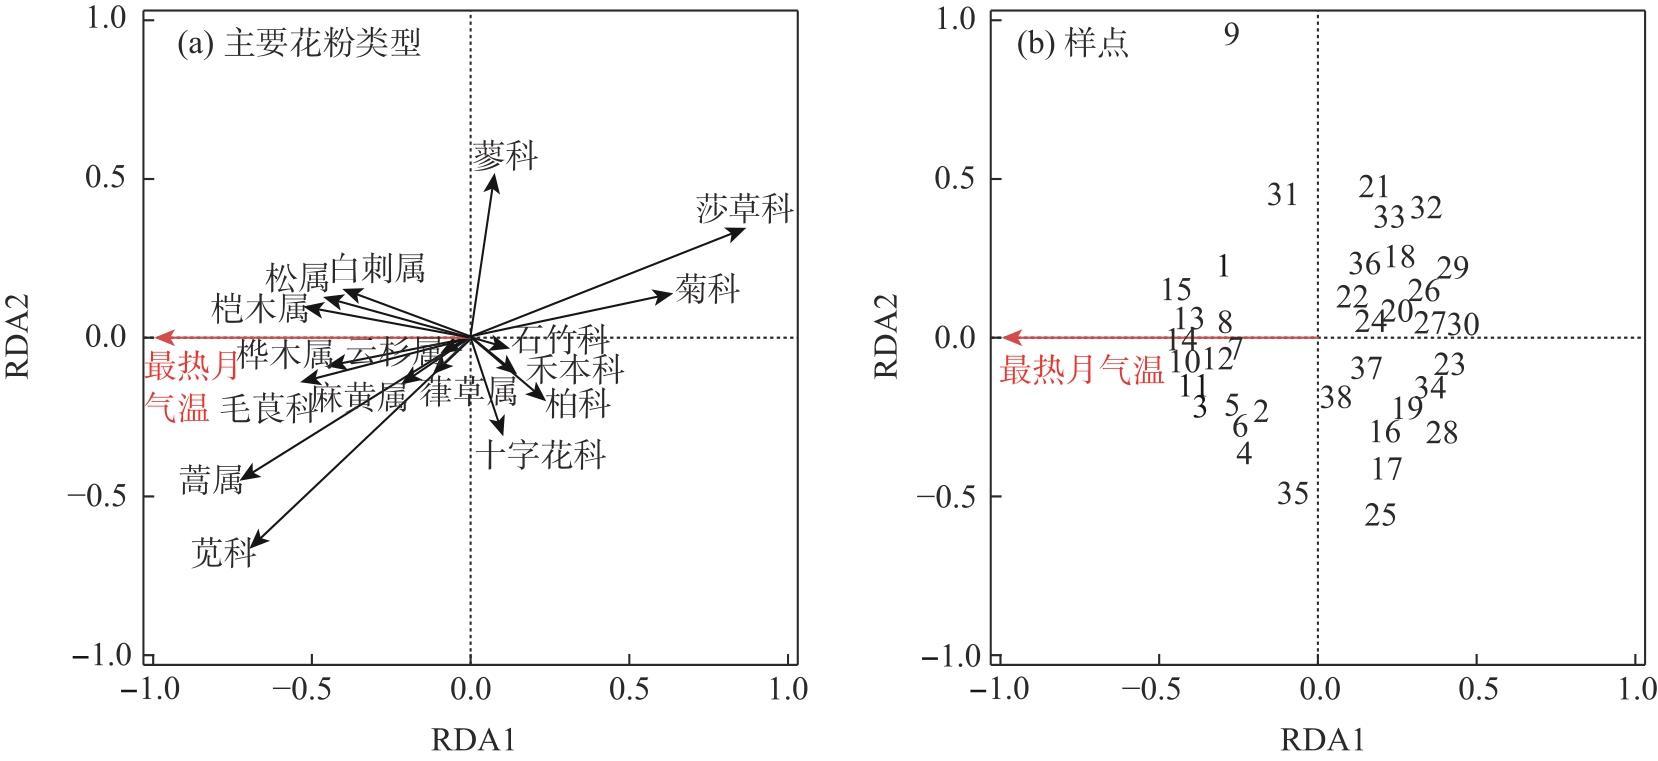
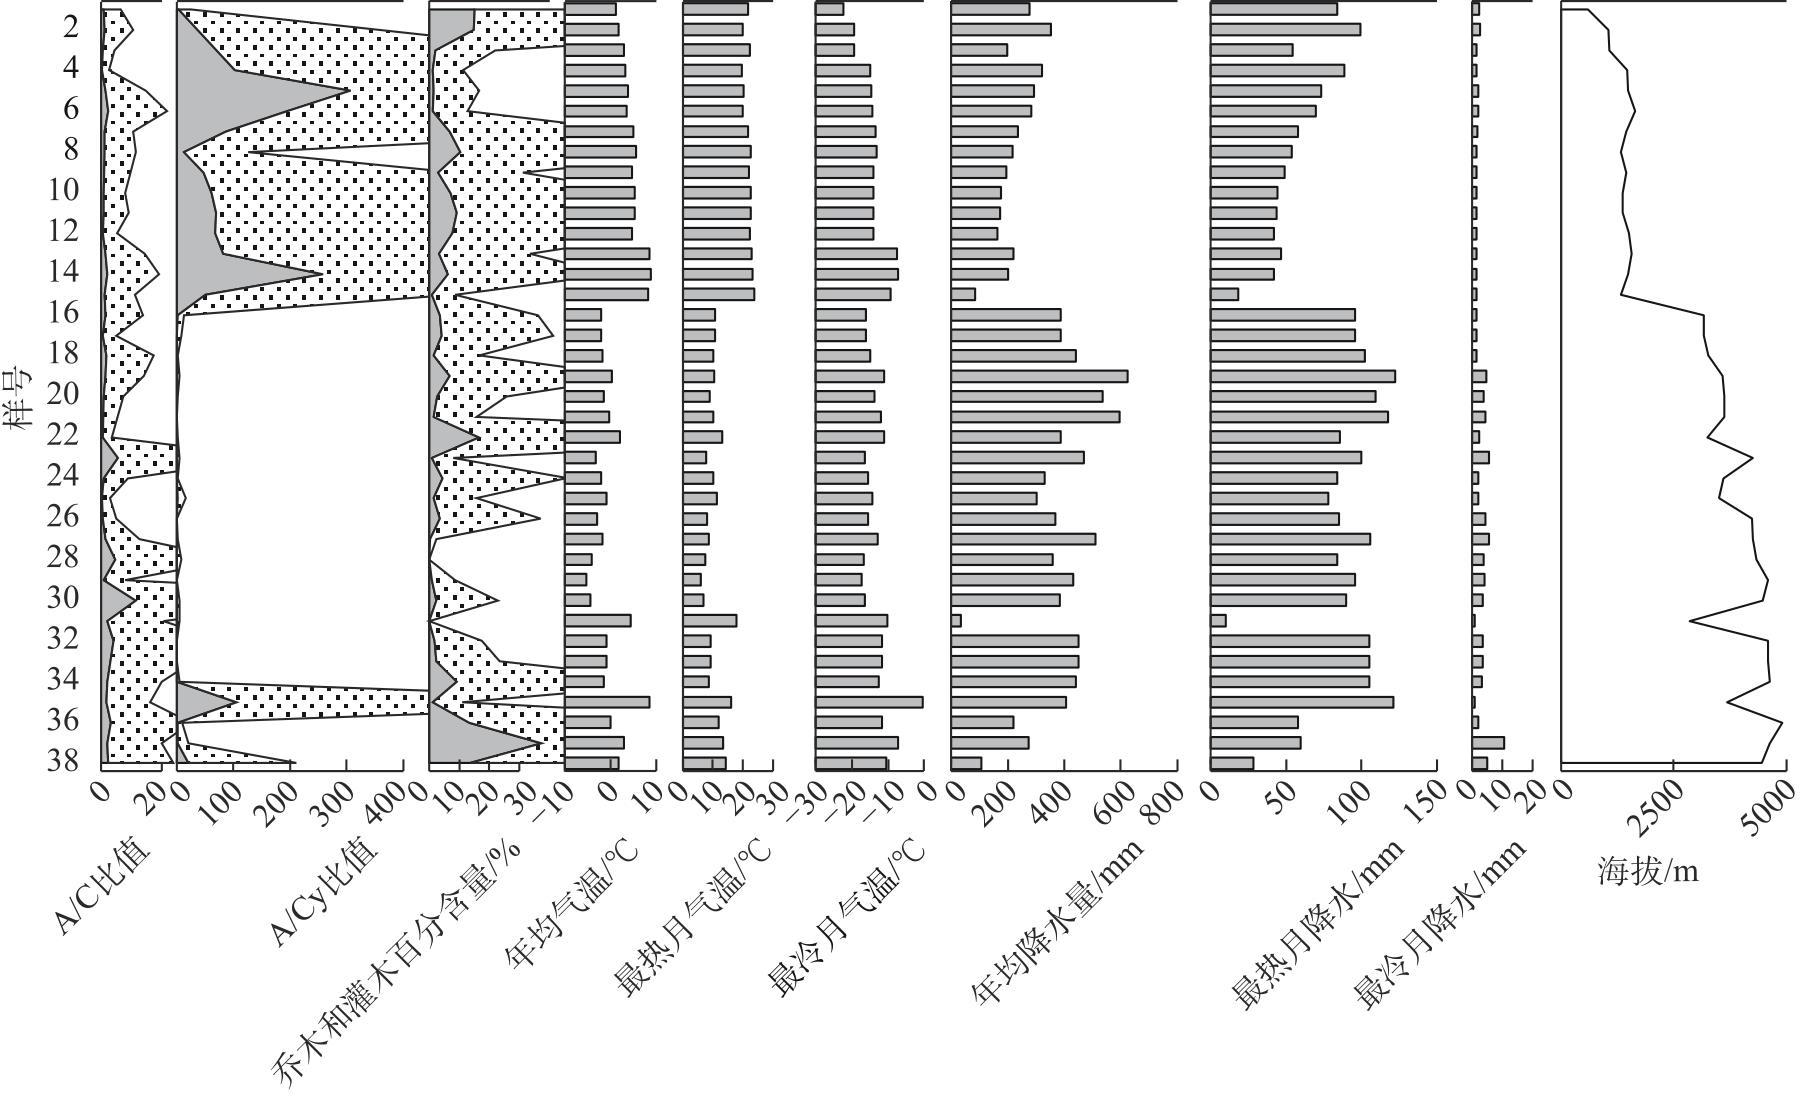
Studying the distribution characteristics of surface soil pollen in the marginal monsoon region of China and the factors influencing this distribution improves the reliability of reconstructing regional vegetation and paleo-monsoon evolution based on fossil pollen data. Through surface soil pollen analysis of 38 sampling sites with annual precipitation ranging from 30-650 mm in the marginal monsoon region of China, this study investigates the relationships among surface pollen assemblages, climate, and human activities. The results reveal that: (1) In low-altitude temperate steppe regions with a relatively warm and dry climate, Amaranthaceae and Artemisia dominate the pollen assemblages, and the ratio of Artemisia/Chenopodiaceae (A/C ratio) generally aligns with average annual precipitation. (2) In high-altitude alpine steppe and meadow regions with a relatively cold and humid climate, pollen assemblages are dominated by Cyperaceae, Asteraceae, and Poaceae. The summed percentages of Artemisia and Amaranthaceae pollen average 25.8%, and no distinctive correlation exists between the A/C ratio and average annual precipitation in these regions. (3) The total tree and shrub pollen percentages exhibit a stronger correlation with average annual temperature and the temperature of the warmest month compared to average annual precipitation. (4) These pollen assemblage characteristics reflect the vegetation distribution and hydrothermal conditions at varying altitudes in the marginal monsoon region of China. Redundancy analysis (RDA) of the pollen data also reveals the distribution of pollen assemblages and major pollen types along gradients of the warmest month temperature and altitude. In addition, the high abundance of fungal spores on the soil surface in the alpine region reflects environmental characteristics associated with significant grazing intensity and a subsequent high soil erosion rate.

Cite this article

Siqi WU , Haiqin WEI , Chunzhu CHEN , Lisi WEI , Wenwei ZHAO , Huan LI , Yi SUN , Qingfeng JIANG , Xiaojian ZHANG , Yan ZHAO . Distribution characteristics and its influencing factors of surface soil pollen in the marginal monsoon region of China[J]. Arid Land Geography, 2025 , 48(1) : 53 -62 . DOI: 10.12118/j.issn.1000-6060.2024.059

中国季风边缘区代表了干旱内陆地区和湿润沿海地区之间独特的生态和气候界面,是一个关键的生态过渡区,对气候变化响应非常敏感。近年来,许多学者利用季风边缘区沉积物孢粉记录探讨了不同时间尺度植被和季风演变过程[1-7]。但因不同孢粉种类在产量、传播途径、散布能力、沉降速率和保存条件等方面存在差异,孢粉与植被之间关系相对复杂[8-12]。因此,研究季风边缘区表层土壤孢粉分布特征及其影响因素,能为利用化石孢粉重建古植被和古气候提供重要参考,从而为了解季风边缘区生态系统的脆弱性和恢复力提供科学依据。
已有许多学者在中国季风边缘区开展了孢粉现代过程研究[13-19]。例如,Xu等[16]对中国北方典型植被类型进行表土孢粉分析,指出不同类型植被的花粉组合存在明显差别,且与植被盖度的相关性不一,不同类型花粉的代表性具有很大差异。此外,李芙蓉[15]对青藏高原若尔盖盆地、黄土高原及周边荒漠表土孢粉展开研究,探讨了表土孢粉组合与植被和气候的关系,并指出年降雨量是影响表土孢粉组合的主要气候因子。Herzschuh[17]评估了青藏高原东部现代孢粉比值重建气候的可靠性。虽然这些研究促进了对相应区域范围内孢粉与植被、气候以及人类活动关系的认识。但中国季风边缘区面积辽阔,区域内海拔、气候和植被差异较大,对整个区域内现代孢粉组合特征及其影响因素尚缺乏系统认识。
此外,中国季风边缘区天然牧场广泛分布,放牧活动历史悠久[20-22]。除了一些与人类活动相关的特征孢粉指示种外[23-25],真菌孢子中的粪生菌孢是样点附近动物活动及放牧行为的有效指示物[26-31]。真菌孢子中Sporormiella type和Sordaria type增多可指示家畜种群的扩大[26,32]。已有菌孢记录表明中国季风边缘区自中晚全新世就出现不同程度的放牧活动[20,29-30]。因此,人类活动也是影响中国季风边缘区植被及其孢粉组合的重要因素。
本研究采集了38个表土孢粉样品,覆盖了中国季风北界沿线地区自内蒙古东北到藏南的范围。通过孢粉百分比数据和气候参数数据,研究中国季风边缘区表土孢粉分布特征及其影响因素,为厘清表土花粉、植被、气候和人类活动之间的关系,以及提高化石孢粉定量重建古气候的精准度提供数据支持。

1 数据与方法

1.1 研究区概况

中国季风边缘区北界[33]北起大兴安岭东麓,经内蒙古高原、祁连山东段,一直延伸至青藏高原西部,涉及内蒙古、甘肃、青海和西藏4个省区(图1)。研究区地势由西向东逐渐升高,横跨中国一、二级地形阶梯,以高原山地为主要地貌特征。研究区主要分布在内蒙古高原和青藏高原2个地貌单元,气候相对干旱,降水主要集中在5—10月。在季风边缘区的内蒙古高原属于温带大陆性干旱和半干旱气候区,年均降水量80~360 mm,年均气温1~9 ℃;在季风边缘区的青藏高原地区,年均降水量30~650 mm,年均气温-6~9 ℃。
图1 研究区表土孢粉采样点分布

注:基于自然资源部标准地图服务网站审图号为GS(2020)4619号的标准地图制作,底图边界无修改。下同。

Fig. 1 Distribution of soil surface pollen samples in the study area

中国季风边缘区显著的地貌和气候条件差异导致地表植被分异较为明显。在内蒙古高原东北角,邻近大兴安岭的地方,以森林草原为主要植被类型,其中乔木以云杉(Picea)和桦木(Betula)为主;而高原中段的锡林郭勒高原则主要覆盖地带性温带草原植被;向西,荒漠草原植被和温带荒漠逐渐占据主导地位。在温带草原植被中,以蒿属(Artemisia)为代表的菊科(Asteraceae)植物属种类最多,其次是禾本科(Poaceae)、苋科(Amaranthaceae)、蔷薇科(Rosaceae)、豆科(Fabaceae)、毛茛科(Ranunculaceae)、莎草科(Cyperaceae)、十字花科(Brassicaceae)、蓼科(Polygonaceae)、唇形科(Laminaceae)和伞形科(Apiaceae)等。青藏高原上位于季风影响北界的地区,主要植被类型为高寒灌丛、草甸和草原。耐寒的杜鹃花科(Ericaceae)与小金露梅(Dasiphora arbuscula)等常组成高寒灌丛;莎草科嵩草属(Kobresia)的多种,如小蒿草(Kobresia pygmaea)、线叶蒿草(K. capillifolia)、短轴嵩草(K. prattii)等与珠芽蓼(Polygonum viviparum)常形成高寒草甸;高寒草原以耐寒的紫花针茅(Stipa purpurea)、羽叶针茅(S. subsessiliflora var. basiplumosa)、硬叶苔草(Carex moorcroftii)、小半灌木藏籽蒿(Artemisia salsoloides var. wellbyi)、藏南蒿(A. younghusbandii)及垫状蒿(A. minor)等组成[34]

1.2 野外样品采集

2018年7—8月,沿中国季风边缘区沿线,共采集了38个表土孢粉样品,涵盖了内蒙古、甘肃、青海和西藏(表1图1)。样品覆盖研究区主要植被类型,采用五分法采集样点周围0.5 m范围内表层土壤样品,并将其混合。在采集样品的同时,还使用无人机进行了航拍,记录下了样点周围的植物群落情况,并使用GPS定位系统记录了采样点的经纬度和海拔高度。样点的经纬度范围为80.25°~118.2°E和29.22°~48.2°N,样点的海拔高度最高达到4890 m、最低为594 m。
表1 中国季风边缘区38个表土孢粉样品采集信息

Tab. 1 Information of 38 surface soil pollen samples in the marginal monsoon region of China

样号 省份 经度/°E 纬度/°N 海拔/m 植被类型 样号 省份 经度/°E 纬度/°N 海拔/m 植被类型
1 内蒙古 118.1916 48.1954 594 温带草原 20 青海 101.7496 35.2380 3620 高寒草甸
2 内蒙古 117.6678 44.3608 1061 温带草原 21 青海 101.5095 34.3277 3624 高寒草甸
3 内蒙古 114.0218 43.8385 1079 温带草原 22 青海 100.0912 35.4433 3251 高寒草甸
4 内蒙古 113.8248 41.8171 1474 温带草原 23 青海 99.1968 34.3466 4246 高寒草原
5 内蒙古 111.9580 41.8743 1484 温带草原 24 青海 98.6818 37.5435 3595 高寒草甸
6 内蒙古 109.5486 41.4184 1643 温带草原 25 青海 98.3203 37.3161 3498 高寒草原
7 内蒙古 109.1272 41.4311 1442 温带草原 26 青海 98.2959 34.8516 4224 高寒草甸
8 内蒙古 108.9133 41.4994 1338 温带草原 27 青海 97.3486 33.3814 4249 高寒草原
9 内蒙古 108.3732 41.7582 1451 温带草原 28 青海 96.8674 35.0698 4325 高寒草甸
10 内蒙古 108.1852 41.8837 1362 温带草原 29 青海 96.1393 34.7171 4579 高寒草甸
11 内蒙古 108.0843 41.8669 1372 温带草原 30 青海 95.2436 34.6446 4472 高寒草原
12 内蒙古 107.3315 41.7723 1498 温带草原 31 青海 93.1708 36.9647 2857 高寒荒漠
13 内蒙古 105.7014 38.3493 1563 温带草原 32 西藏 92.2592 31.5912 4591 高寒草甸
14 内蒙古 105.5002 38.1114 1487 温带草原 33 西藏 92.2586 31.5915 4590 高寒草甸
15 内蒙古 100.3784 39.8783 1325 温带荒漠 34 西藏 91.7169 31.9666 4623 高寒草甸
16 甘肃 99.4784 38.9213 3172 高寒草原 35 西藏 90.4644 29.2524 3667 高寒草原
17 甘肃 99.4784 38.9214 3170 高寒草原 36 西藏 85.4007 32.0089 4890 高寒草原
18 甘肃 100.8250 37.9754 3266 高寒灌丛草甸 37 西藏 83.8801 29.7957 4628 高寒草原
19 青海 102.1994 34.1744 3569 高寒灌木草甸 38 西藏 80.2225 31.8252 4449 高寒草原

1.3 孢粉分析

称取1~2 g样品进行孢粉样品前处理实验。首先使用200 µm筛布去除粗颗粒杂质,然后加入1粒石松孢子片剂(每片约27650粒)作为示踪剂来计算孢粉浓度[35]。随后采用酸碱处理法、醋酸酐法以及超声波过筛(使用10 µm筛布)对样品进行孢粉提纯[36]。处理后的样品用甘油保存在小试管中,以备显微镜下的鉴定和统计。孢粉鉴定工作在400倍光学显微镜下进行,主要参考《中国植物孢粉形态》[37]、《中国第四纪孢粉图鉴》[38]和《中国干旱半干旱地区花粉形态研究》[39]等图集。除了少数极低浓度的花粉样品,每个样品鉴定的陆生花粉数量一般都不低于500颗。孢子和花粉的百分比以陆生花粉总和作为基数进行计算,使用Tilia软件绘制孢粉图谱。

1.4 数据处理

本研究使用中国756个气象站观测数据(http://data.cma.cn)的插值数据,利用薄板样条插值法来获取38个孢粉样点的气候数据[40]。气候参数包括年均降水量、最热月降水量、最冷月降水量、年均气温、最热月气温和最冷月气温。从孢粉组合中选取在3个以上样品中出现且百分比最大值大于3%的陆生花粉类型(n=17),并分析孢粉组合与气候参数之间的关系。为了增强信噪比,孢粉百分比数据进行了平方根转化[41]。降趋对应分析(DCA)结果显示轴1梯度长度值为1.6,因此在本研究中采用了线性排序方法对孢粉数据进行排序[42]。利用冗余分析(RDA)探讨了不同气候参数对中国季风边缘区孢粉组合分布特征的贡献。在RDA结果中,发现气候参数方差膨胀因子(VIF)超过20,表明气候参数之间存在较高的线性关联性,因此需要剔除并重新进行RDA分析,直到所有气候参数的VIF值都低于20[43]

2 结果与分析

2.1 孢粉组合和分布特征

中国季风边缘区38个表土孢粉样品中共鉴定出45个孢粉类型。在这些孢粉类型中,出现频率较高的陆生花粉类型有蒿属、莎草科、苋科、禾本科、菊科、云杉属、桤木属(Alnus)、桦木属、白刺属(Nitraria)、十字花科和蓼科等(图2)。其中,草本植物孢粉的平均占比达到了94.2%。此外,部分样品中真菌孢子出现频率较高,主要包括Glomus type、Sordaria type、Cercophora type和Sporormiella type等(按照Bas van Geel的分类方法命名[28])。
图2 中国季风边缘区38个表土孢粉样品图谱

Fig. 2 Simplified sporo-pollen diagram of 38 surface soil pollen samples in the marginal monsoon region of China

根据海拔高度的不同,将孢粉样点划分为温带地区(1~15号样品,位于内蒙古)和高寒地区(16~38号样品,位于甘肃、青海和西藏)2组,其孢粉组合特征如下:
(1) 温带地区
草本植物孢粉占绝对主导地位(84.9%~99.1%,平均93.9%),其中苋科和蒿属占比最高,平均含量分别为37.6%和36.4%。禾本科平均含量4.1%,莎草科、石竹科(Caryophyllaceae)、毛茛科、菊科、廖科和十字花科等孢粉平均含量为1.0%~2.0%,而9号样品中蓼科花粉含量高达74.2%。乔木和灌木植物孢粉中,云杉属(0%~8.9%,平均2.1%)、桦木属(0.2%~9.9%,平均2.3%)和白刺属(0%~14.5%,平均1.8%)含量相对较高。真菌类孢子总体含量相对较低。
(2) 高寒地区
草本植物孢粉(62.7%~100%,平均94.4%)中,莎草科含量最高(0.5%~88.2%,平均36.9%),蒿属(1.3%~57.4%,平均14.7%)、菊科(0.5%~43.9%,平均13.1%)、苋科(0%~41.3%,平均11.2%)和禾本科(0%~41.2%,平均7.4%)孢粉含量相对较高,其次为蓼科(0%~14.3%,平均2.7%)和十字花科(0%~22.0%,平均3.9%)等。乔木和灌木植物孢粉中,西藏样点中云杉属的含量相对较高(0.2%~26.1%)。真菌类孢子含量明显高于温带地区,包括Glomus type(0%~125.0%,平均18.1%)、Sordaria type(0%~481.8%,平均44.2%)、Cercophora type(0%~22.7%,平均1.2%)和Sporormiella type(0%~14.9%,平均0.7%)以及其他真菌孢子(0%~109.1%,平均9.5%)。
从主要孢粉类型含量的空间分布(图3)可以看出,沿季风边缘区自东北向西南方向,孢粉含量发生了显著变化。这种差异在温带地区和高寒地区之间尤为明显。与高寒地区相比,温带地区表土中蒿属和苋科花粉含量普遍更高;而莎草科、禾本科和菊科花粉在多数高寒地区样点中则具有更高的含量百分比。乔灌木花粉在近大兴安岭和藏南地区的含量较高,而在两地之间的广大区域中其出现频率相对较低。
图3 中国季风边缘区38个表土孢粉样品主要属种百分比空间分布

Fig. 3 Distributions of major pollen taxa percentages in 38 surface soil pollen samples in the marginal monsoon region of China

2.2 影响孢粉分布的气候因子分析

将气候参数年均降水量、最热月降水量、最冷月降水量、年均气温、最热月气温和最冷月气温加入RDA分析,发现年均气温、最热月气温和最冷月气温的VIF值均超过20;剔除年均气温再次进行RDA分析,其余所有气候参数的VIF值均小于20(表2)。将某一气候参数作为唯一环境因子的RDA分析表明,最热月气温的方差解释量最高(12.9%),其次为年均降水量(7.2%)。使用剔除年均气温后的其他5个气候参数作为环境因子的约束轴置换检验(ANOVA),也表明最热月气温的方差解释量最高,且仅最热月气温的显著性水平<0.5,因此仅保留最热月气温作为环境因子。
表2 中国季风边缘区38个表土孢粉样品及气候参数的冗余分析(RDA)结果

Tab. 2 RDA results of 38 surface soil pollen samples and the climate variables in the marginal monsoon region of China

气候参数 方差膨胀
因子(VIF)
气候变量作为
唯一预测因子
约束轴置换
检验(ANOVA)
运行1 运行2 方差解释量/% 方差解释量/% P
年均降水量 17.3 15.8 7.2 1.0 0.129
最热月降水量 14.0 14.0 5.2 1.1 0.089
最冷月降水量 1.8 1.6 4.0 0.8 0.158
年均气温 446.1 - - - -
最热月气温 340.8 2.5 12.9 5.3 0.001
最冷月气温 97.2 1.0 0.5 0.4 0.558
气候参数最热月气温位于RDA轴1的负方向(图4)。大多数温带地区样点分布于RDA轴1的负方向,且温带地区孢粉含量较高的蒿属、苋科和桦木属等科属分布于RDA轴1的负方向,指示相对温暖的环境;而大多数高寒地区样点分布于RDA轴1的正方向,且高寒地区孢粉含量较高的莎草科、菊科和禾本科等科属分布于RDA轴1的正方向,指示相对寒冷的环境。
图4 中国季风边缘区38个表土孢粉数据冗余分析(RDA)结果

Fig. 4 RDA results based on 38 surface soil pollen samples in the marginal monsoon region of China

3 讨论

中国季风边缘区的38个表土样品显示了随海拔升高孢粉组合明显变化的特征。低海拔的温带草原地区气候相对温暖和干燥(图5),孢粉组合以苋科和蒿属为主;高海拔的高寒草原和草甸地区气候相对寒冷和湿润,孢粉组合以莎草科、菊科和禾本科为主导,并有少量杜鹃花科花粉。这些孢粉组合变化特征反映了中国季风边缘区植被和水热条件在海拔上的分布特征。RDA分析结果也清晰地反映了孢粉组合及主要花粉类型在最热月气温和海拔梯度上的分布。尽管除了最热月气温以外的气候参数在RDA分析中未能通过显著性检验,但它们对孢粉组合和植被的影响也不容忽视。
图5 中国季风边缘区38个表土孢粉样品蒿藜比(A/C比值)、蒿/莎草比(A/Cy比值)、乔木和灌木百分比及样点对应海拔和气候

注:阴影部分为放大10倍效果。

Fig. 5 A/C ratio, A/Cy ratio, tree and shrub pollen percentage, as well as the elevation and climate of 38 surface soil pollen sites in the marginal monsoon region of China

在乔灌木花粉中,云杉花粉在靠近大兴安岭和藏南地区的样点中含量相对较高(图3),反映了样点与云杉分布区的距离较近。此外,由于采样点附近没有乔木分布,也反映了云杉花粉的传播能力较强[44-45]。桦木属、胡桃属(Juglans)、榆属(Ulmus)和桤木属等乔木花粉则主要出现在温带草原中,反映这些乔木喜温暖的特性。白刺花粉主要出现在温带地区的样品中,并且在温带荒漠(15号样点,内蒙古)和高寒荒漠(31号样点,青海)的样品中出现了百分比高峰,反映了这2个地方极度干旱的环境特征(图2)。总体而言,研究区乔灌木孢粉的总百分比与年均气温和最热月气温之间的相关性较与年降水量之间的相关性强(图5)。
在草本花粉中,温带地区蒿属和苋科花粉的百分比之和平均为74%。在中国干旱半干旱区,当蒿属和苋科花粉的百分比之和超过50%时,蒿藜比(A/C比值)常被作为衡量研究区干旱程度的半定量指标[18,46]。从图5可以看出,季风北界穿过的温带地区气温相对较高,年降水量较少,气候偏干旱。表土样品的A/C比值与年均降水量的变化趋势基本一致,符合干旱程度越大,A/C比值越低的一般规律[47];而在季风影响边缘的高寒地区,蒿属和苋科花粉的百分比之和平均为25.8%,并且该区域A/C比值与年均降水量的变化趋势没有明显的相关性。在季风北界的高寒地区,孢粉组合反映了植被主要由莎草科、菊科、禾本科、蒿属、蓼科和十字花科等种属组成的高寒草原和草甸植被,体现了植物对寒冷的耐受特性。孢粉蒿/莎草比(A/Cy比值)常被用来表征青藏高原上水热分布和变化的情况[48-50],比如最热月气温[17]。由于温带地区莎草科花粉远少于高寒地区,所以前者的A/Cy比值远高于后者。在季风影响边缘的高寒地区,或因样本数量仍较少(n=23),A/Cy比值与气温的相关性并不明显。
真菌孢子在高寒地区的表土样品中频繁出现。过去的研究表明,真菌孢子通常在产孢地附近沉积,特别是粪生真菌孢子受动物活动范围的限制,更多地反映了样点局部环境的信息[31-32]。诸如Cercophora type、Sporormiella type和Sordaria type 的真菌孢子都可能指示样点周围存在粪便[28],而Sporormiella type和Sordaria type的增多则可能指示家畜种群的扩大[26,30]。而Glomus type则常出现在新形成的土壤上,它的丰度被认为反映了土壤侵蚀的速率。因此,研究区高寒地区土壤表层中大量出现的这些真菌孢子可能反映了该地区放牧强度较大、并伴随着较高的土壤侵蚀速率的环境特征[28]。既有的孢粉记录表明,从中晚全新世开始,青藏高原东北部地区的放牧活动逐渐增强[20,29]

4 结论

(1) 中国季风边缘区表土孢粉组合随海拔升高呈现明显的变化,温带地区蒿属和苋科花粉含量普遍较高,高寒地区则具有较丰富的莎草科、禾本科和菊科花粉。这一孢粉组合特征可以精确反映季风边缘区植被和水热条件在海拔上的分布特征。
(2) 通过对中国季风边缘区孢粉组合与气候要素之间关系的RDA分析发现,最热月气温对孢粉数据的方差解释量最高(12.9%),孢粉组合变化受最热月气温主导。
(3) 粪生真菌孢子在中国季风边缘区高寒地区土壤表层中大量出现,反映了该区域放牧强度大、伴随土壤侵蚀速率高的环境特征。
[1]
Li G Q, Wang Z, Zhao W W, et al. Quantitative precipitation reconstructions from Chagan Nur revealed lag response of East Asian summer monsoon precipitation to summer insolation during the Holocene in arid northern China[J]. Quaternary Science Reviews, 2020, 239: 106365, doi: 10.1016/j.quascirev.2020.106365.

[2]
Wen R L, Xiao J L, Fan J W, et al. Pollen evidence for a mid-Holocene East Asian summer monsoon maximum in northern China[J]. Quaternary Science Reviews, 2017, 176: 29-35.

[3]
Zhang Y R, Li Y Q, Liu L N, et al. No evidence of human disturbance to vegetation in the Zoige Region (north-eastern Tibetan Plateau) in the last millennium until recent decades[J]. Palaeogeography, Palaeoclimatology, Palaeoecology, 2022, 589: 110843, doi: 10.1016/j.palaeo.2022.110843.

[4]
Shen J, Liu X Q, Wang S M, et al. Palaeoclimatic changes in the Qinghai Lake area during the last 18000 years[J]. Quaternary International, 2005, 136(1): 131-140.

[5]
Chen F H, Xu Q H, Chen J H, et al. East Asian summer monsoon precipitation variability since the last deglaciation[J]. Scientific Reports, 2015, 5: 11186, doi: 10.1038/srep11186.

PMID

[6]
Zhang J, Huang X Z, Wang Z L, et al. A late-Holocene pollen record from the western Qilian Mountains and its implications for climate change and human activity along the Silk Road, northwestern China[J]. The Holocene, 2018, 28(7): 1141-1150.

[7]
Wang J L, Huang X Z, Zhang J, et al. Pollen record of humidity changes in the arid western Qilian Mountains over the past 300 years and comparison with tree-ring reconstructions[J]. Frontiers in Earth Science, 2020, 8: 562426, doi: 10.3389/feart.2020.562426.

[8]
Davis M B, Brubaker L B. Differential sedimentation of pollen grains in lakes[J]. Limnology and Oceanography, 1973, 18(4): 635-646.

[9]
Prentice I C. Pollen representation, source area, and basin size-toward a unified theory of pollen analysis[J]. Quaternary Research, 1985, 23(1): 76-86.

[10]
Jackson S T. Pollen representation of vegetational patterns along an elevational gradient[J]. Journal of Vegetation Science, 1991, 2(5): 613-624.

[11]
Sugita S. Pollen representation of vegetation in Quaternary sediments: Theory and method in patchy vegetation[J]. Journal of Ecology, 1994, 82(4): 881-897.

[12]
韩岳婷, 李建勇, 刘剑波, 等. 准噶尔盆地西部花粉对植被的指示性研究[J]. 干旱区地理, 2023, 46(5): 773-781.

DOI

[Han Yueting, Li Jianyong, Liu Jianbo, et al. Indicative study of pollen on vegetation in western Junger Basin[J]. Arid Land Geography, 2023, 46(5): 773-781.]

DOI

[13]
Cao X Y, Tian F, Li K, et al. Lake surface sediment pollen dataset for the alpine meadow vegetation type from the eastern Tibetan Plateau and its potential in past climate reconstructions[J]. Earth System Science Data, 2021, 13(7): 3525-3537.

[14]
陈辉, 吕新苗, 李双成. 柴达木盆地东部表土花粉分析[J]. 地理研究, 2004, 23(2): 201-210.

[Chen Hui, Xinmiao, Li Shuangcheng. A study on topsoil pollens in the east of Qaidam Basin[J]. Geographical Research, 2004, 23(2): 201-210.]

[15]
李芙蓉. 中国北方表土孢粉组合及其与植被和气候的关系[D]. 兰州: 兰州大学, 2012.

[Li Furong. The surface pollen assemblages and their relationships with modern vegetation and climate in north China[D]. Lanzhou: Lanzhou University, 2012.]

[16]
Xu Q H, Li Y C, Yang X L, et al. Quantitative relationship between pollen and vegetation in northern China[J]. Science in China Series D: Earth Sciences, 2007, 50(4): 582-599.

[17]
Herzschuh U. Reliability of pollen ratios for environmental reconstructions on the Tibetan Plateau[J]. Journal of Biogeography, 2007, 34(7): 1265-1273.

[18]
魏海成, 郑卓, 马海州, 等. 青海表土花粉分布规律及其与植被的关系[J]. 干旱区地理, 2009, 32(6): 932-940.

[Wei Haicheng, Zheng Zhuo, Ma Haizhou, et al. Pollen distribution patterns of surface soil sample in Qinghai of China and their relationship with vegetation[J]. Arid Land Geography, 2009, 32(6): 932-940.]

[19]
程波, 陈发虎. 西北干旱区石羊河流域表土花粉分析[J]. 中国沙漠, 2010, 30(2): 350-356.

[Cheng Bo, Chen Fahu. Pollen analysis of topsoil samples from Shiyang River drainage, northwest China[J]. Journal of Desert Research, 2010, 30(2): 350-356.]

[20]
Wei H C, Chongyi E, Duan R L, et al. Fungal spore record of pastoralism on the NE Qinghai-Tibetan Plateau since the middle Holocene[J]. Science China Earth Sciences, 2021, 64: 1318-1331.

[21]
Chen F H, Dong G H, Zhang D J, et al. Agriculture facilitated permanent human occupation of the Tibetan Plateau after 3600 BP[J]. Science, 2015, 347(6219): 248-250.

DOI PMID

[22]
Ma M M, Dong G H, Jia X, et al. Dietary shift after 3600 cal yr BP and its influencing factors in northwestern China: Evidence from stable isotopes[J]. Quaternary Science Reviews, 2016, 145: 57-70.

[23]
Li J Y, Zhao Y, Xu Q H, et al. Human influence as a potential source of bias in pollen-based quantitative climate reconstructions[J]. Quaternary Science Reviews, 2014, 99: 112-121.

[24]
Li M Y, Xu Q H, Zhang S R, et al. Indicator pollen taxa of human-induced and natural vegetation in northern China[J]. The Holocene, 2015, 25(4): 686-701.

[25]
刘鸿雁, 李宜垠. 半干旱区气候变化和人类活动的孢粉指示[J]. 古生物学报, 2009, 48(2): 211-221.

[Liu Hongyan, Li Yiyin. Pollen indicators of climate change and human activities in the semi-arid region[J]. Acta Palaeontologica Sinica, 2009, 48(2): 211-221.]

[26]
张雅平, 赵克良, 周新郢, 等. 家养食草动物粪便中的花粉及菌孢子类型及其对人类活动的指示意义[J]. 人类学学报, 2021, 40(5): 879-887.

[Zhang Yaping, Zhao Keliang, Zhou Xinyin, et al. A study of pollen and fungal spores extracted from the feces of domestic herbivores in China and their implications for human behavior[J]. Acta Anthropologica Sinica, 2021, 40(5): 879-887.]

[27]
郝秀东, 翁成郁. 粪生真菌孢子在古生态学研究中的指示意义[J]. 海洋地质与第四纪地质, 2015, 35(1): 175-184.

[Hao Xiudong, Wen Chengyu. The indicative significance of spores of corpophilous fungi in palaeoecological research[J]. Marine Geology & Quaternary Geology, 2015, 35(1): 175-184.]

[28]
van Geel B. Non-pollen palynomorphs[C]// Smol J P, BirksH J B, LastW M, et al. Tracking Environmental Change Using Lake Sediments (vol. 3):Terrestrial, Algal, and Siliceous Indicators. Dordrecht: Kluwer Academic Publisher, 2001: 1-17.

[29]
Huang X Z, Zhang J, Storozum M, et al. Long-term herbivore population dynamics in the northeastern Qinghai-Tibetan Plateau and its implications for early human impacts[J]. Review of Palaeobotany and Palynology, 2020, 275: 104171, doi: 10.1016/j.revpalbo.2020.104171.

[30]
Huang X Z, Zhang J, Ren L L, et al. Intensification and driving forces of pastoralism in northern China 5.7 ka ago[J]. Geophysical Research Letters, 2021, 48(7): e2020GL092288, doi: 10.1029/2020GL092288.

[31]
Zhang J, Huang X Z, Wang J L, et al. An inverse relationship between moisture and grazing intensity in an arid mountain-basin system[J]. Progress in Physical Geography: Earth and Environment, 2022, 46(2): 310-322.

[32]
Zhang J, Huang X Z, Zhang S R, et al. Cycles of grazing and agricultural activity during the historical period and its relationship with climatic and societal changes in northern China[J]. Land Degradation & Development, 2021, 32(11): 3315-3325.

[33]
Chen F H, Yu Z C, Yang M L, et al. Holocene moisture evolution in arid Central Asia and its out-of-phase relationship with Asian monsoon history[J]. Quaternary Science Reviews, 2008, 27(3): 351-364.

[34]
中国植被编辑委员会. 中国植被[M]. 北京: 科学出版社, 1995: 917-1034.

[Editorial Committee of Vegetation of China. Vegetation of China[M]. Beijing: Science Press, 1995: 917-1034.]

[35]
Stockmarr J. Tablets with spores used in absolute pollen analysis[J]. Pollen et Spores, 1971, 13: 615-621.

[36]
Faegri K, Iversen J. Textbook of pollen analysis[M]. 4th ed. Chichester: John Wiley & Sons, 1989.

[37]
王伏雄, 钱南芬, 张玉, 等. 中国植物花粉形态[M]. 北京: 科学出版社, 1995.

[Wang F X, Qian N F, Zhang Y, et al. Pollen flora of China[M]. Beijing: Science Press, 1995.]

[38]
唐领余, 毛礼米, 李春海, 等. 中国第四纪孢粉图鉴[M]. 北京: 科学出版社, 2016.

[Tang Lingyu, Mao Limi, Li Chunhai, et al. An illustrated handbook of Quaternary pollen and spores in China[M]. Beijing: Science Press, 2016.]

[39]
席以珍, 宁建长. 中国干旱半干旱地区花粉形态研究[J]. 玉山生物学报, 1994, 11: 119-191.

[Xi Yizhen, Ning Jianchang. Study on pollen morphology of plants from dry and semidry area in China[J]. Yunshania, 1994, 11: 119-191.]

[40]
Hijmans R J, Cameron S E, Parra J L, et al. Very high resolution interpolated climate surfaces for global land areas[J]. International Journal of Climatology, 2005, 25(15): 1965-1978.

[41]
Prentice I C. Multidimensional scaling as a research tool in Quaternary palynology: A review of theory and methods[J]. Review of Palaeobotany and Palynology, 1980, 31: 71-104.

[42]
Lepš J, Šmilauer P. Multivariate analysis of ecological data using CANOCO[M]. Cambridge: Cambridge University Press, 2003.

[43]
ter Braak C J F, Prentice I C. A theory of gradient analysis[C]// Begon M, FitterA H, FordE D, et al. Advances in Ecological Research. Cambridge: Academic Press, 1988.

[44]
Pan Y F, Yan S, Behling H, et al. Transport of airborne Picea schrenkiana pollen on the northern slope of Tianshan Mountains (Xinjiang, China) and its implication for paleoenvironmental reconstruction[J]. Aerobiologia, 2012, 29(2): 161-173.

[45]
Li W. On dispersal efficiency of Picea pollen[J]. Journal of Integrative Plant Biology, 1991, 33(10): 792-800.

[46]
Zhao Y, Liu H Y, Li F R, et al. Application and limitations of the Artemisia/Chenopodiaceae pollen ratio in arid and semi-arid China[J]. The Holocene, 2012, 22(12): 1385-1392.

[47]
El-Moslimany A P. Ecological significance of common nonarboreal pollen: Examples from drylands of the Middle-East[J]. Review of Palaeobotany and Palynology, 1990, 64(1-4): 343-350.

[48]
Li Q, Lu H Y, Zhu L P, et al. Pollen-inferred climate changes and vertical shifts of alpine vegetation belts on the northern slope of the Nyainqentanglha Mountains (central Tibetan Plateau) since 8.4 kyr BP[J]. The Holocene, 2011, 21(6): 939-950.

[49]
Zhao Y, Herzschuh U. Modern pollen representation of source vegetation in the Qaidam Basin and surrounding mountains, north-eastern Tibetan Plateau[J]. Vegetation History and Archaeobotany, 2009, 18: 245-260.

[50]
Qin F. Modern pollen assemblages of the surface lake sediments from the steppe and desert zones of the Tibetan Plateau[J]. Science China Earth Sciences, 2021, 64: 425-439.

Outlines

/