
Dynamic evolution and zoning control of cultivated land non-grain in grain production and marketing balance area: A case of Shaanxi Province
Received date: 2024-02-27
Revised date: 2024-04-30
Online published: 2026-03-11
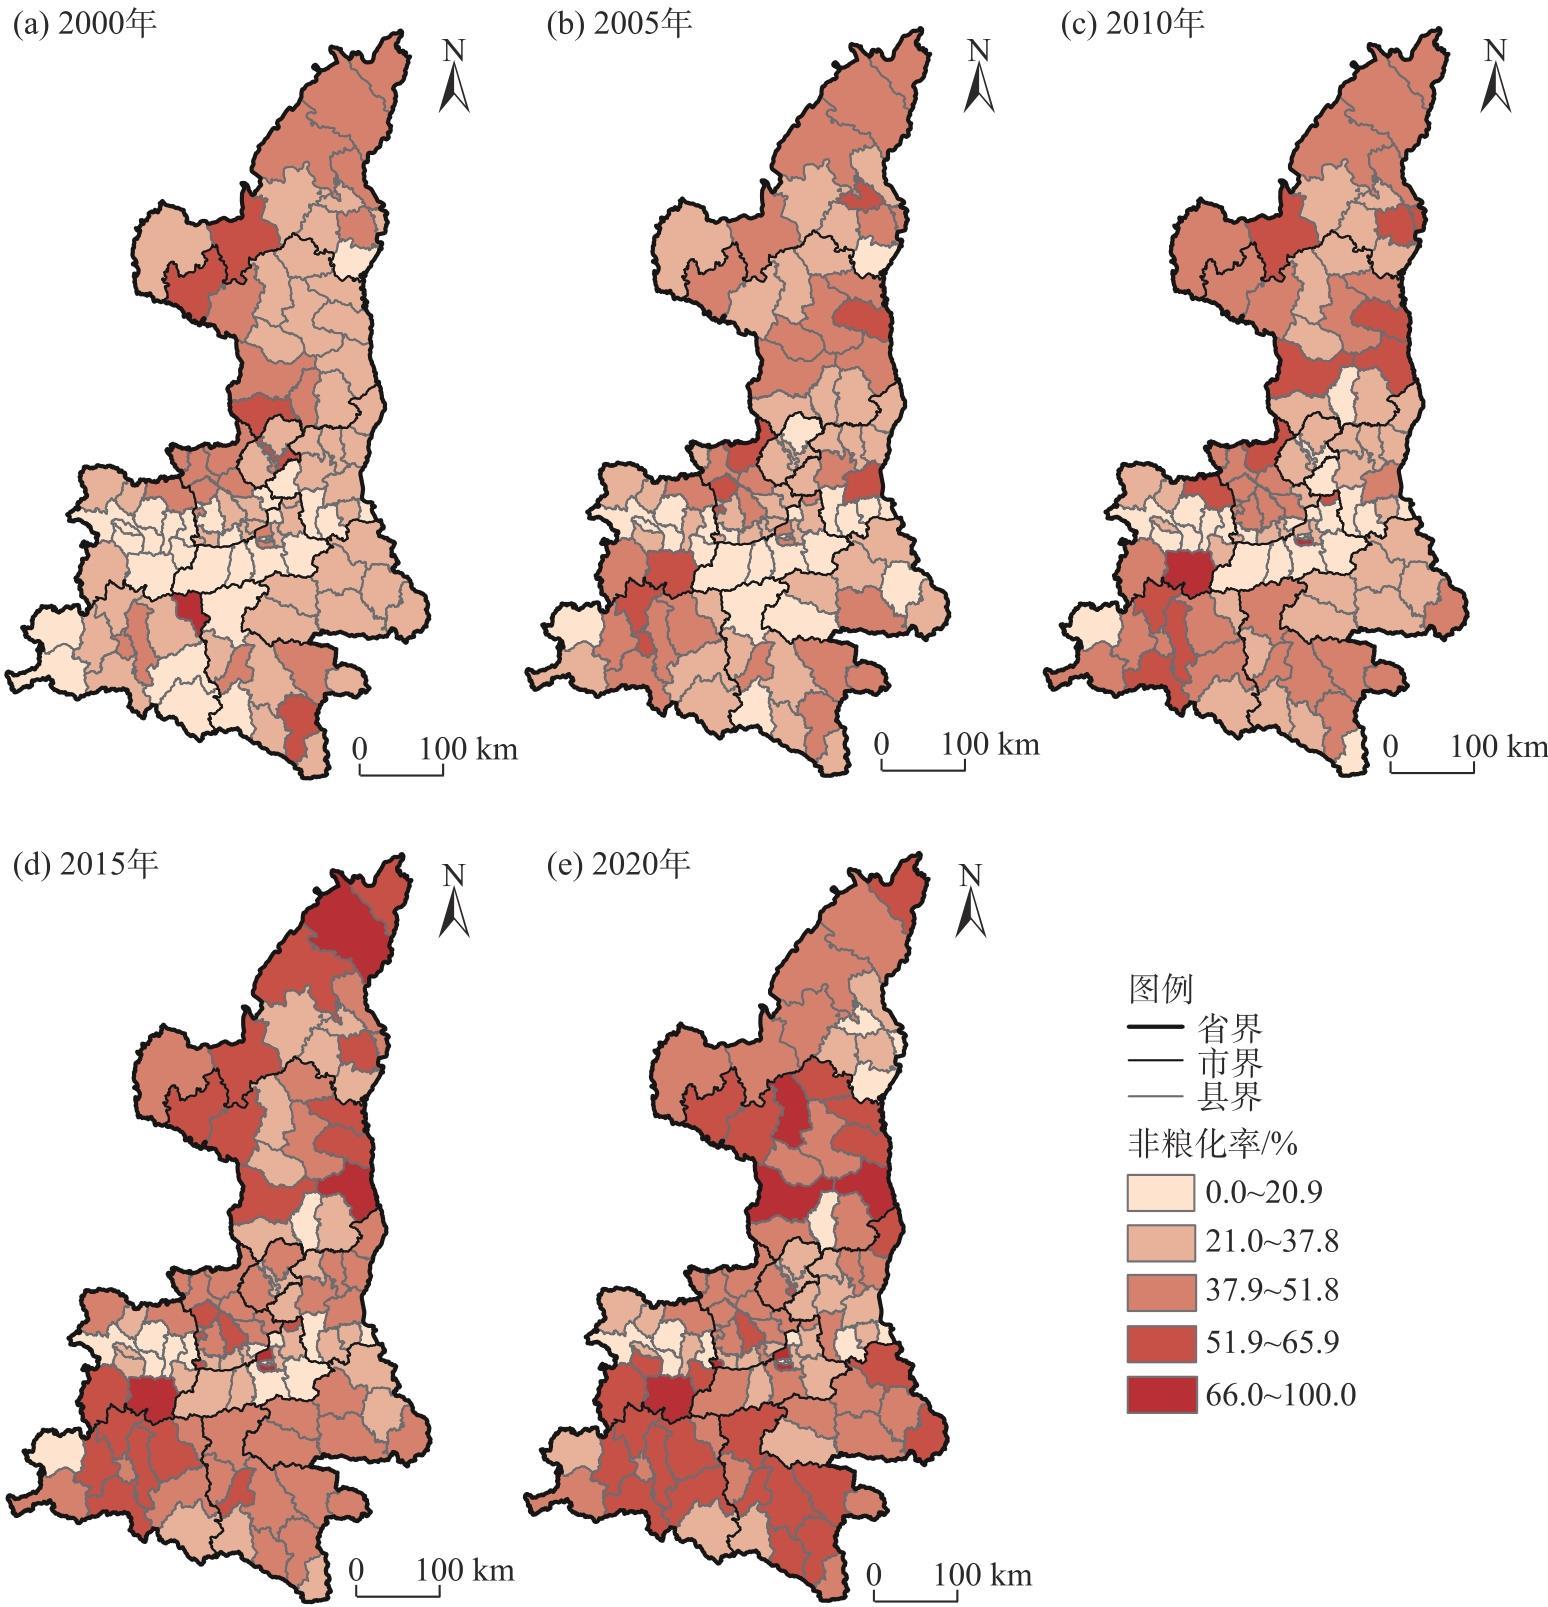
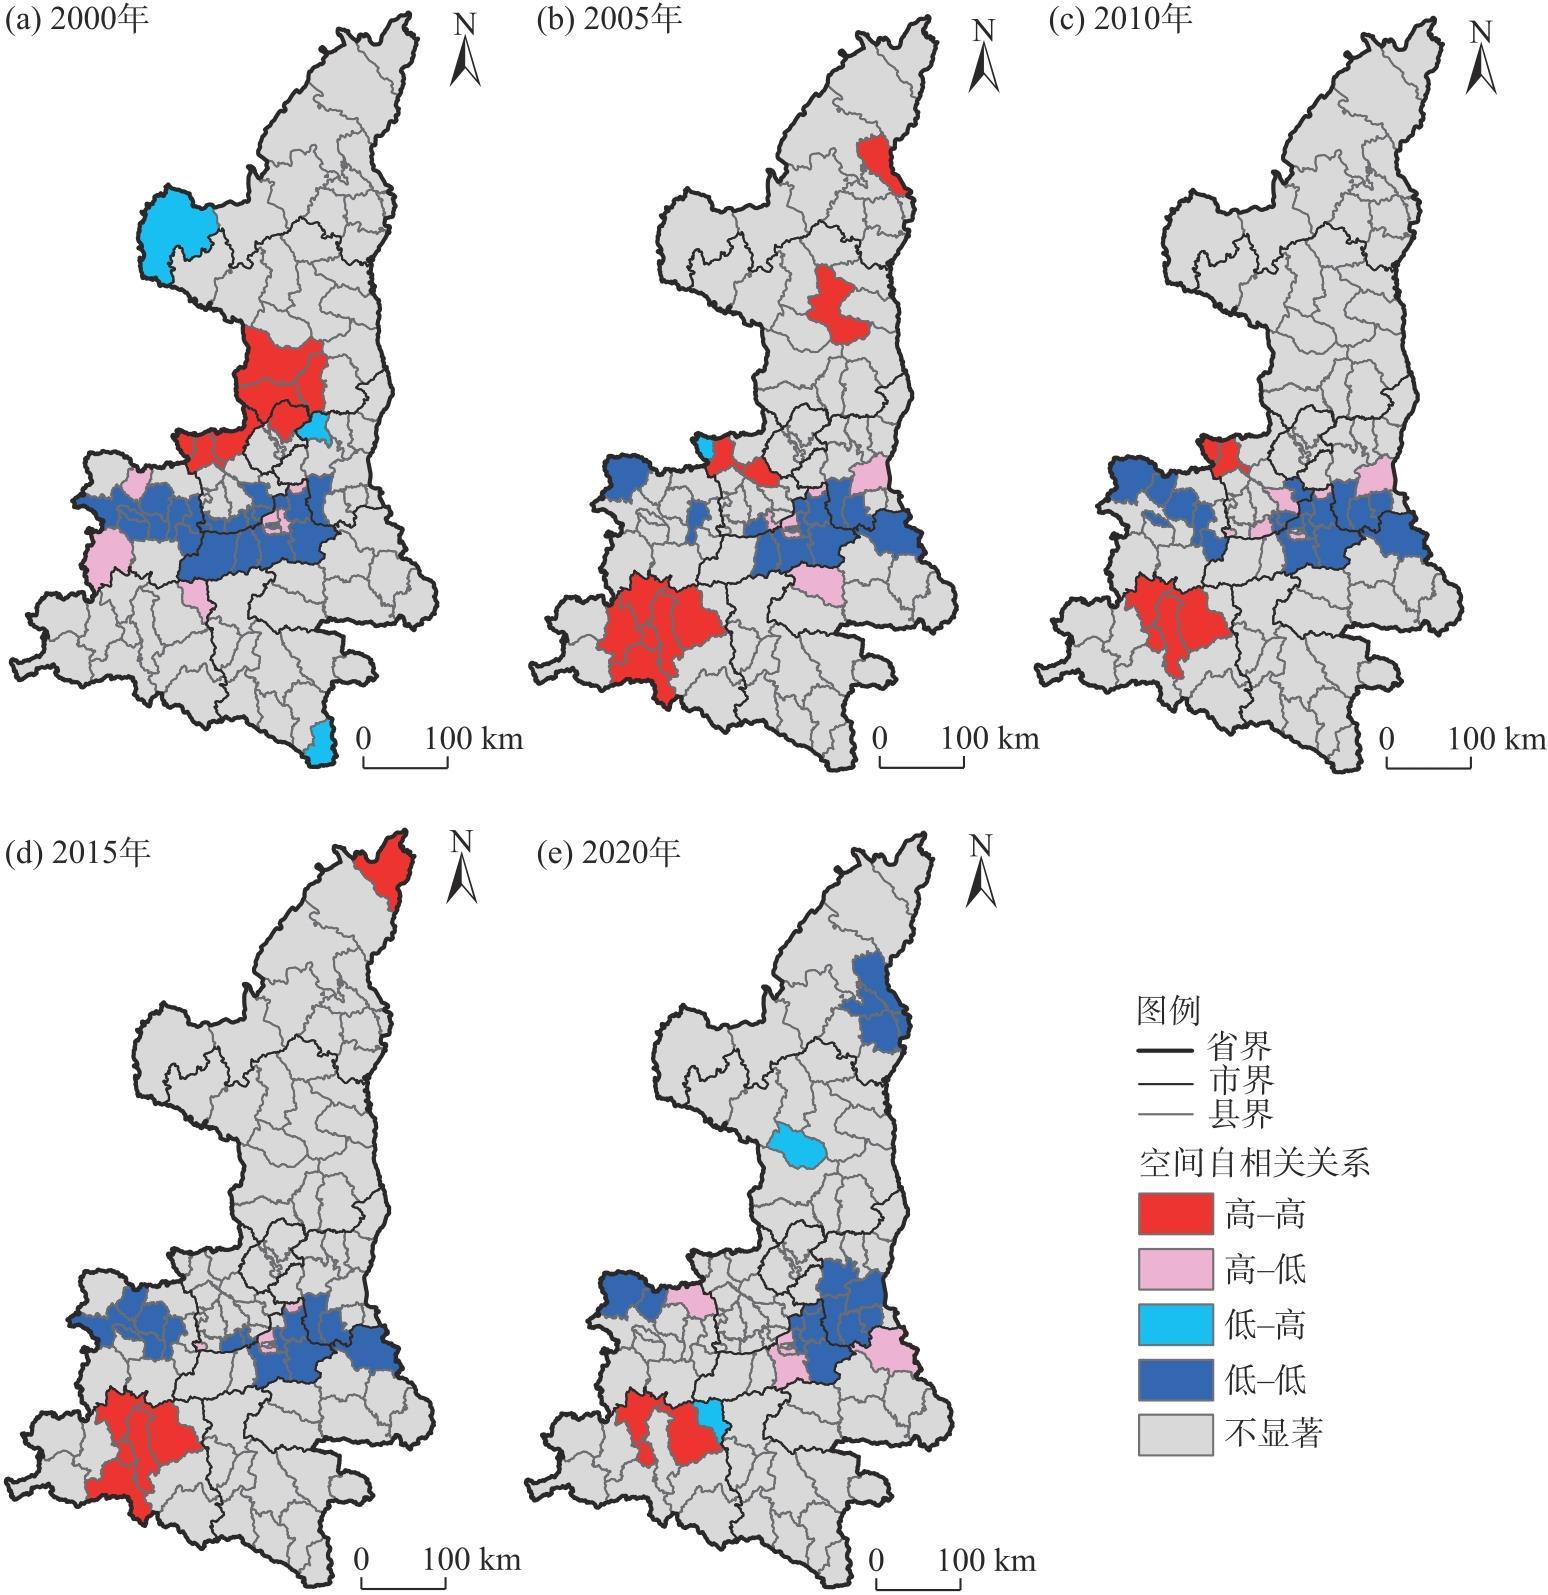
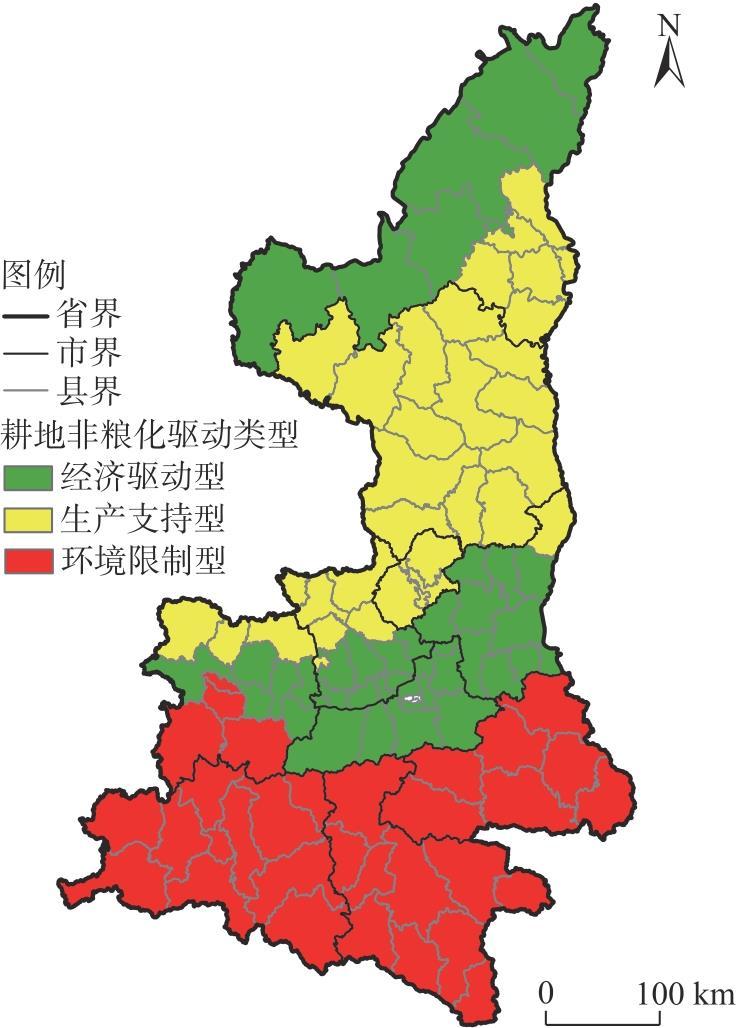
Exploring the spatial and temporal evolution characteristics and driving factors of cultivated land non-grain in grain production and marketing balance areas is crucial for providing references for differentiated control measures and long-term management strategies. This study employs spatial autocorrelation models, spatio-temporal geographically weighted regression models, K-means algorithms, and other methods to investigate the spatio-temporal evolution of cultivated land non-grain and its driving factors in Shaanxi Province, China, from 2000 to 2020. The results reveal the following: (1) The non-grain rate of cultivated land in Shaanxi Province increased from 16.11% in 2000 to 27.87% in 2020, representing a 73.00% rise. (2) The spatial distribution of non-grain in the province followed a pattern of “high in the north-south and low in the center.” The center of “high-high agglomeration” shifted gradually from the junction of the Guanzhong region and the northern region to the southern region of Shaanxi Province. Meanwhile, the “low-low agglomeration” was primarily concentrated in the Guanzhong region, exhibiting a diffusion trend from the center to surrounding areas. (3) The influence and scope of driving factors for cultivated land non-grain display significant spatio-temporal heterogeneity. The added value of the primary industry showed an increasing influence on cultivated land non-grain, while factors such as per capita cultivated land area, per capita mechanical labor force, average land slope, and annual precipitation demonstrated a decreasing influence. (4) The non-grain driving type of cultivated land in Shaanxi Province is mainly economic-driven, which is mainly distributed in Guanzhong region. Promoting the cost reduction and income increase of grain farmers and reducing the loss of rural population are the key points of control strategies. The types of production support are mainly distributed in the northern region, and the control strategies are mainly to improve the grain planting conditions and promote the development of the agricultural economy. The environmental restriction types are mainly distributed in the southern region of Shaanxi Province, and the combination measure of policy guidance and control strategies is the governance mode.
Yifan WU , Peixue XING , Weiwei ZHENG , Xianli XIA , Chaozheng ZHANG . Dynamic evolution and zoning control of cultivated land non-grain in grain production and marketing balance area: A case of Shaanxi Province[J]. Arid Land Geography, 2025 , 48(1) : 153 -167 . DOI: 10.12118/j.issn.1000-6060.2024.121
表1 耕地非粮化驱动因子指标体系Tab. 1 Index system of driving factors for non-grain of cultivated land |
| 维度 | 因子 | 单位 | 预期符号 |
|---|---|---|---|
| 社会经济 | 一产增加值(X1) | 108元 | + |
| 农村居民可支配收入(X2) | 元 | ± | |
| 乡村人口数(X3) | 104人 | + | |
| 生产条件 | 人均耕地面积(X4) | hm2·人-1 | ± |
| 人均机械劳动力(X5) | kW·人-1 | + | |
| 路网密度(X6) | km·km-2 | + | |
| 自然禀赋 | 平均坡度(X7) | (°) | + |
| 年降水量(X8) | mm | ± | |
| 年均气温(X9) | °C | + |
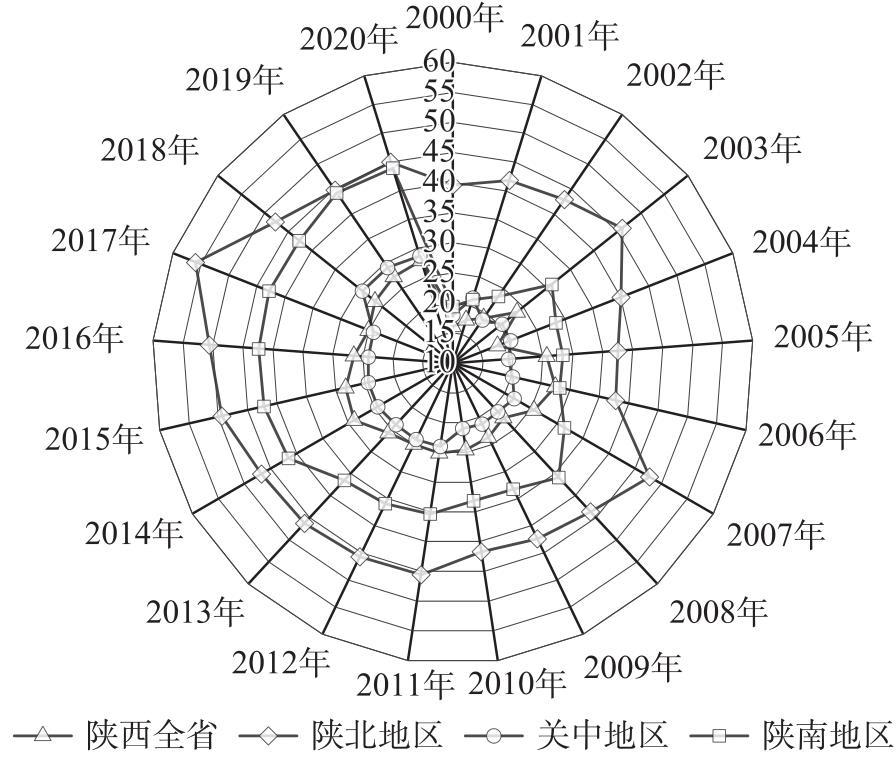
图2 2000—2020年陕西省及各分区耕地非粮化率年际变化Fig. 2 Interannual variations of non-grain rates of cultivated land in Shaanxi Province and its sub-regions from 2000 to 2020 |
表2 全局莫兰指数Tab. 2 Global Moran’s I index |
| 年份 | 全局莫兰指数 | P值 |
|---|---|---|
| 2000 | 0.283 | 0.001 |
| 2005 | 0.224 | 0.001 |
| 2010 | 0.144 | 0.025 |
| 2015 | 0.090 | 0.078 |
| 2020 | 0.123 | 0.021 |
表3 回归模型拟合结果Tab. 3 Fitting results of regression model |
| 维度 | 自变量 | 回归系数 | 标准误 | P值 | 方差膨胀因子(VIF) |
|---|---|---|---|---|---|
| 社会经济 | 一产增加值(X1) | 0.160 | 0.032 | 0.000*** | 1.967 |
| 农村居民可支配收入(X2) | 0.483 | 0.058 | 0.000*** | 1.578 | |
| 乡村人口数(X3) | -0.095 | 0.020 | 0.000*** | 1.808 | |
| 生产条件 | 人均耕地面积(X4) | 0.380 | 0.043 | 0.000*** | 1.917 |
| 人均机械劳动力(X5) | -0.472 | 0.084 | 0.000*** | 1.522 | |
| 路网密度(X6) | 0.245 | 0.029 | 0.000*** | 1.698 | |
| 自然禀赋 | 平均坡度(X7) | 0.132 | 0.012 | 0.000*** | 2.010 |
| 年降水量(X8) | -0.072 | 0.021 | 0.001*** | 1.635 | |
| 年均气温(X9) | -0.063 | 0.022 | 0.005*** | 1.804 |
注:***、**和*分别代表在1.0%、5.0%和10%水平上显著相关。 |
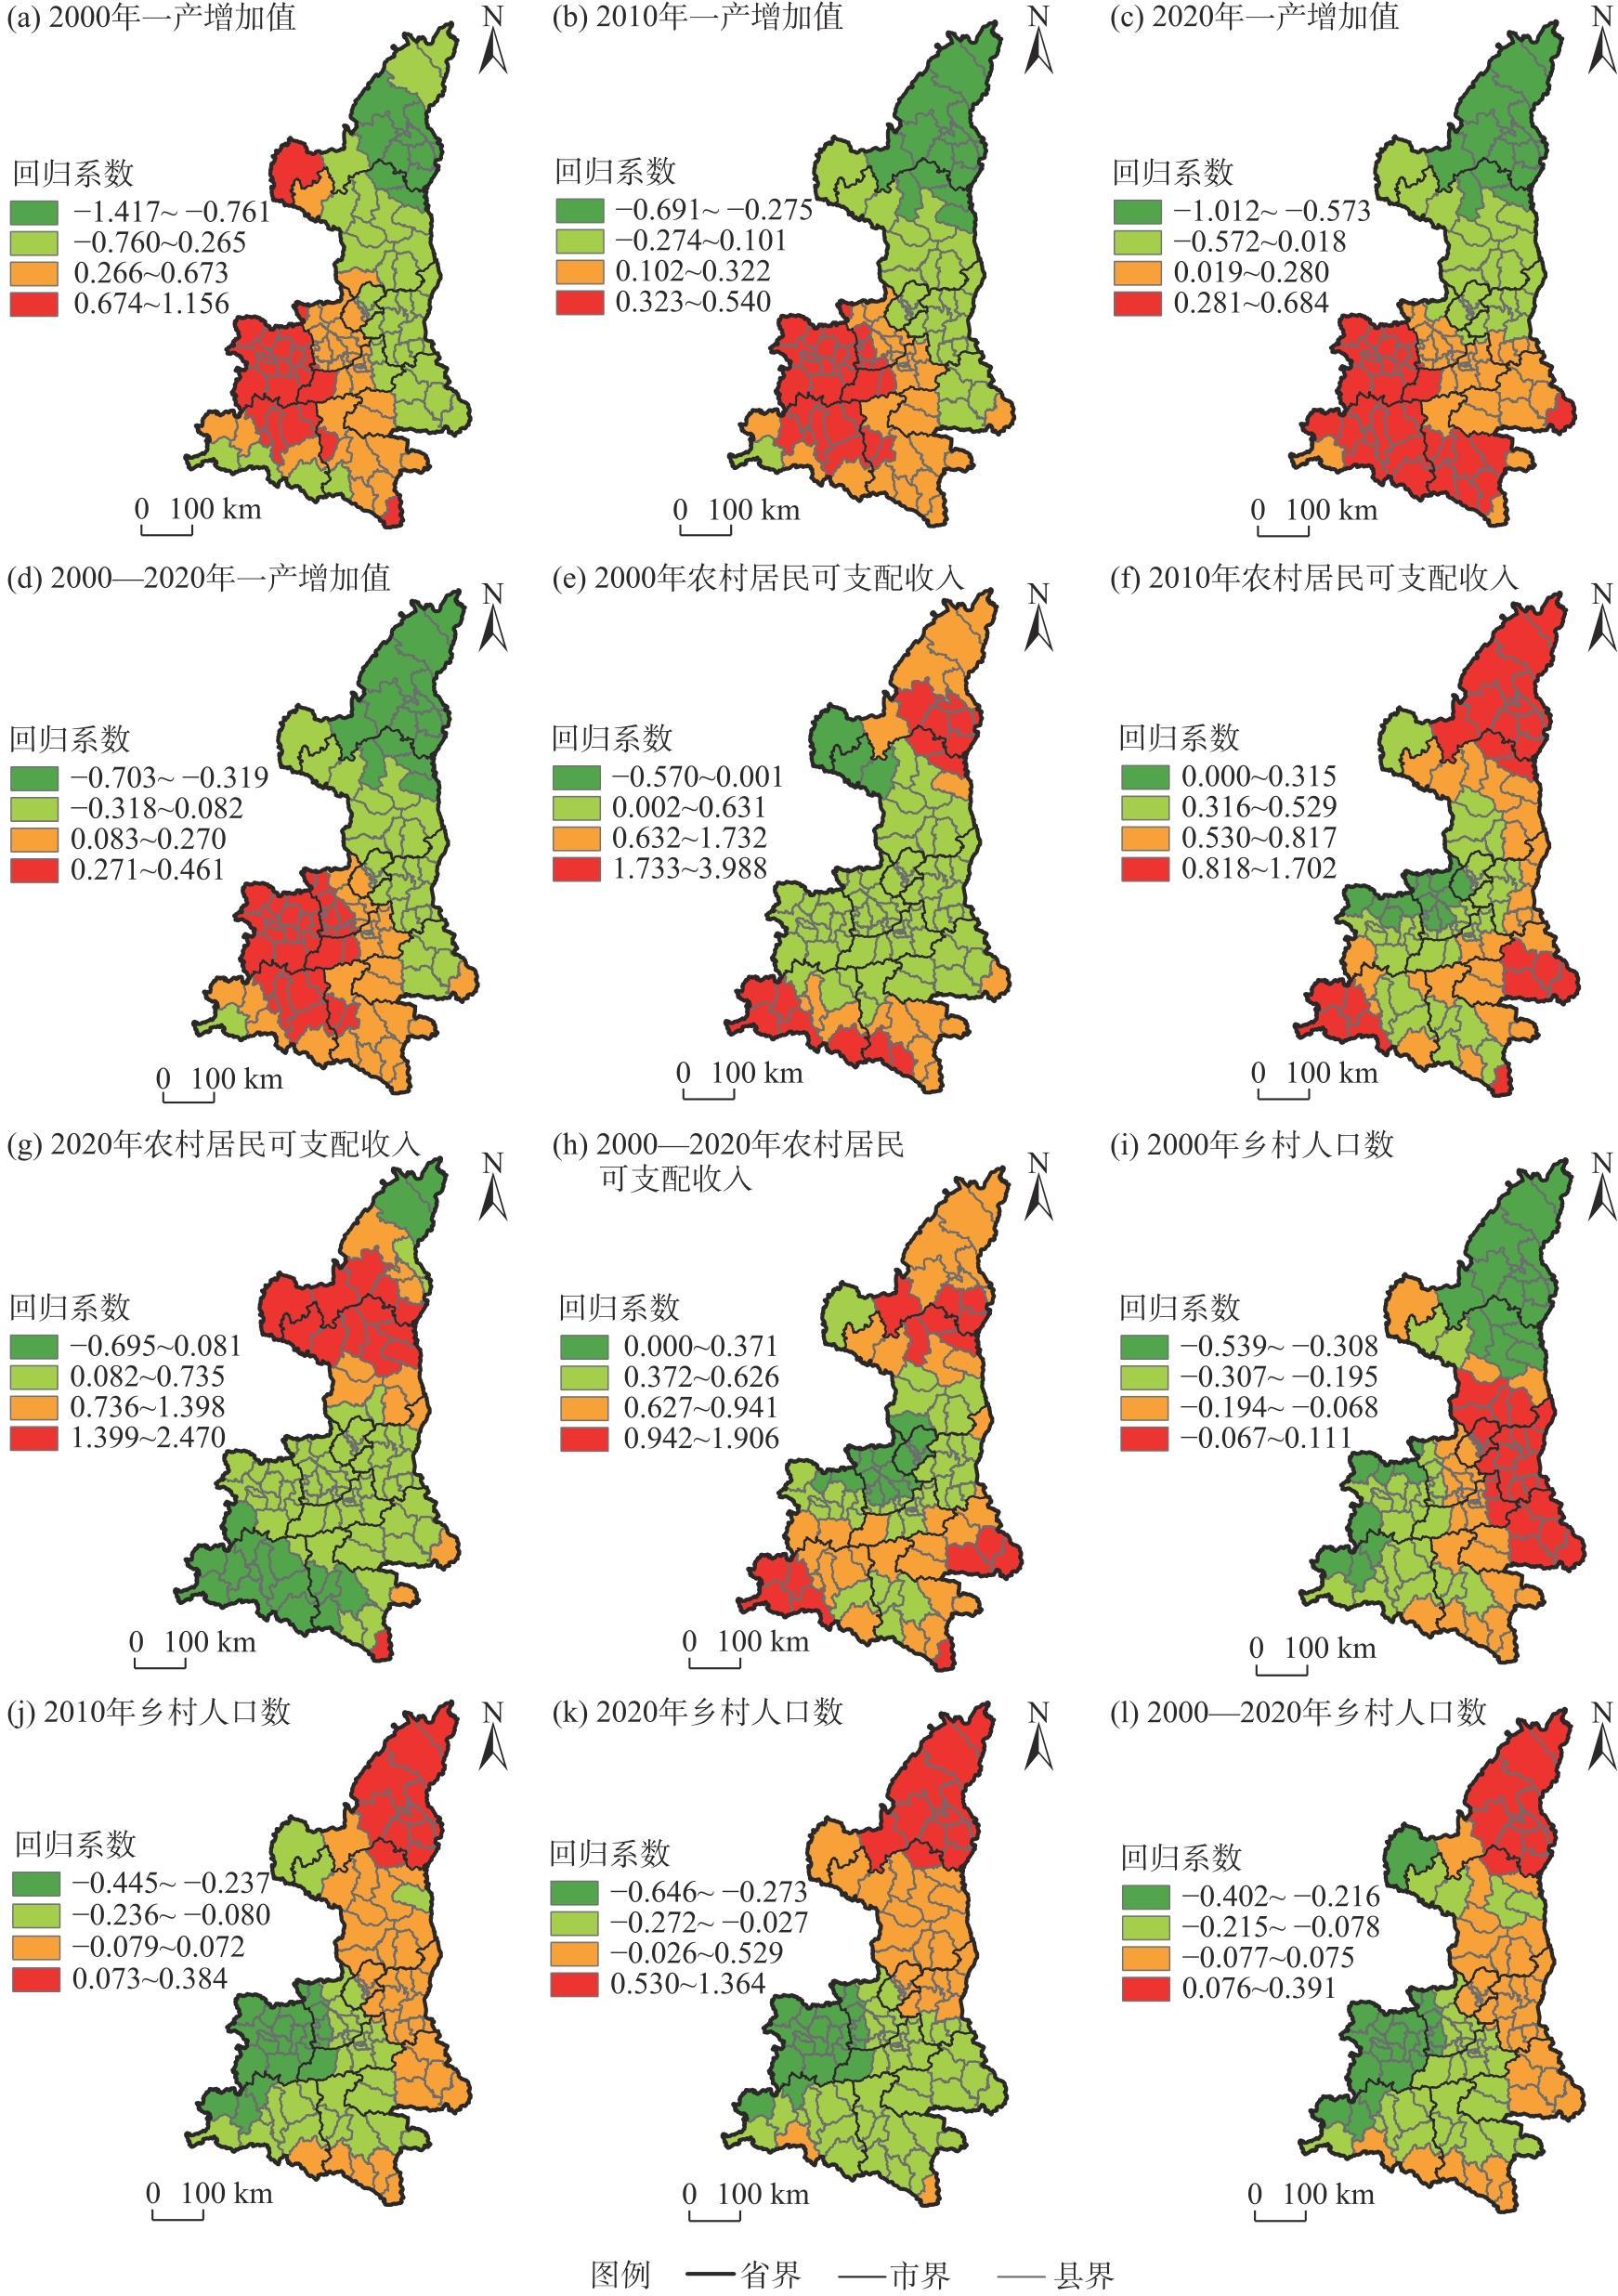
图5 社会经济维度指标GTWR模型回归结果Fig. 5 GTWR model regression results for the socio-economic dimension indicators |
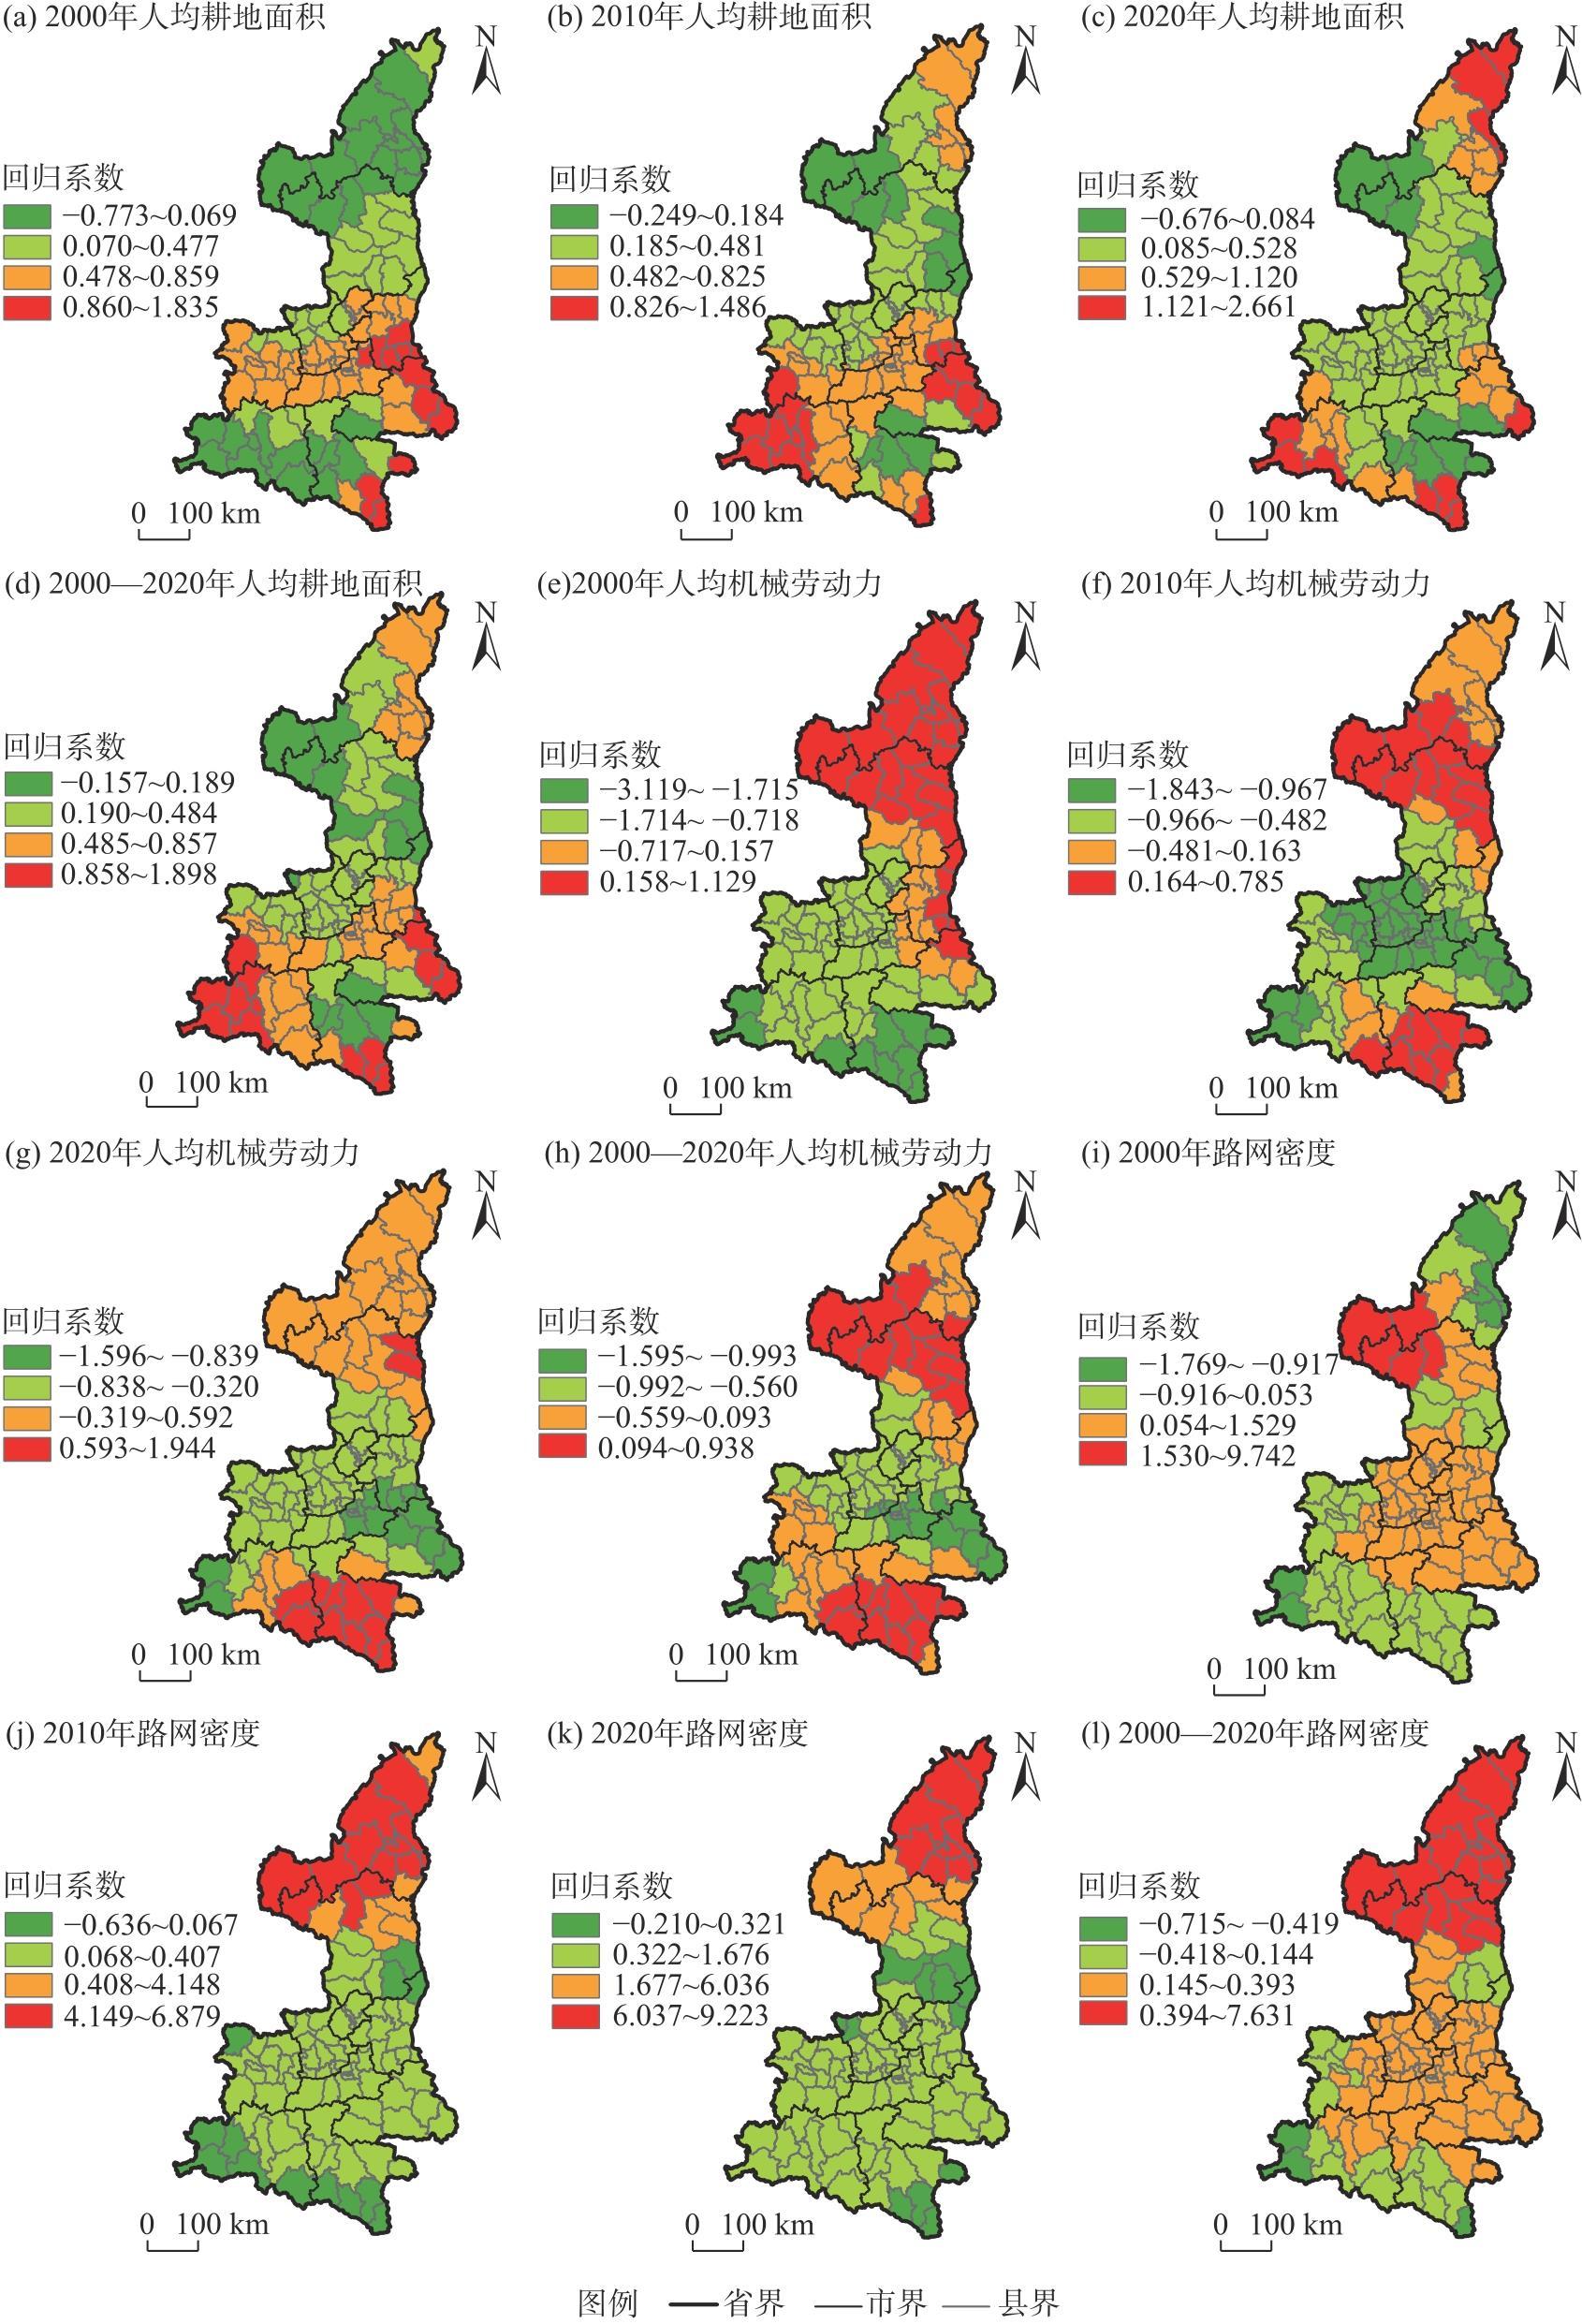
图6 生产条件维度指标GTWR模型回归结果Fig. 6 GTWR model regression results for the production conditions dimension indicators |
表4 成分矩阵Tab. 4 Component matrix |
| 影响因子 | 第一主成分 | 第二主成分 | 第三主成分 |
|---|---|---|---|
| 一产增加值(X1) | 0.346 | -0.153 | 0.277 |
| 农村居民可支配收入(X2) | -0.369 | 0.065 | 0.253 |
| 乡村人口数(X3) | 0.368 | -0.237 | 0.226 |
| 人均耕地面积(X4) | 0.223 | 0.374 | -0.049 |
| 人均机械劳动力(X5) | 0.063 | 0.353 | 0.046 |
| 路网密度(X6) | -0.486 | -0.049 | 0.222 |
| 平均坡度(X7) | -0.042 | -0.113 | -0.337 |
| 年降水量(X8) | -0.089 | -0.309 | -0.189 |
| 年均气温(X9) | 0.025 | 0.105 | -0.037 |
| [1] |
龙小翠, 刘京, 徐仲炜, 等. 陕西渭北旱塬区县域耕地时空变化及其对粮食生产影响[J]. 干旱区地理, 2022, 45(2): 423-434.
[
|
| [2] |
廖富洲, 廖婧怡, 杨程. 耕地流转中的“非粮化”问题及对策研究[J]. 学习论坛, 2015, 31(7): 37-40.
[
|
| [3] |
丁金梅, 杨奎, 马彩虹, 等. 中国粮食产量时空格局演变研究[J]. 干旱区地理, 2017, 40(6): 1290-1297.
[
|
| [4] |
姚成胜, 杨一单, 殷伟. 三大区域粮食安全责任共担的角色定位与推进路径——基于中国省域口粮自给率差异视角[J]. 经济学家, 2023(6): 100-109.
[
|
| [5] |
华树春, 钟钰. 我国粮食区域供需平衡以及引发的政策启示[J]. 经济问题, 2021(3): 100-107.
[
|
| [6] |
毕雪昊, 周佳宁, 邹伟. 家庭劳动力约束下经营规模对农户种植结构选择的影响[J]. 中国土地科学, 2020, 34(12): 68-77.
[
|
| [7] |
王勇, 陈印军, 易小燕, 等. 耕地流转中的“非粮化”问题与对策建议[J]. 中国农业资源与区划, 2011, 32(4): 13-16.
[
|
| [8] |
祝洪章. 农地流转“非粮化”及对粮食安全影响研究述评[J]. 人民论坛, 2016(17): 82-84.
[
|
| [9] |
罗必良, 江雪萍, 李尚蒲, 等. 农地流转会导致种植结构“非粮化”吗[J]. 江海学刊, 2018(2): 94-101, 238.
[
|
| [10] |
戚渊, 李瑶瑶, 朱道林. 农地资本化视角下的耕地非粮化研究[J]. 中国土地科学, 2021, 35(8): 47-56.
[
|
| [11] |
檀竹平, 洪炜杰, 罗必良. 农业劳动力转移与种植结构“趋粮化”[J]. 改革, 2019(7): 111-118.
[
|
| [12] |
冷智花, 行永乐, 钱龙. 农业劳动力性别结构对粮食生产的影响——基于CFPS数据的实证分析[J]. 财贸研究, 2020, 31(12): 36-48.
[
|
| [13] |
谢雨琦, 王子芳, 王颖, 等. 重庆丘陵山区耕地非粮化时空变异及驱动类型划分[J]. 农业资源与环境学报, 2024, 41(1): 15-26.
[
|
| [14] |
常媛媛, 刘俊娜, 马静, 等. 干旱半干旱区耕地非粮化空间格局及驱动因素[J]. 农业资源与环境学报, 2023, 40(2): 333-344.
[
|
| [15] |
|
| [16] |
张颖诗, 冯艳芬, 王芳, 等. 广东省耕地非粮化的时空分异及其驱动机制[J]. 资源科学, 2022, 44(3): 480-493.
[
|
| [17] |
孟菲, 谭永忠, 陈航, 等. 中国耕地“非粮化”的时空格局演变及其影响因素[J]. 中国土地科学, 2022, 36(1): 97-106.
[
|
| [18] |
张惠中, 宋文, 张文信, 等. 山东省耕地“非粮化”空间分异特征及其影响因素分析[J]. 中国土地科学, 2021, 35(10): 94-103.
[
|
| [19] |
常媛媛, 刘俊娜, 张琦, 等. 粮食主产区耕地非粮化空间格局分异及其成因[J]. 农业资源与环境学报, 2022, 39(4): 817-826.
[
|
| [20] |
位佳佳, 陈学渊, 吴永常, 等. 西北旱区耕地“非粮化”时空演变分析——以陕西大荔为例[J]. 中国农业资源与区划, 2023, 44(4): 24-34.
[
|
| [21] |
张婕, 刘玉洁, 张二梅, 等. 中国县域耕地动态演变及其驱动机制[J]. 地理学报, 2023, 78(9): 2105-2127.
[
|
| [22] |
宋戈, 白小艳, 高佳. 粮食产销平衡区耕地非粮化负外部效益空间分布特征[J]. 水土保持研究, 2018, 25(1): 349-355.
[
|
| [23] |
陈百明, 周小萍. 中国粮食自给率与耕地资源安全底线的探讨[J]. 经济地理, 2005, 25(2): 145-148.
[
|
| [24] |
孔祥斌. 当前耕地保护面临的问题分析及对策研究[J]. 中国土地, 2020(12): 4-7.
[
|
| [25] |
彭继权, 吴海涛, 程威特, 等. 机械化水平对农户种植结构的影响研究——基于IVGMM和IVTobit的估计方法[J]. 中国农业资源与区划, 2020, 41(1): 55-65.
[
|
| [26] |
吴大放, 吴钊骏, 李升发, 等. 粤北山区耕地非粮化演变特征及其影响因素[J]. 经济地理, 2023, 43(8): 144-153.
[
|
| [27] |
姚小薇, 曾杰, 李旺君. 武汉城市圈城镇化与土地生态系统服务价值空间相关特征[J]. 农业工程学报, 2015, 31(9): 249-256.
[
|
| [28] |
|
| [29] |
褚晓彤, 王跃朋, 周建. 关中地区耕地显性与隐性非粮化的时空变化及对粮食产量的影响[J]. 农业工程学报, 2023, 39(19): 241-249.
[
|
| [30] |
马理辉, 刘晓丽, 刘根全, 等. 陕北山地苹果产业发展的问题与新思路[J]. 陕西林业科技, 2019, 47(3): 73-77.
[
|
| [31] |
王鹏程, 张利国, 卢玉兰, 等. 广西耕地“非粮化”时空演变及影响因素研究[J]. 中国农业资源与区划, 2023, 44(5): 187-197.
[
|
| [32] |
刘媛, 樊志民. 近代关中种植业结构的商品化选择与隐性危机应对[J]. 西北农林科技大学学报(社会科学版), 2017, 17(3): 120-126.
[
|
/
| 〈 |
|
〉 |