
Practice of high quality development in Xinjiang: Construction and measurement of evaluation system
Received date: 2024-02-04
Revised date: 2024-03-25
Online published: 2026-03-11
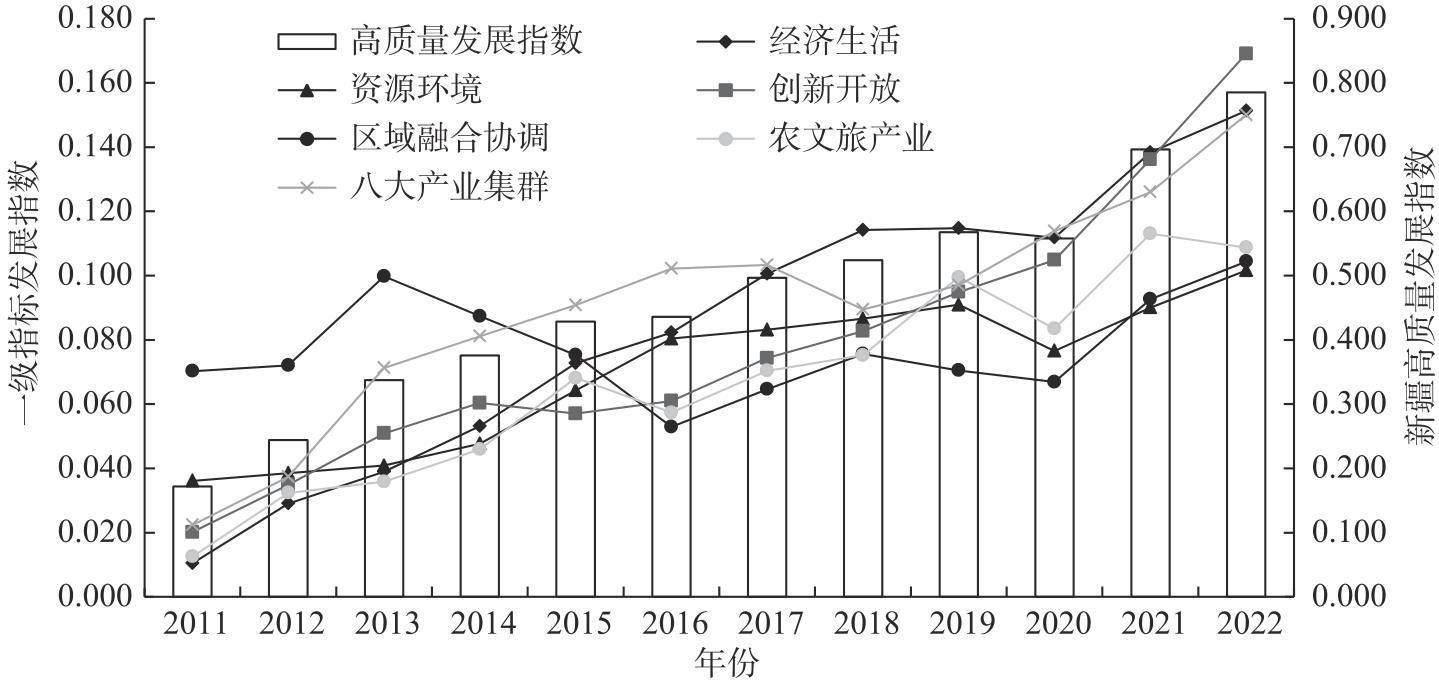
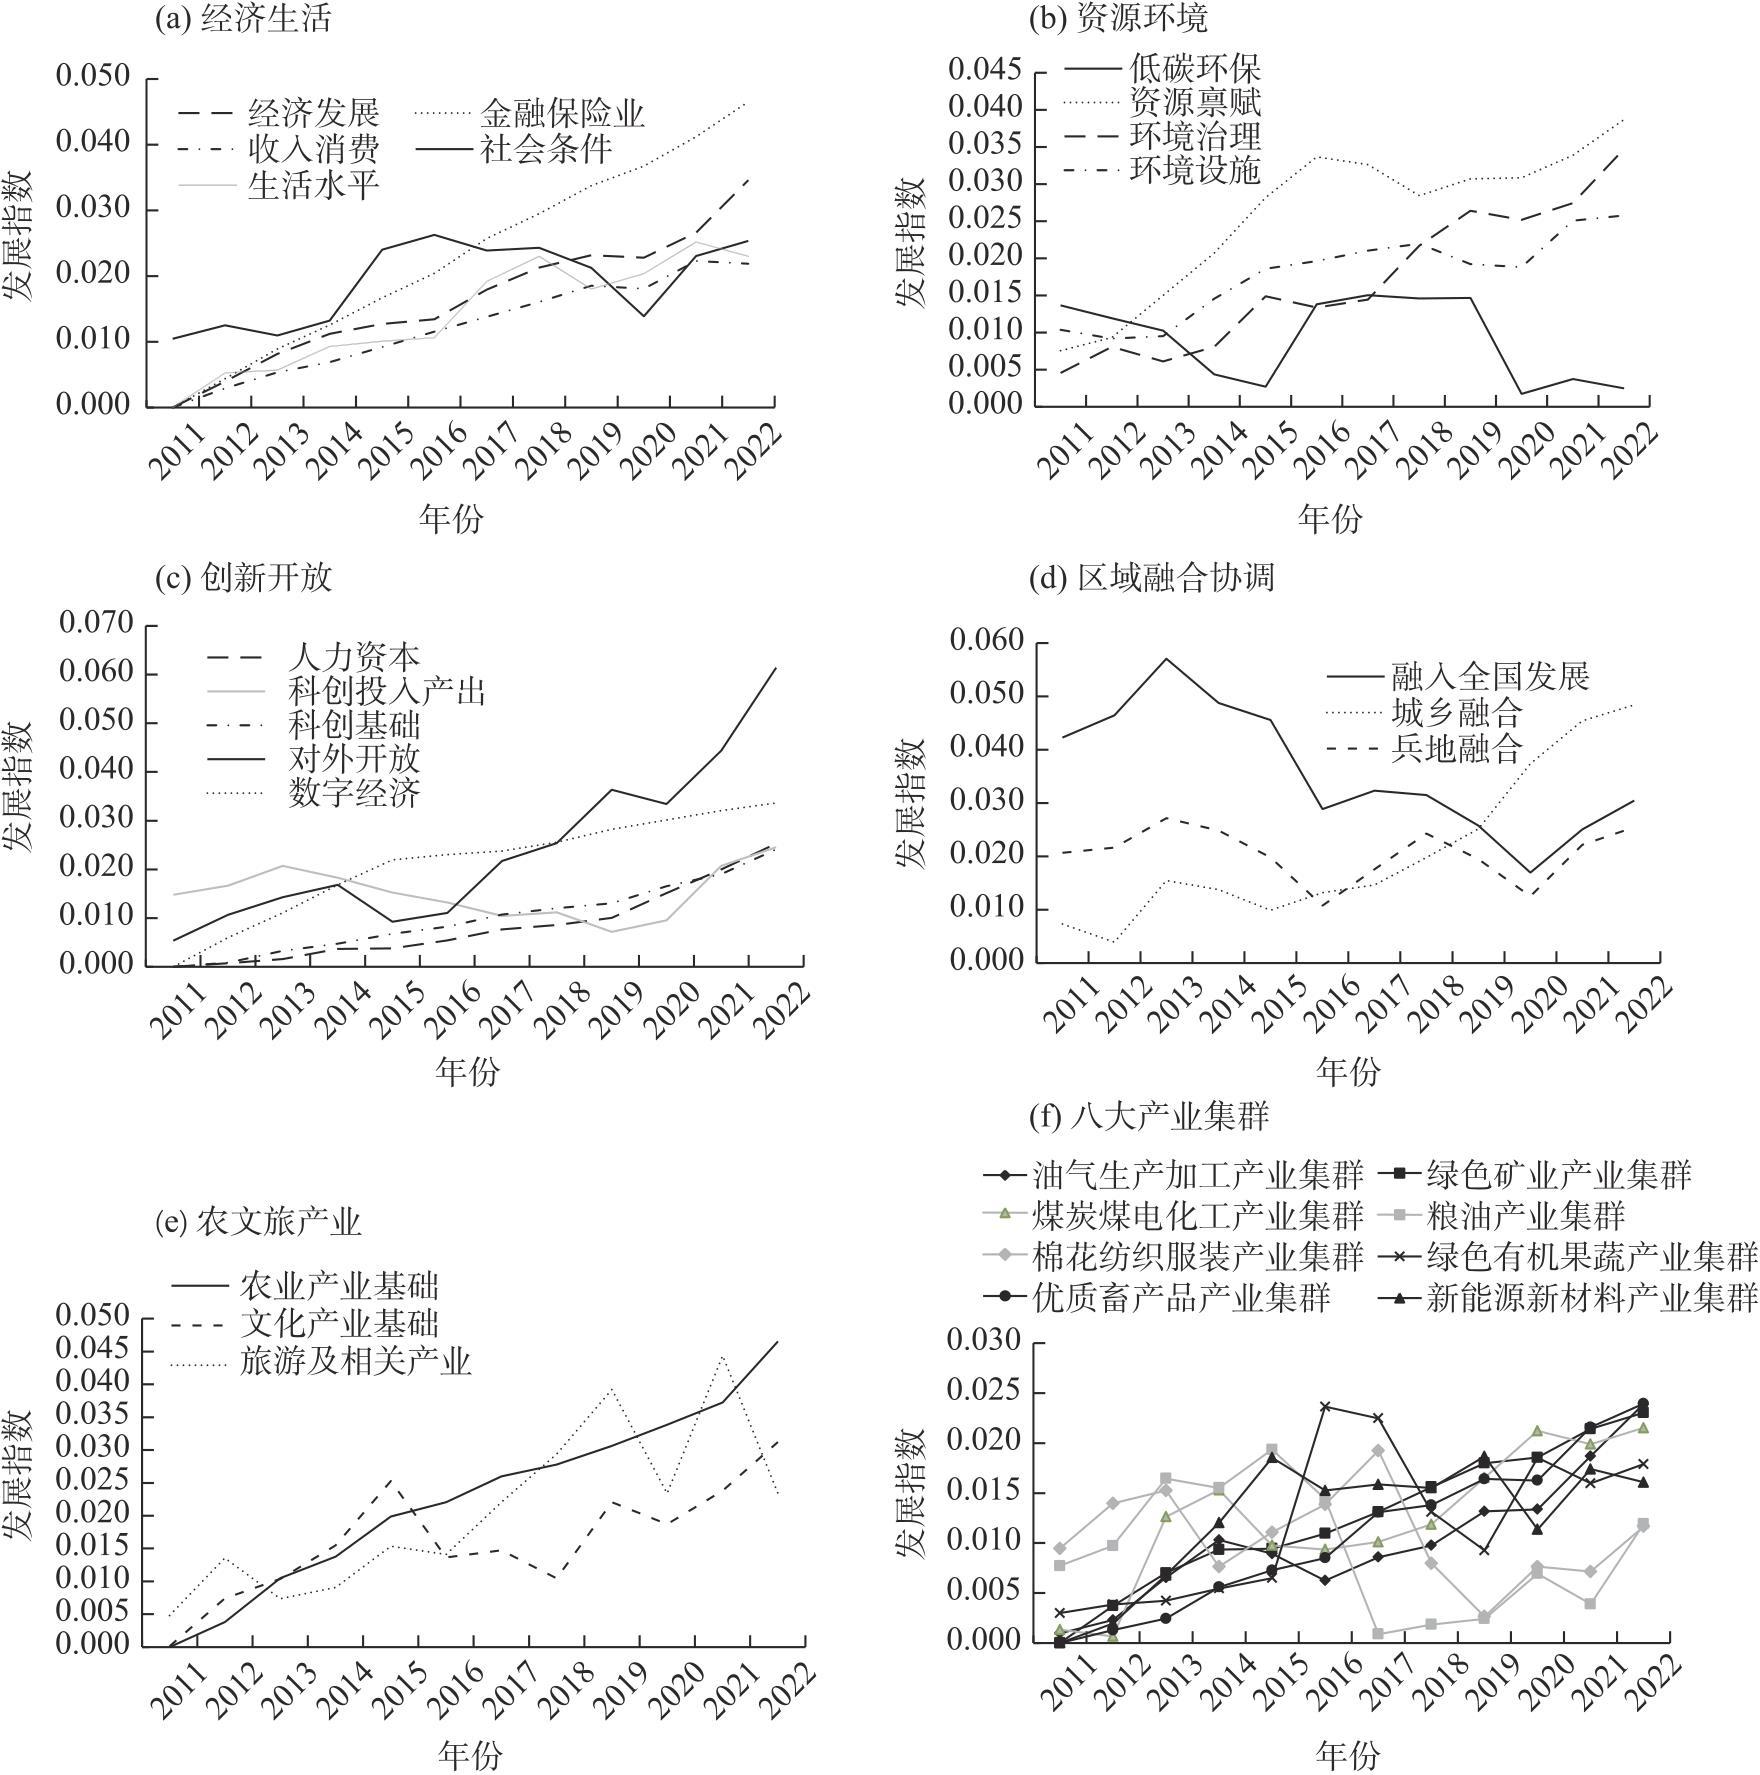
High-quality development is the cornerstone of building a modern socialist country. To advance high-quality development in Xinjiang, China, and accelerate its modernization, there is an urgent need for a scientific and rational evaluation index system to both reflect and guide progress. This study constructs a high-quality development evaluation index system for Xinjiang, incorporating primary indicators such as economic life, resource environment, innovation and opening up, regional integration and coordination, agricultural and cultural tourism industries, and eight major industrial clusters. Using the entropy method, the high-quality development index of Xinjiang is estimated. The coupling coordination degree model evaluates the degree of coordinated development of high-quality indicators in Xinjiang, while obstacle analysis identifies the factors constraining high-quality development. The findings reveal the following: (1) Xinjiang’s comprehensive high-quality development index increased from 0.172 in 2011 to 0.785 in 2022, reflecting a relatively favorable overall development level. The opening to the outside world, financial and insurance industries, economic development, and agricultural, cultural, and tourism industries have made increasingly significant contributions to high-quality development. However, challenges remain in the areas of science and technology input-output efficiency, human capital, the development gap with the national average, and low-carbon development. (2) The coupling coordination degree of Xinjiang’s high-quality development improved from 0.365 in 2011 to 0.883 in 2022, indicating strong inter-indicator correlation and a virtuous cycle. Between 2011 and 2014, the coupling and coordination degree of first-class indicators increased by 0.0715 per year, 0.0384 higher than the growth rate observed from 2015 to 2022, signaling a gradual slowdown. The degree of collaborative development between the two primary indicators, namely regional integration coordination and resource environment, is relatively low. (3) Analysis of indicators with obstacle values exceeding 0.05 over the years identifies forest coverage, natural gas production, added value of the financial industry, daily per capita domestic water consumption in cities, urban sewage treatment capacity, RMB deposits of financial institutions, registered urban unemployment rates, green coverage of built-up areas, rural electricity consumption, and reductions in chemical fertilizer use as key factors restricting Xinjiang’s high-quality development. To address these constraints, the study proposes optimizing the allocation of scientific and technological resources, enhancing the efficiency of technological investments, leveraging latecomer advantages, accelerating integration into national strategies, deepening supply-side structural reforms, and promoting industrial structural transformation.
Gang LI . Practice of high quality development in Xinjiang: Construction and measurement of evaluation system[J]. Arid Land Geography, 2025 , 48(1) : 143 -152 . DOI: 10.12118/j.issn.1000-6060.2024.079
表1 新疆高质量发展评估指标体系Tab. 1 Evaluation index system for high-quality development in Xinjiang |
| 一级指标(代码) | 二级指标(代码) | 三级指标(代码;单位;权重) |
|---|---|---|
| 经济生活(A1) | 经济发展(B1) | 人均地区生产总值(C1;元·人-1;0.0118)、地方财政一般预算收入(C2;108元;0.0112)、 地方财政一般预算支出(C3;108元;0.0116) |
| 金融保险业(B2) | 原保险保费收入(C4;108元;0.0119)、金融机构人民币存款(C5;108元;0.0116)、 金融业增加值(C6;108元;0.0115)、金融业城镇就业平均工资(C7;元;0.0117) | |
| 收入消费(B3) | 居民人均可支配收入(C8;元;0.0116)、居民人均消费支出(C9;元;0.0114) | |
| 社会条件(B4) | 总抚养比*(C10;%;0.0111)、城镇登记失业率*(C11;%;0.0121)、 城市人口密度*(C12;人·km-2;0.0120) | |
| 生活水平(B5) | 农村用电量(C13;108 kW·h;0.0129)、每百人使用计算机数(C14;台;0.0118)、 城市人均日生活用水量(C15;10-3 m3;0.0121) | |
| 资源环境(A2) | 低碳环保(B6) | 化肥施用折纯量*(C16;104 t;0.0130)、化学需氧量排放量*(C17;104 t;0.0147) |
| 资源禀赋(B7) | 人均水资源量(C18;m3·人-1;0.0122)、森林覆盖率(C19;%;0.0119)、 天然气生产量(C20;108 m3;0.0119)、电力消费量(C21;108 kW·h;0.0114) | |
| 环境治理(B8) | 地方财政环境保护支出(C22;108元;0.0122)、森林病虫鼠害防治率(C23;%;0.0113)、 城市污水日处理能力(C24;104 m3;0.0115) | |
| 环境设施(B9) | 建成区绿化覆盖率(C25;%;0.0119)、每万人拥有公共厕所(C26;座;0.0116)、 人均公园绿地面积(C27;m2·人-1;0.0119) | |
| 创新开放(A3) | 人力资本(B10) | 高等学校正高级教师数(C28;104人;0.0131)、十万人口高等学校在校生数(C29;人;0.0122) |
| 科创投入产出(B11) | 自治区重大科技成果数(C30;项;0.0118)、规模以上工业企业R&D人员全时当量(C31;人年;0.0119)、科技支出占财政比重(C32;%;0.0124) | |
| 科创基础(B12) | 科技服务业法人数(C33;个;0.0125)、科技地质勘查城镇就业平均工资(C34;元;0.0116) | |
| 对外开放(B13) | 对外非金融类直接投资存量(C35;104 USD;0.0118)、经营单位所在地进出口总额(C36;103 USD;0.0119)、境内货源地进出口总额(C37;103 USD;0.0120)、外商投资企业数(C38;户;0.0123)、外商投资企业投资总额(C39;106 USD;0.0139) | |
| 数字经济(B14) | 数字金融覆盖广度(C40;无;0.0114)、数字普惠金融指数(C41;无;0.0112)、有电子商务交易活动的企业数比重(C42;%;0.0112) | |
| 区域融合协调(A4) | 融入全国发展(B15) | 全国新疆城镇失业率比*(C43;无;0.0113)、全国新疆人均水资源比(C44;无;0.0112)、全国新疆人均粮食产量比(C45;无;0.0129)、全国新疆十万人口高等学校在校生比*(C46;无;0.0118)、全国新疆人均产值比*(C47;无;0.0120)、全国新疆居民人均消费比*(C48;无;0.0110) |
| 城乡融合(B16) | 城乡居民可支配收入比*(C49;无;0.0130)、城乡居民消费比*(C50;无;0.0128)、城乡每万人医疗机构床位数比*(C51;无;0.0112)、城镇化率(C52;%;0.0120) | |
| 兵地融合(B17) | 兵地人均地区生产总值比*(C53;无;0.0114)、兵地城乡居民可支配收入比差异绝对值*(C54;无;0.0112)、兵地第三产业就业人员占比差异绝对值*(C55;无;0.0114) | |
| 农文旅产业(A5) | 农业产业基础(B18) | 农林牧渔业总产值(C56;108元;0.0118)、农业机械总动力(C57;104 kW;0.0113)、有效灌溉面积(C58;103 hm2;0.0115)、农村发电设备容量(C59;kW;0.0119) |
| 文化产业基础(B19) | 博物馆文物藏品(C60;件·套-1;0.0116)、每万人拥有公共图书馆建筑面积(C61;m2;0.0123)、电视节目综合人口覆盖率(C62;%;0.0116)、出版印刷企业数(C63;个;0.0127)、文化体育与传媒占财政支出比重(C64;%;0.0124) | |
| 旅游及相关产业(B20) | 连锁餐饮企业营业额(C65;108元;0.0123)、住宿企业营业额(C66;108元;0.0118)、国际旅游外汇收入(C67;106 USD;0.0120)、住宿餐饮城镇私营单位平均工资(C68;元;0.0116) | |
| 八大产业集群(A6) | 油气生产加工产业集群(B21) | 原油生产量(C69;104 t;0.0123)、汽油生产量(C70;104 t;0.0117) |
| 绿色矿业产业集群(B22) | 城市天然气供气总量(C71;108 m3;0.0111)、采矿业城镇就业平均工资(C72;元;0.0119) | |
| 煤炭煤电化工产业集群(B23) | 火力发电量(C73;108 kW·h;0.0116)、焦炭生产量(C74;104 t;0.0115) | |
| 粮油产业集群(B24) | 地方财政粮油储备管理等支出(C75;108元;0.0117)、人均粮食产量(C76;kg;0.0131) | |
| 棉花纺织服装产业集群(B25) | 绵羊毛产量(C77;t;0.0125)、棉花单位面积产量(C78;kg·hm-2;0.0114) | |
| 绿色有机果蔬产业集群(B26) | 单位面积果园产量(C79;t·hm-2;0.0113)、蔬菜产量(C80;104 t;0.0123) | |
| 优质畜产品产业集群(B27) | 牛奶产量(C81;104 t;0.0123)、肉类产量(C82;104 t;0.0117) | |
| 新能源新材料产业集群(B28) | 汽车产量(C83;104辆;0.0116)、平板玻璃产量(C84;104重量箱;0.0114) |
注:*表示指标为逆向指标。 |
表2 2011—2022年新疆高质量系统及其一级指标耦合协调度Tab. 2 Coupling coordination degrees of Xinjiang high-quality system and its primary indicators from 2011 to 2022 |
| 年份 | 高质量系统 | 一级指标 | ||||||||
|---|---|---|---|---|---|---|---|---|---|---|
| 耦合度 | 耦合协调度 | 耦合度与耦合协调度差值 | A1 | A2 | A3 | A4 | A5 | A6 | ||
| 2011 | 0.774 | 0.365 | 0.409 | 0.022 | 0.465 | 0.048 | 0.620 | 0.108 | 0.095 | |
| 2012 | 0.935 | 0.478 | 0.457 | 0.382 | 0.503 | 0.344 | 0.576 | 0.428 | 0.361 | |
| 2013 | 0.928 | 0.560 | 0.368 | 0.465 | 0.520 | 0.465 | 0.773 | 0.473 | 0.564 | |
| 2014 | 0.971 | 0.604 | 0.367 | 0.547 | 0.549 | 0.544 | 0.724 | 0.534 | 0.632 | |
| 2015 | 0.990 | 0.651 | 0.339 | 0.627 | 0.603 | 0.516 | 0.661 | 0.656 | 0.669 | |
| 2016 | 0.980 | 0.654 | 0.326 | 0.667 | 0.735 | 0.548 | 0.583 | 0.603 | 0.708 | |
| 2017 | 0.990 | 0.701 | 0.289 | 0.754 | 0.750 | 0.622 | 0.641 | 0.669 | 0.644 | |
| 2018 | 0.992 | 0.721 | 0.271 | 0.805 | 0.771 | 0.658 | 0.692 | 0.679 | 0.636 | |
| 2019 | 0.991 | 0.750 | 0.241 | 0.802 | 0.787 | 0.687 | 0.673 | 0.793 | 0.633 | |
| 2020 | 0.993 | 0.744 | 0.249 | 0.785 | 0.616 | 0.733 | 0.625 | 0.725 | 0.747 | |
| 2021 | 0.996 | 0.833 | 0.163 | 0.882 | 0.713 | 0.861 | 0.750 | 0.842 | 0.762 | |
| 2022 | 0.993 | 0.883 | 0.110 | 0.919 | 0.714 | 0.960 | 0.803 | 0.820 | 0.873 | |
表3 2011—2022年新疆高质量指标障碍度高于0.05因素汇总Tab. 3 Summary of factors with obstacles above 0.05 for high-quality indicators in Xinjiang from 2011 to 2022 |
| 年份 | 障碍度 [0.05, 0.06] | 障碍度 (0.06, 0.08] | 障碍度 (0.08, 0.10] | 障碍度 (0.10, 0.20] |
|---|---|---|---|---|
| 2011 | B18、B2、B20、B16 | B19、B13 | - | - |
| 2012 | B18、B2、B7 | B13、B19、B16 | - | - |
| 2013 | B2、B18、B16 | B13、B19、B20 | - | - |
| 2014 | B16、B2、B18 | B13、B20、B19 | - | - |
| 2015 | B20、B2 | B16 | - | B13 |
| 2016 | - | B15、B19、B16、B20 | - | B13 |
| 2017 | B20、B11 | B13、B19、B15、B16 | - | - |
| 2018 | B11 | B13、B16 | B19、B15 | - |
| 2019 | B13、B16、B24 | B19、B11 | - | B15 |
| 2020 | B6、B20 | B19、B13、B11 | - | B15 |
| 2021 | B13、B25、B11 | B6、B24 | B19 | B15 |
| 2022 | B25、B11 | B5、B24 | - | B15、B6、B20、B19 |
| [1] |
蔡昉. 中国经济增长如何转向全要素生产率驱动型[J]. 中国社会科学, 2013(1): 56-71, 206.
[
|
| [2] |
田秋生. 高质量发展的理论内涵和实践要求[J]. 山东大学学报(哲学社会科学版), 2018(6): 1-8.
[
|
| [3] |
任保平. 新时代中国经济从高速增长转向高质量发展: 理论阐释与实践取向[J]. 学术月刊, 2018, 50(3): 66-74, 86.
[
|
| [4] |
赵剑波, 史丹, 邓洲. 高质量发展的内涵研究[J]. 经济与管理研究, 2019, 40(11): 15-31.
[
|
| [5] |
|
| [6] |
|
| [7] |
聂长飞, 简新华. 中国高质量发展的测度及省际现状的分析比较[J]. 数量经济技术经济研究, 2020, 37(2): 26-47.
[
|
| [8] |
|
| [9] |
|
| [10] |
方大春, 马为彪. 中国省际高质量发展的测度及时空特征[J]. 区域经济评论, 2019(2): 61-70.
[
|
| [11] |
李俊佳, 赵美风. 中国民族地区高质量发展空间演变及其影响机理[J]. 干旱区地理, 2024, 47(3): 496-505.
[
|
| [12] |
张侠, 许启发. 新时代中国省域经济高质量发展测度分析[J]. 经济问题, 2021(3): 16-25.
[
|
| [13] |
王伟. 中国经济高质量发展的测度与评估[J]. 华东经济管理, 2020, 34(6): 1-9.
[
|
| [14] |
吕承超, 崔悦. 中国高质量发展地区差距及时空收敛性研究[J]. 数量经济技术经济研究, 2020, 37(9): 62-79.
[
|
| [15] |
张震, 王泽宇, 李瑛. 中国区域经济高质量发展研究综述[J]. 资源开发与市场, 2021, 37(8): 928-933.
[
|
| [16] |
孙豪, 桂河清, 杨冬. 中国省域经济高质量发展的测度与评价[J]. 浙江社会科学, 2020(8): 4-14, 155.
[
|
| [17] |
孟晓, 田明华, 杜磊, 等. 中国农业农村现代化发展水平测度及其协调性研究[J]. 干旱区地理, 2024, 47(1): 137-146.
[
|
| [18] |
刘会武, 赵祚翔, 马金秋. 区域高质量发展测度与创新驱动效应的耦合检验[J]. 技术经济, 2021, 40(9): 1-13.
[
|
| [19] |
杨建, 方浩. 区域创新能力与高质量发展的耦合评价研究[J]. 技术经济与管理研究, 2022(6): 35-40.
[
|
| [20] |
赵宏波, 马延吉. 东北粮食主产区耕地生态安全的时空格局及障碍因子——以吉林省为例[J]. 应用生态学报, 2014, 25(2): 515-524.
[
|
| [21] |
鲁邦克, 邢茂源, 杨青龙. 中国经济高质量发展水平的测度与时空差异分析[J]. 统计与决策, 2019, 35(21): 113-117.
[
|
| [22] |
马茹, 罗晖, 王宏伟, 等. 中国区域经济高质量发展评价指标体系及测度研究[J]. 中国软科学, 2019(7): 60-67.
[
|
/
| 〈 |
|
〉 |