
Extreme climate characteristics in the Wuding River Basin based on WRF model
Received date: 2023-10-24
Revised date: 2023-12-31
Online published: 2026-03-11
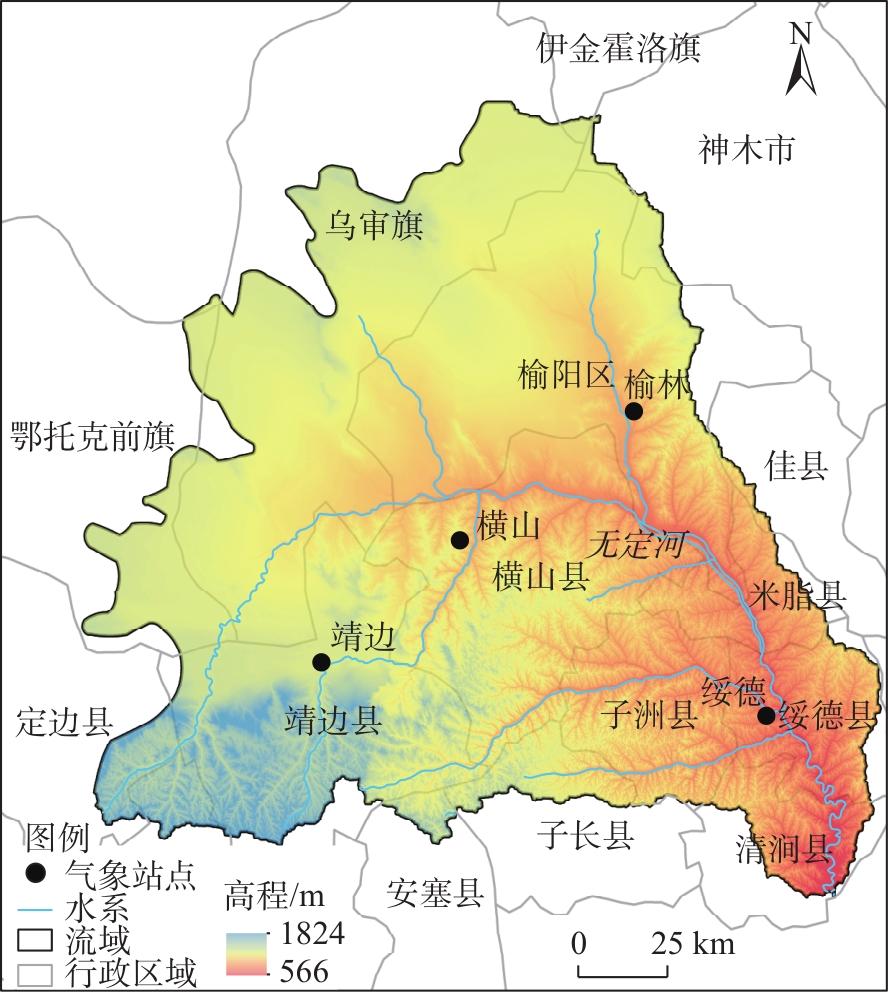
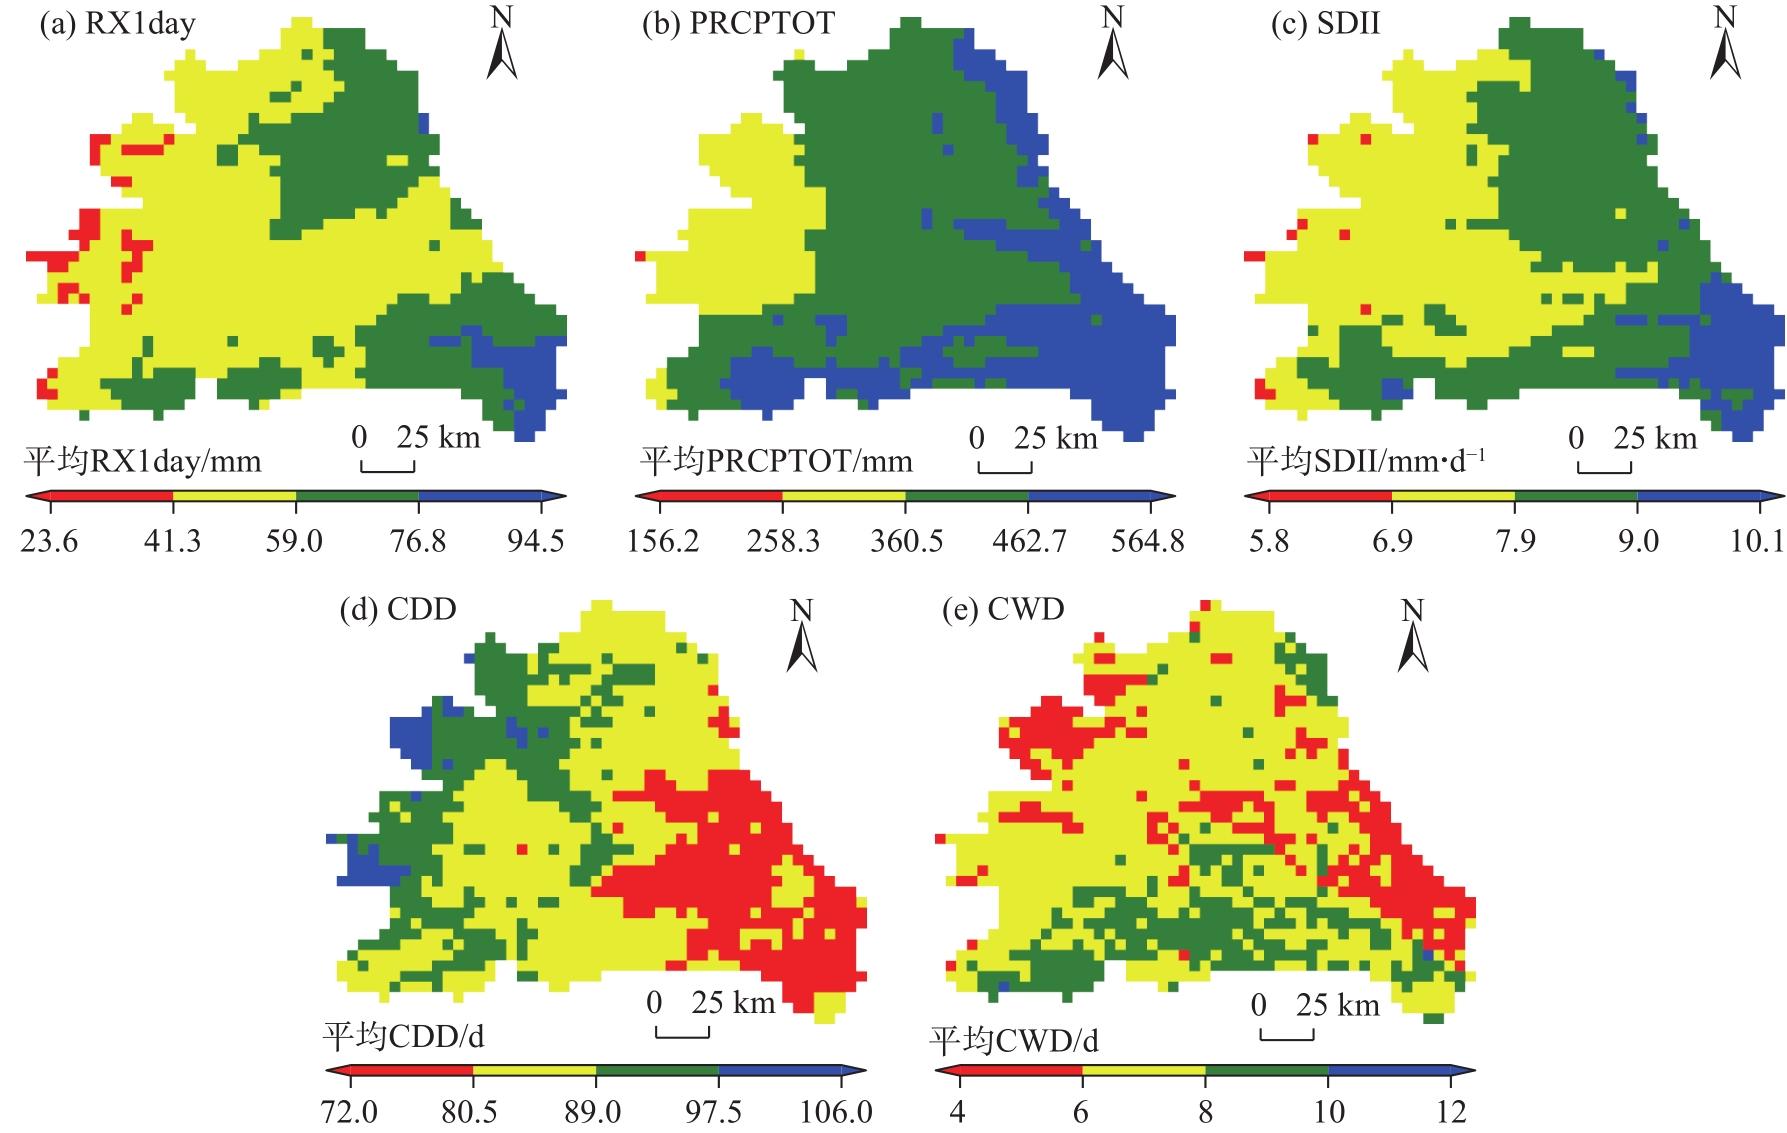
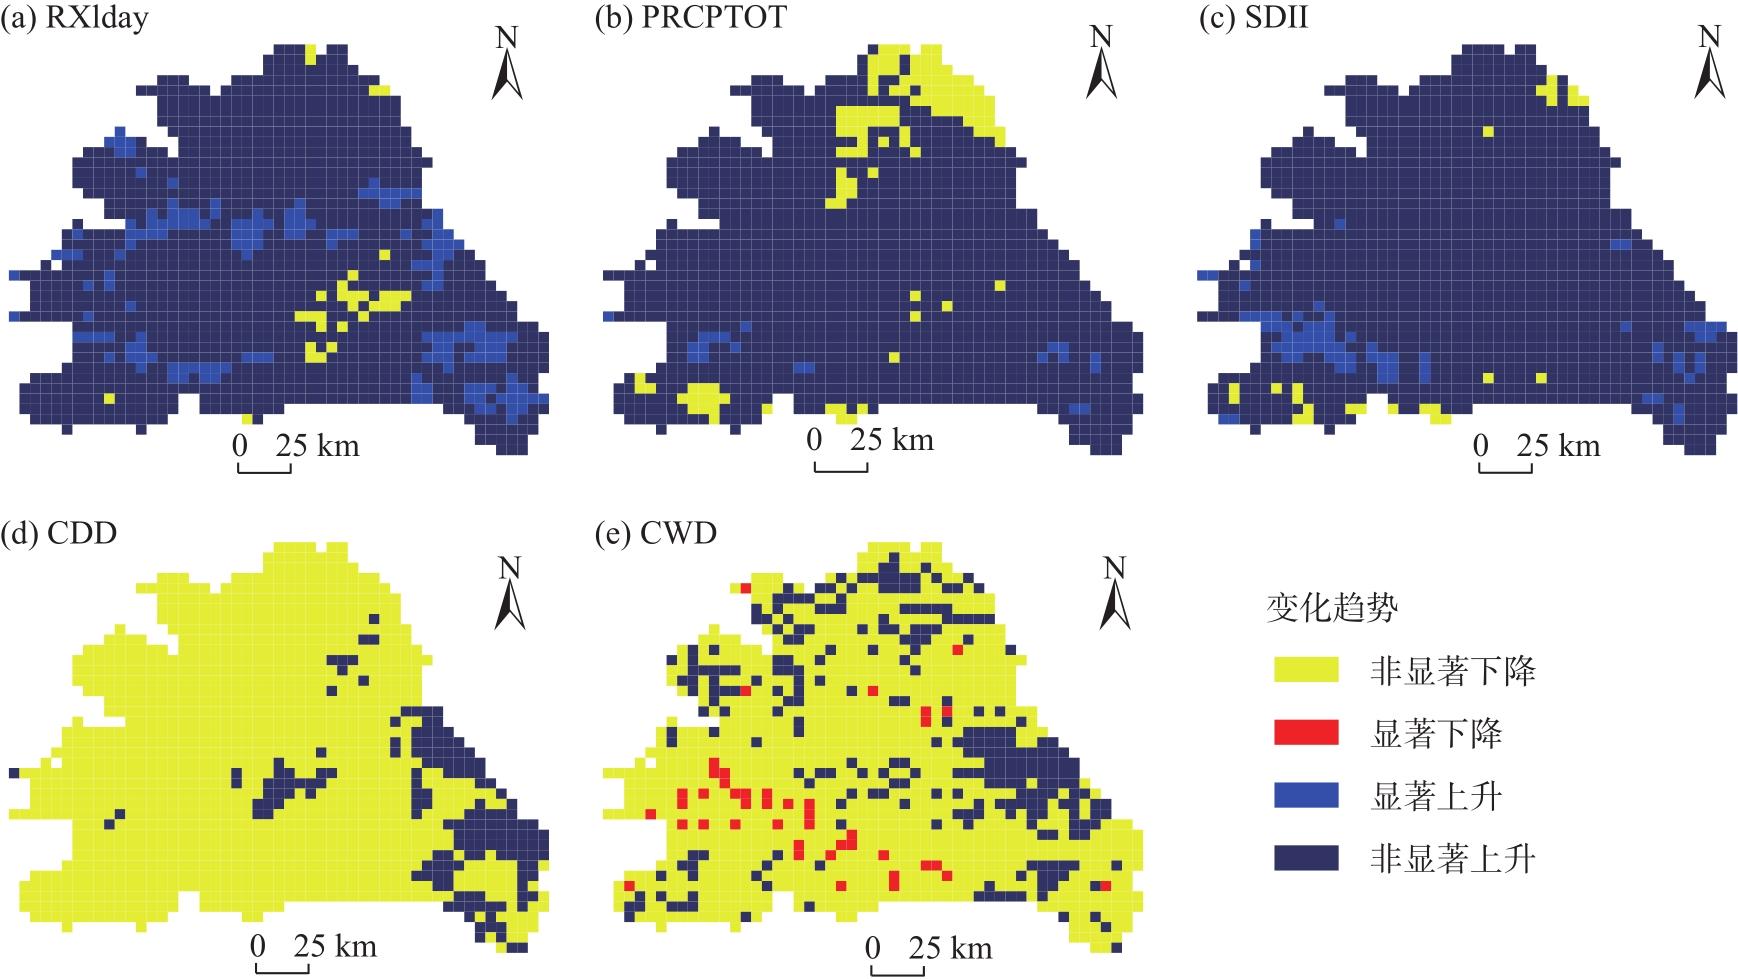
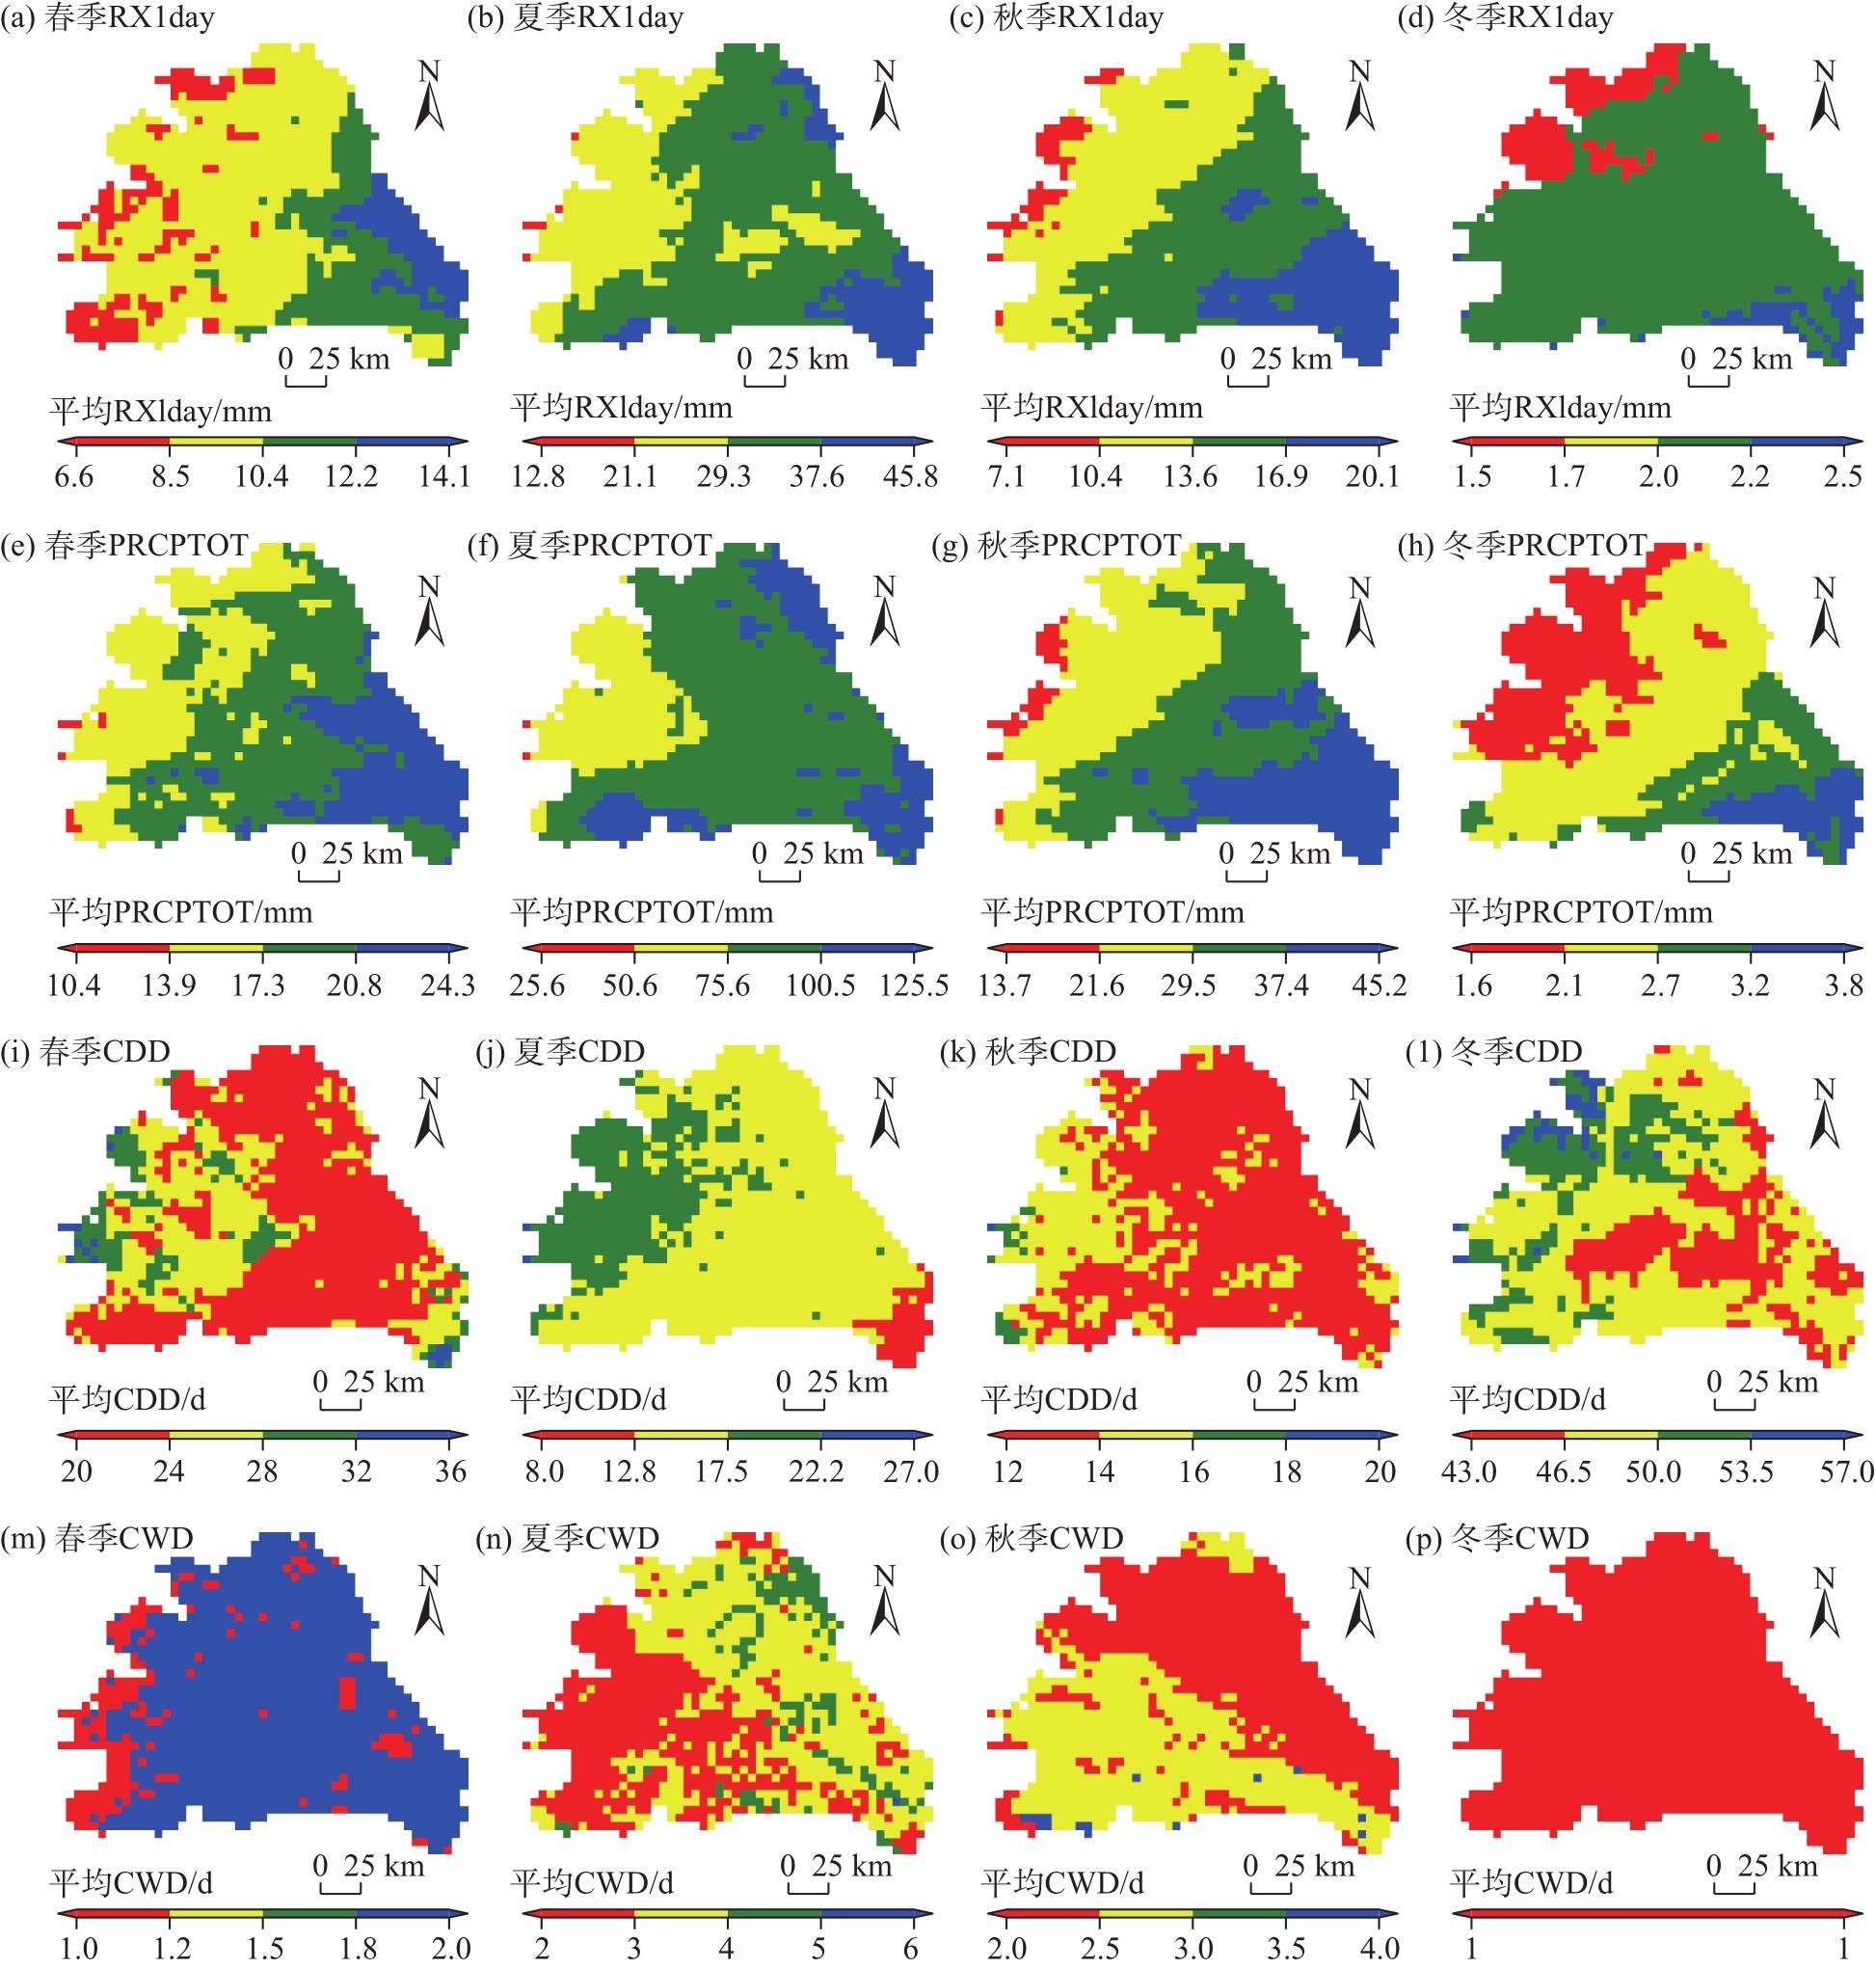
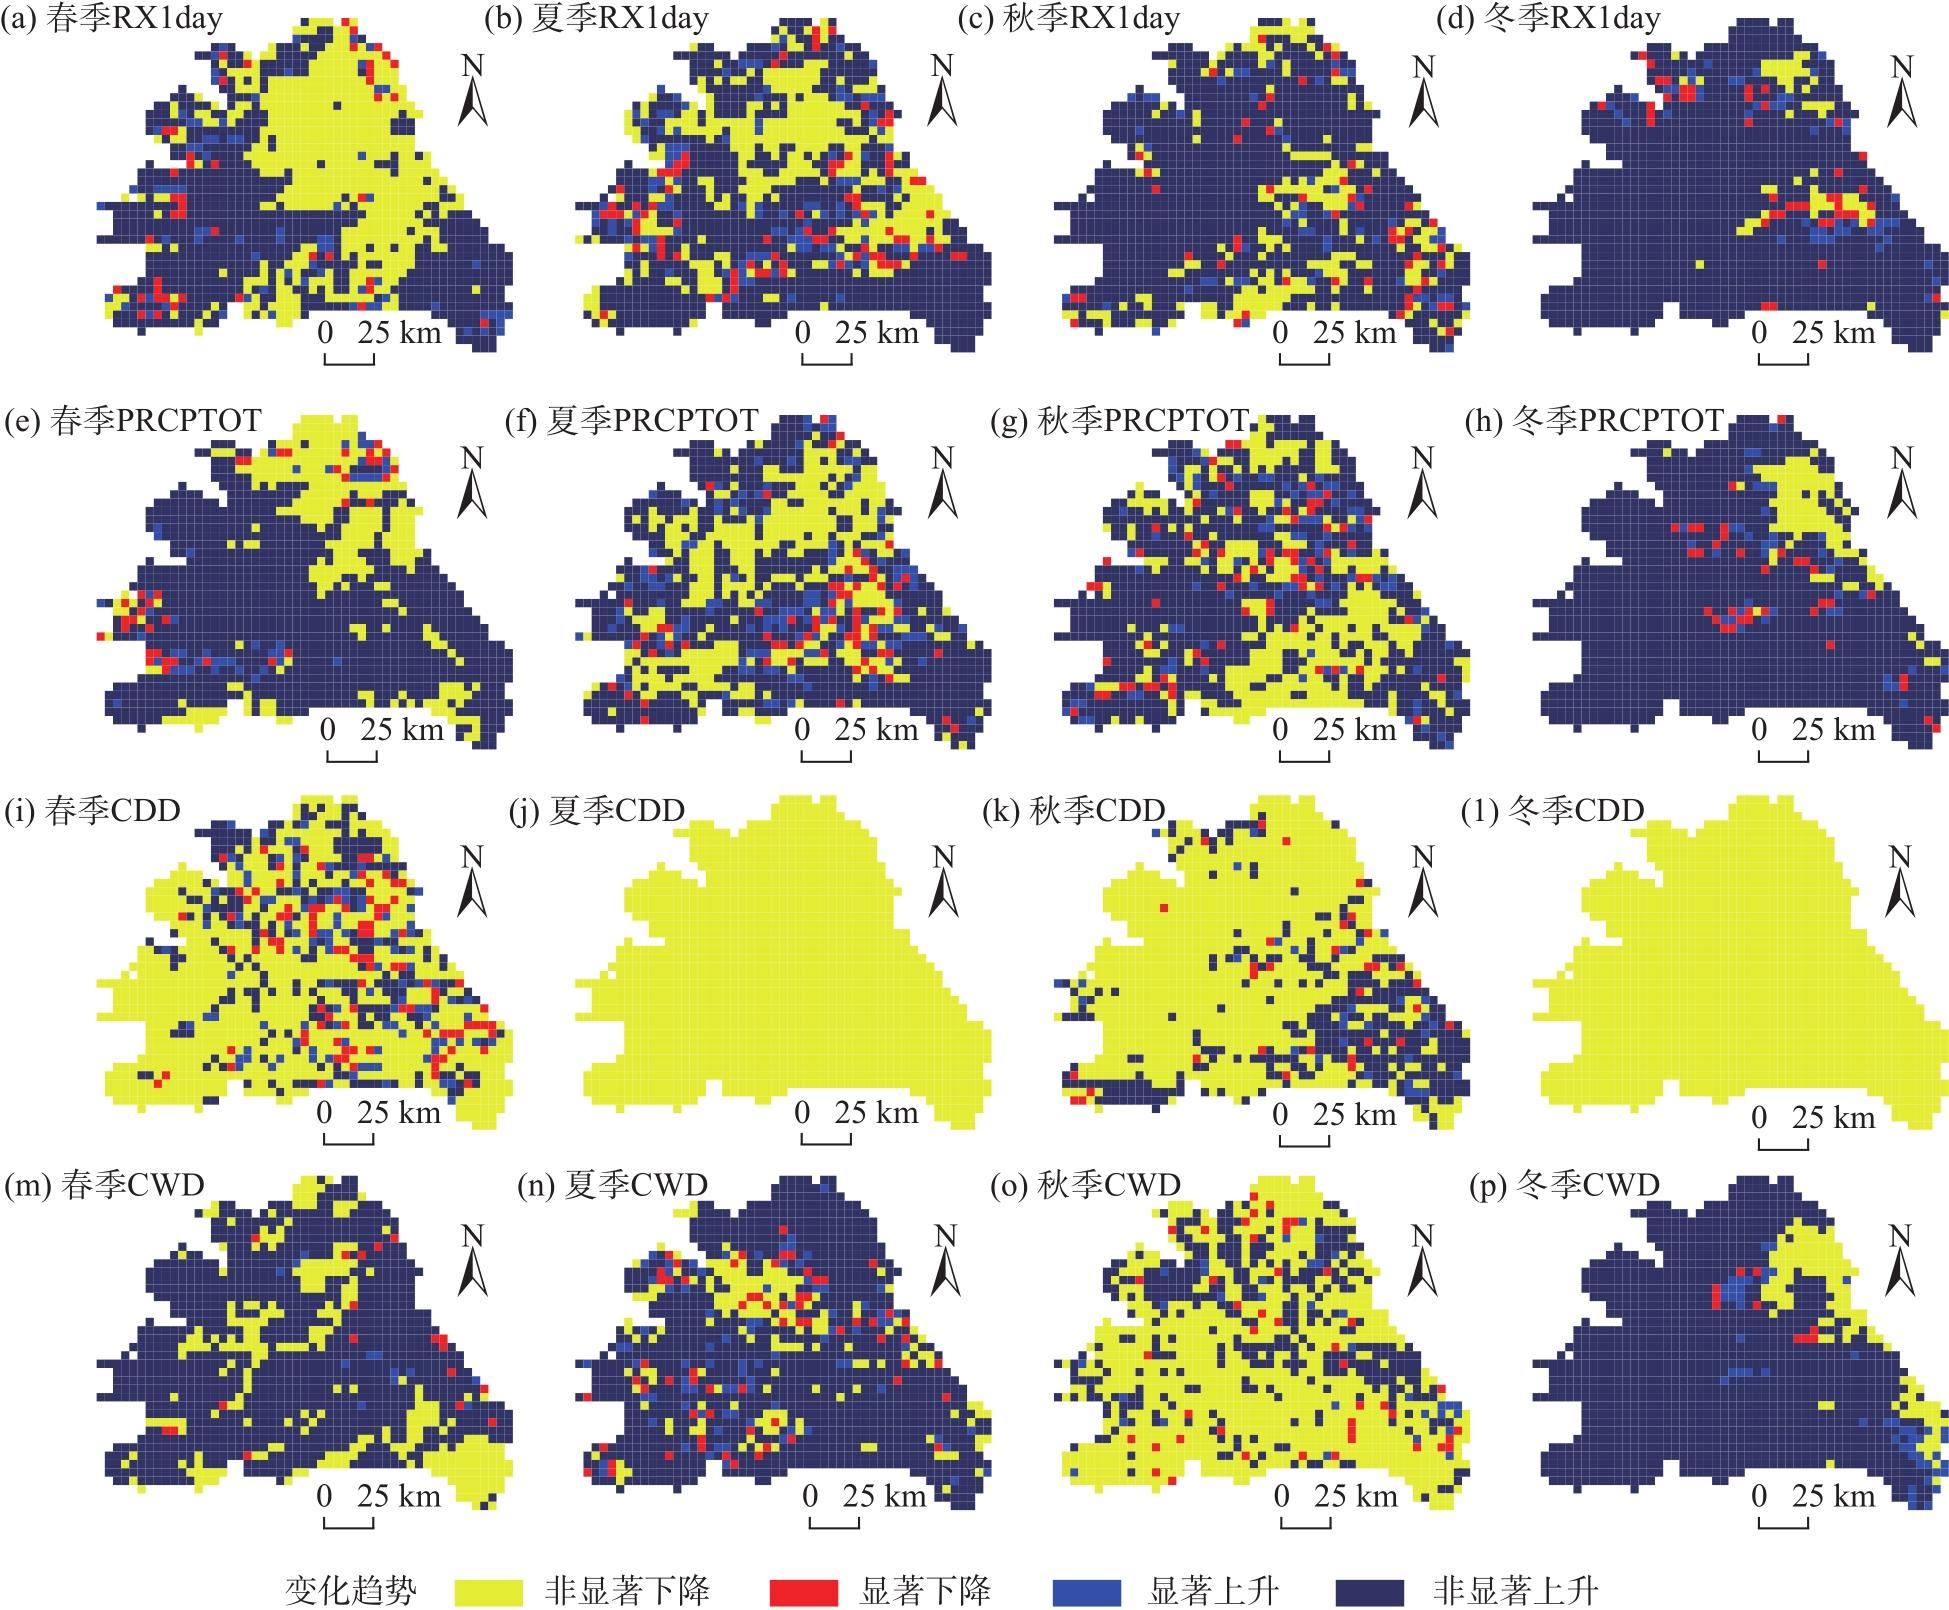
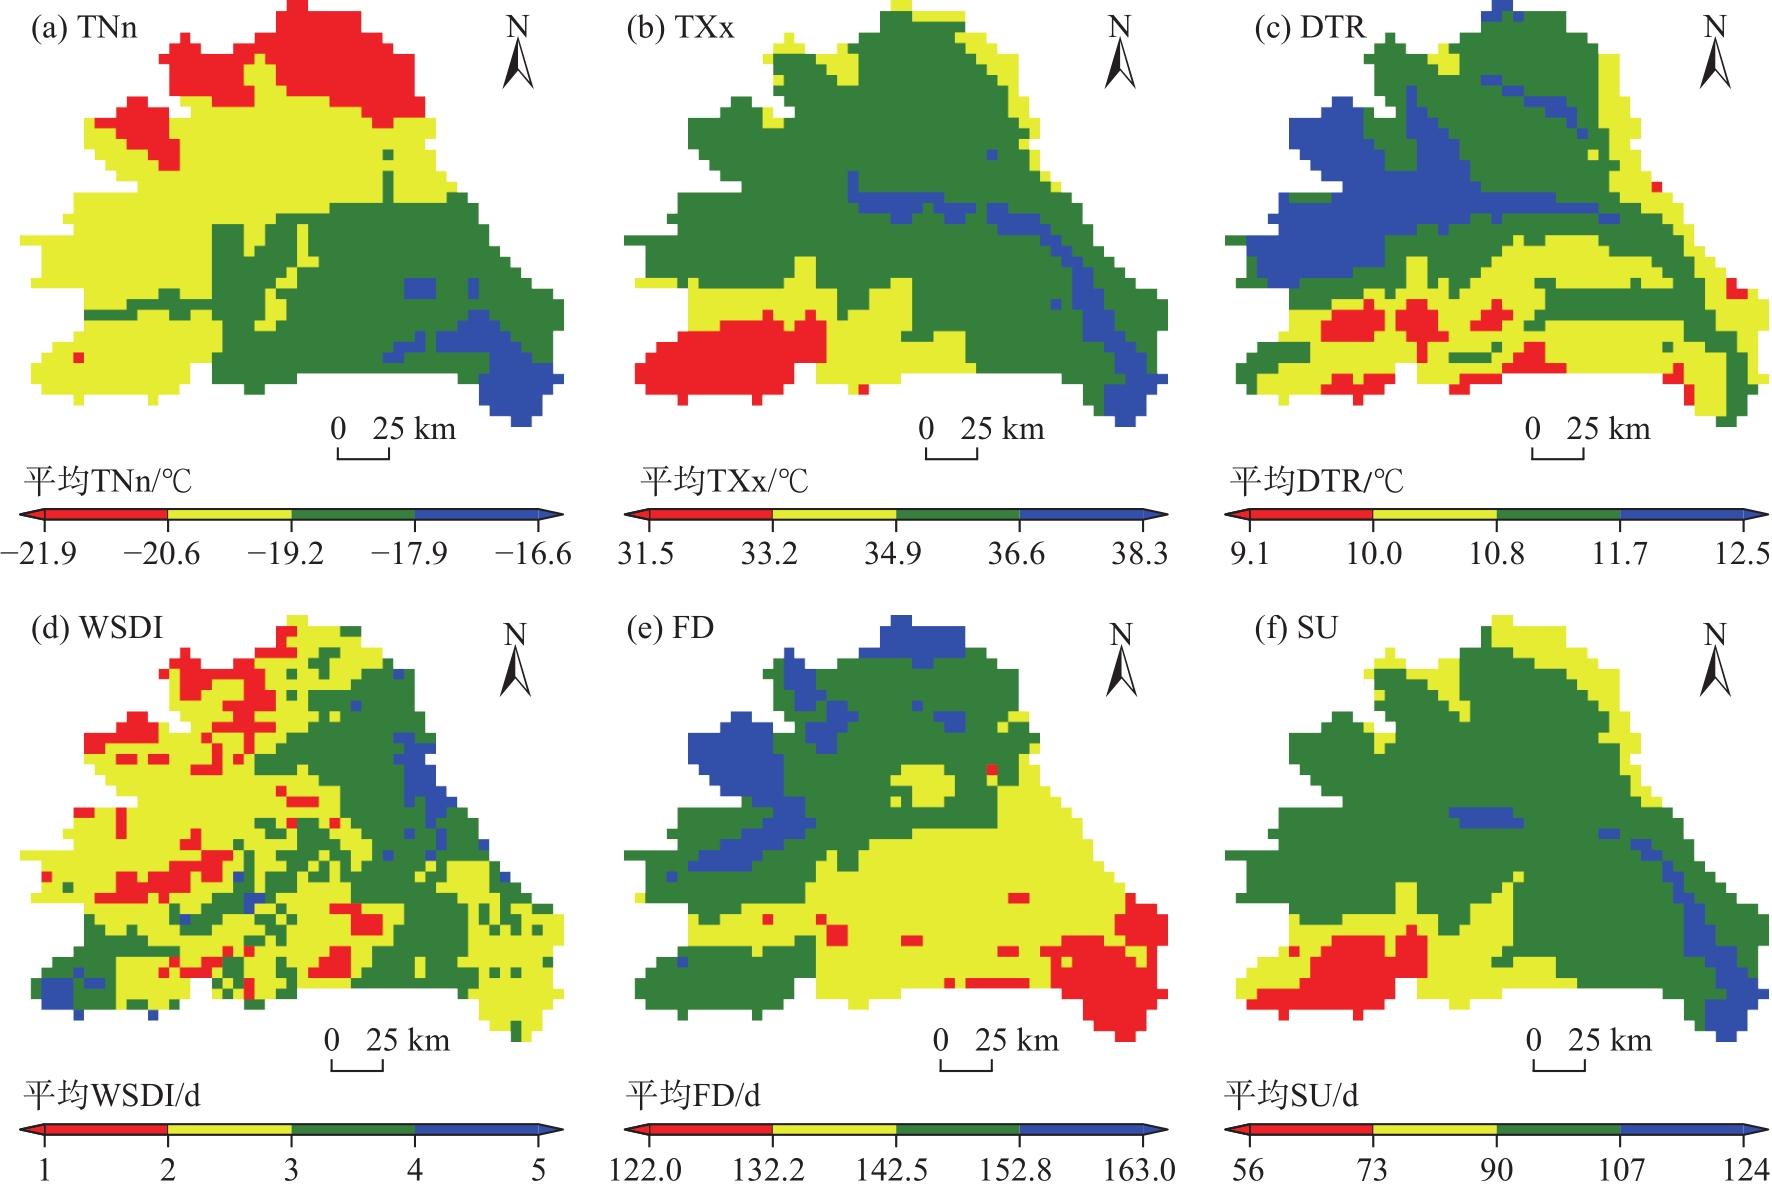
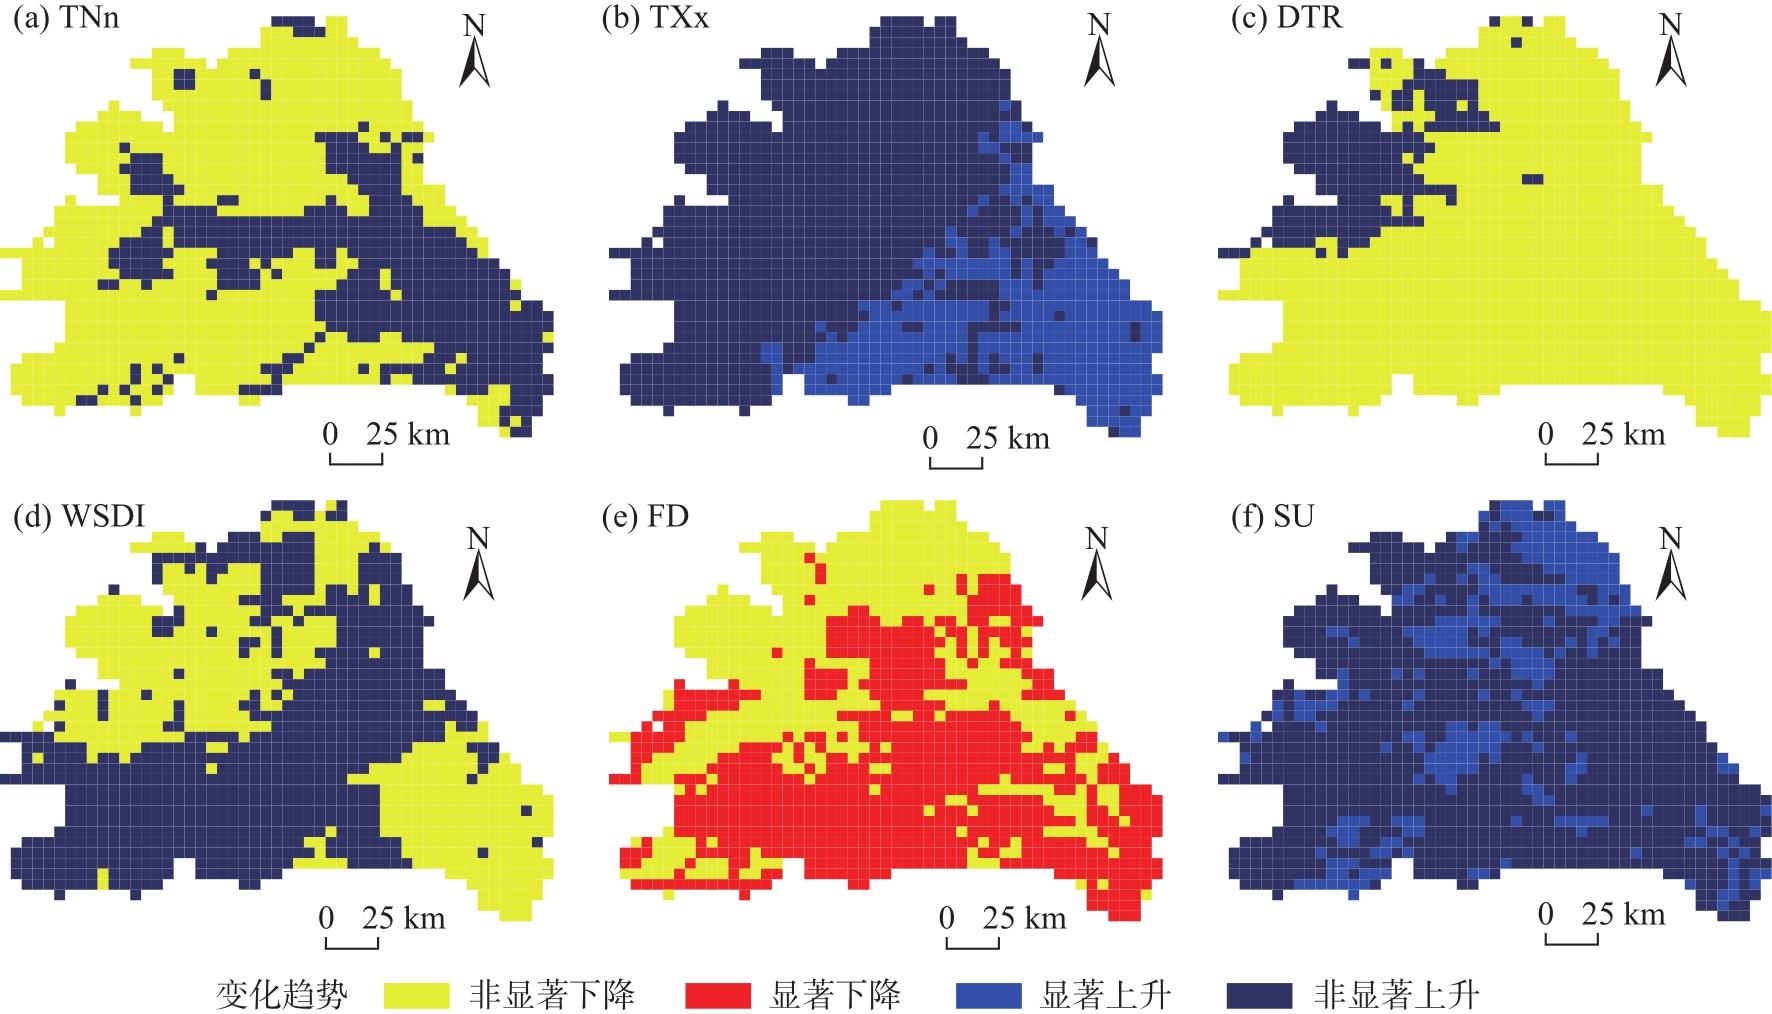
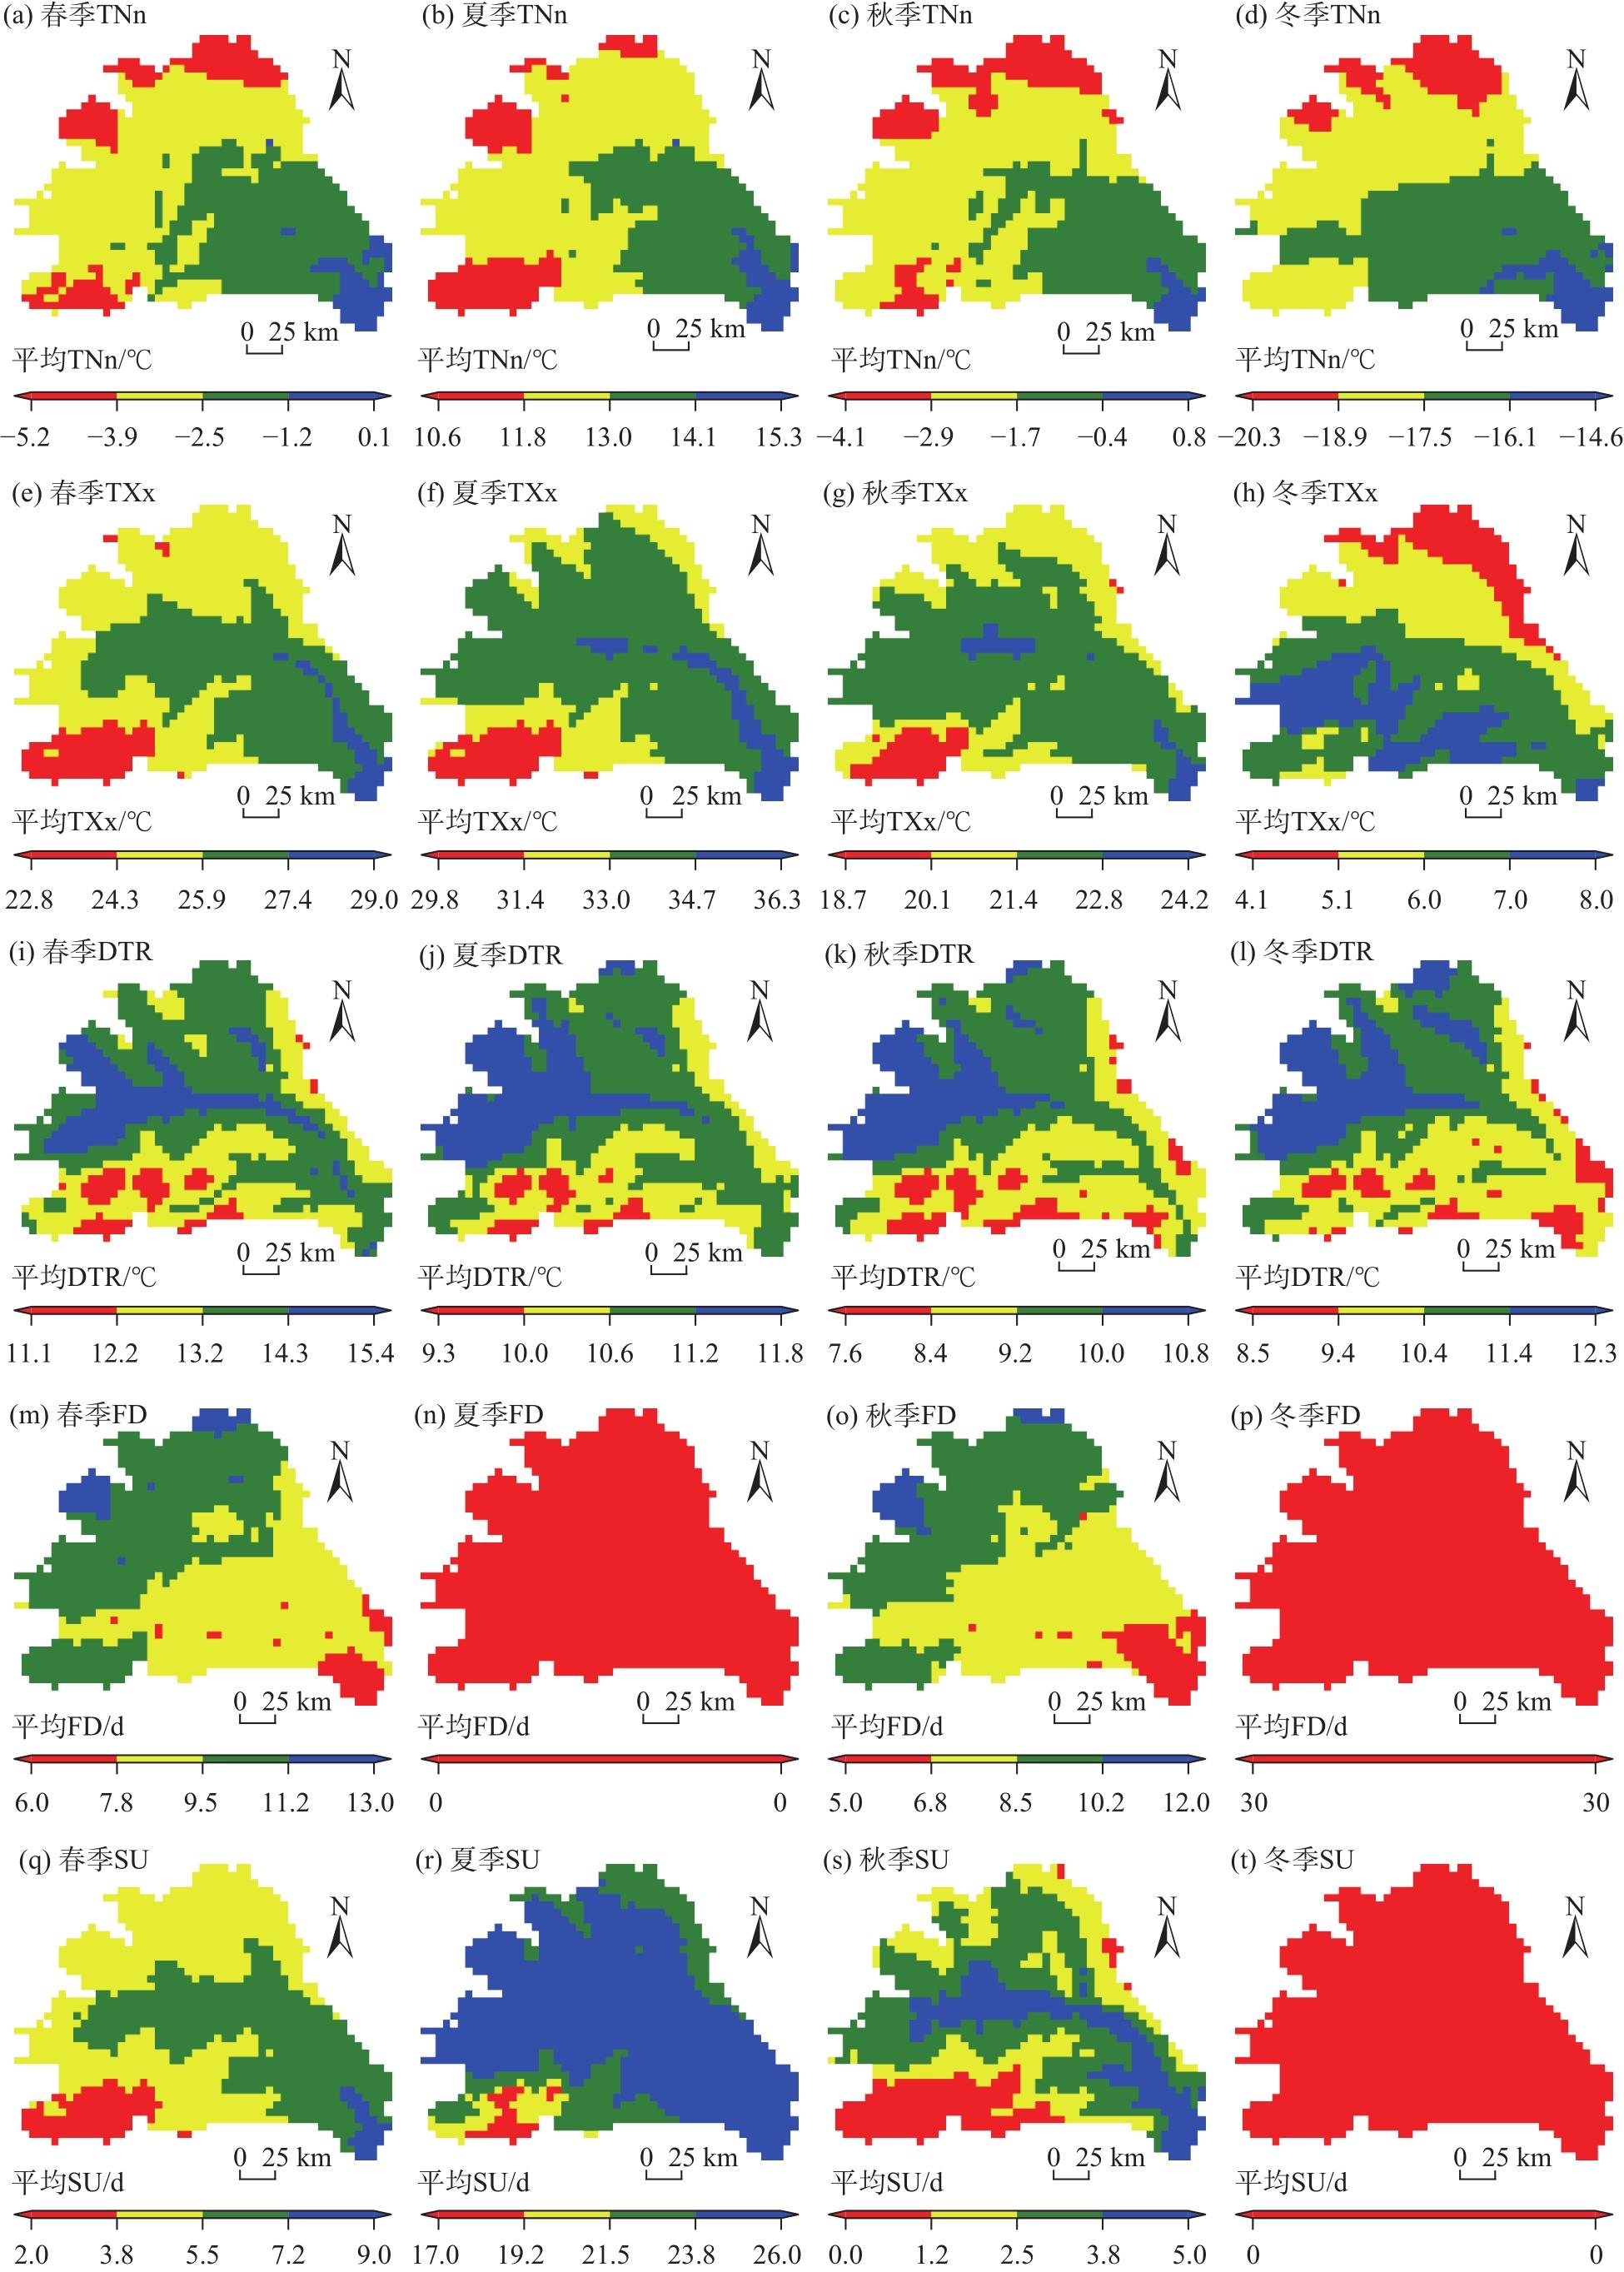
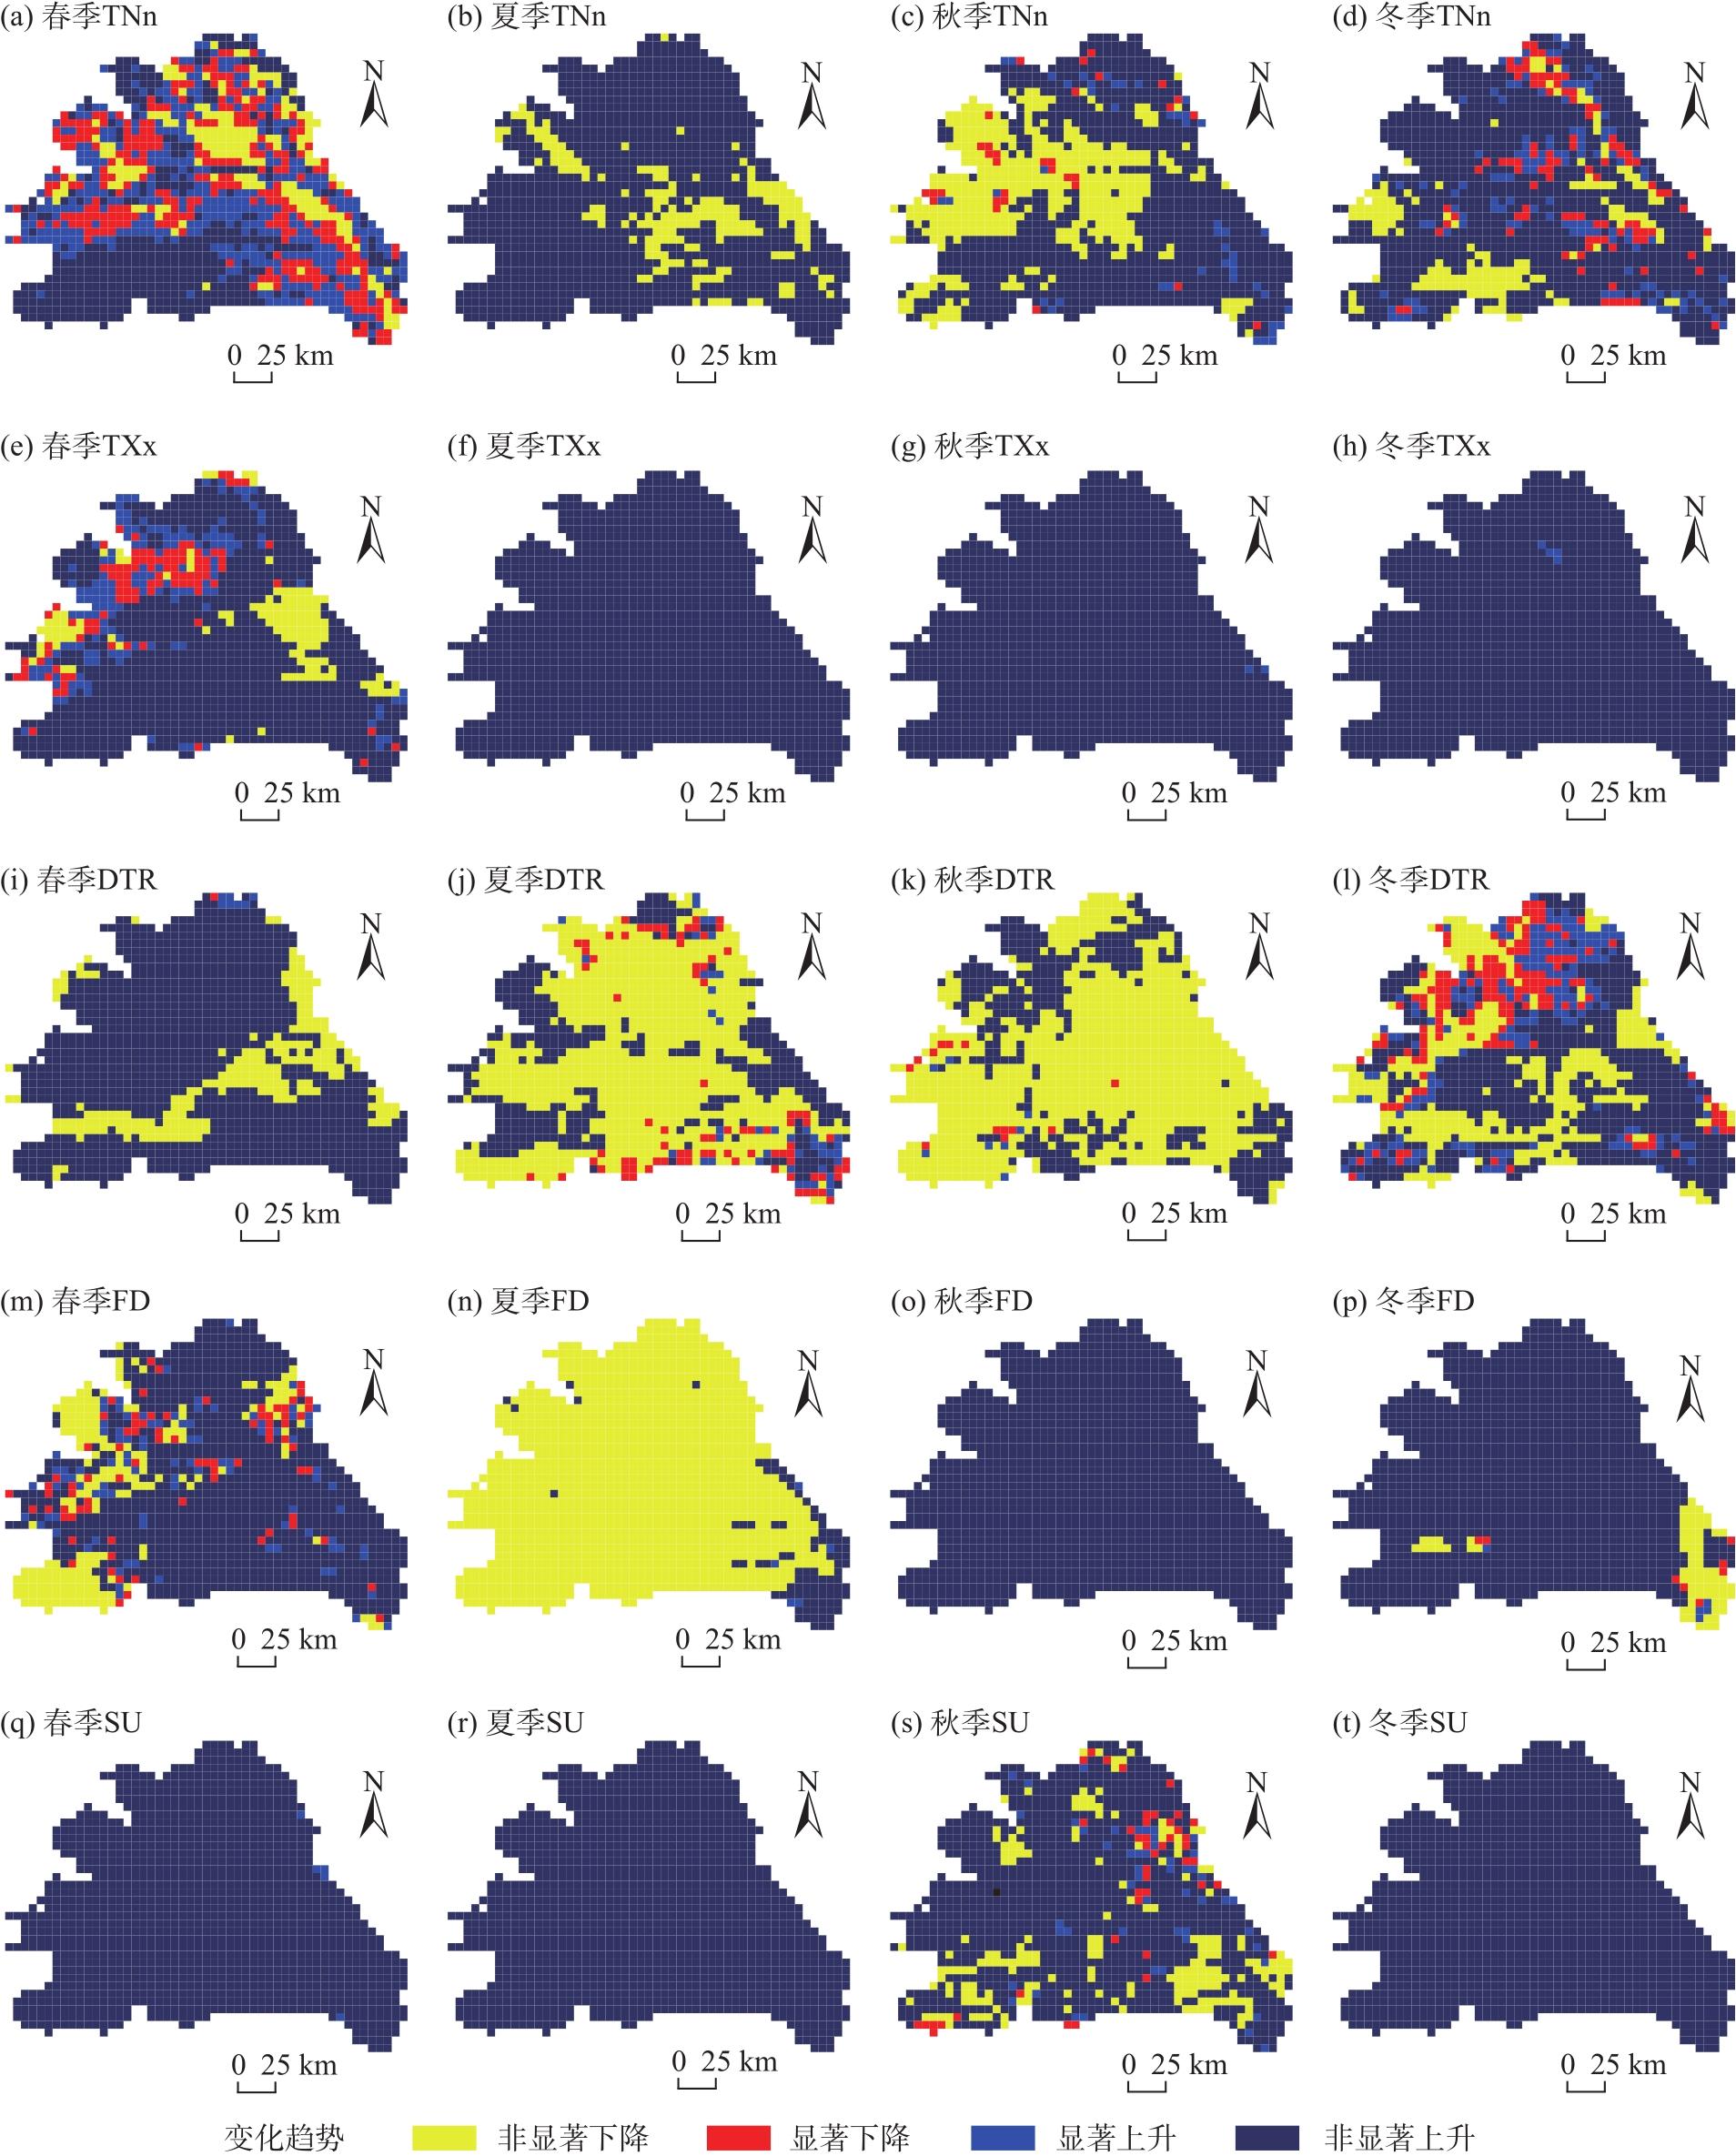
There are still many uncertainties to be solved about extreme climate events in the semi-arid region of the Loess Plateau under climate change. In this study, the weather research and forecasting (WRF) model driven by the static geographical data and the final operational global analysis (FNL) global reanalysis data was used to simulate the climate of the Wuding River Basin of Shaanxi Province, China from 2011 to 2022, and the simulated results were verified using the observed data from four meteorological stations in the basin to analyze the applicability of the model. On this basis, 11 extreme weather indicators were selected, combined with Sen’s slope estimator and the Mann-Kendall (M-K) test to analyze the spatial distribution characteristics and spatiotemporal trend changes of extreme precipitation and extreme temperature at the annual and seasonal scales in the Wuding River Basin. The conclusions are as follows: (1) Extreme precipitation events in the basin are more frequent in the east than in the west, and the interannual and seasonal spatial distribution characteristics of the maximum daily precipitation (RX1day) and precipitation total (PRCPTOT) are high in the east and low in the west. (2) Extreme precipitation events in the basin will further increase, precipitation amount and intensity will further increase, but the duration of precipitation and the degree of drought will decrease, specifically reflected in increased precipitation in all seasons but decreased precipitation in autumn in the east. (3) Extreme temperature events in the basin are more frequent in the east than in the west, and the interannual and seasonal spatial distribution characteristics of the minimum temperature (TNn) and maximum temperature (TXx) are high in the east and low in the west. (4) Extreme temperature events in the basin will further increase, and the frequency of high and low temperatures and their intensity show opposite changes in the east and west directions, specifically manifested as decreased temperature in summer and increased temperature in spring.
Shunwei ZHANG , Zixiang ZHOU , Xuanchen XIONG , Jie ZHOU . Extreme climate characteristics in the Wuding River Basin based on WRF model[J]. Arid Land Geography, 2024 , 47(9) : 1482 -1495 . DOI: 10.12118/j.issn.1000-6060.2023.597
表1 数据来源Tab. 1 Data sources |
| 数据名称 | 数据描述 | 数据来源 |
|---|---|---|
| 地理基础 信息数据 | 行政区划、 水系等 | http://www.ngcc.cn/ngcc/ |
| 高程数据 | 空间分辨率 (30 m×30 m) | http://www.gscloud.cn/ |
| 静态地理 数据 | 空间分辨率 (1 km×1 km) | https://www2.mmm.ucar.edu/ |
| FNL全球再分析数据 | 空间分辨率 (1°×1°) | https://rda.ucar.edu/ |
| 气象数据 | 逐日降水、气温 | https://data.cma.cn/ |
表2 极端降水指数定义Tab. 2 Definition of extreme precipitation indices |
| 分类 | 指数名称 | 指数代码 | 定义 | 单位 | 时间尺度 |
|---|---|---|---|---|---|
| 强度指数 | 单日最大降水量 | RX1day | 最大1日降水量 | mm | 月或年 |
| 雨日降水总量 | PRCPTOT | 雨日(日降水量≥1 mm)降水总量 | mm | 月或年 | |
| 雨日降水强度 | SDII | 年内日降水量≥1 mm的总量与总日数之比 | mm·d-1 | 年 | |
| 持续指数 | 持续干燥日数 | CDD | 日降水量<1 mm的最长连续日数 | d | 月或年 |
| 持续湿润日数 | CWD | 日降水量≥1 mm的最长连续日数 | d | 月或年 |
表3 极端气温指数定义Tab. 3 Definition of extreme temperature indices |
| 分类 | 指数名称 | 指数代码 | 定义 | 单位 | 时间尺度 |
|---|---|---|---|---|---|
| 强度指数 | 极端最低气温 | TNn | 日最低气温的最小值 | ℃ | 月或年 |
| 极端最高气温 | TXx | 日最高气温的最大值 | ℃ | 月或年 | |
| 气温日较差 | DTR | 日最高气温与最低气温的差值 | ℃ | 月或年 | |
| 持续指数 | 暖持续日数 | WSDI | 连续6 d日最高气温>90%分位值日 | d | 年 |
| 霜冻日数 | FD | 日最低气温低于0 ℃的日数 | d | 月或年 | |
| 夏日日数 | SU | 日最高气温大于25 ℃的日数 | d | 月或年 |
表4 WRF参数设置Tab. 4 Parameter settings of WRF |
| 两层嵌套方案 | 参数设置 | 物理方案 | 方案名称 |
|---|---|---|---|
| 初始边界条件 | FNL Data | 长波辐射方案 | RRTM |
| 投影坐标系 | Lat-Lon | 短波辐射方案 | Dudhia |
| 区域中心点 | 38.2°N,109.5°E | 地表参数化方案 | MYJ Monin-Obukhov |
| 时间步长 | 150 s | 云微物理方案 | CAM 5.1 |
| 嵌套格点 | d01:30×30;d02:61×66 | 陆面过程方案 | Noah LSM |
| 空间分辨率 | d01:0.25°;d02:0.05° | 大气边界层方案 | MYJ |
| 输出的时间步长 | d01:24 h;d02:1 h | 浅积云方案 | Kain-Fritsch |
表5 2011—2022年WRF模式与各站点气象要素评估Tab. 5 Evaluation of WRF model and meteorological elements at each station from 2011 to 2020 |
| 气象要素 | 站点 | RMSE | MAE | r | IA |
|---|---|---|---|---|---|
| 最高气温/℃ | 榆林 | 3.98 | 2.08 | 0.96 | 0.96 |
| 绥德 | 3.92 | 2.11 | 0.96 | 0.97 | |
| 横山 | 1.90 | 1.70 | 1.00 | 0.99 | |
| 靖边 | 1.74 | 1.56 | 1.00 | 0.99 | |
| 最低气温/℃ | 榆林 | 3.39 | 1.69 | 0.97 | 0.97 |
| 绥德 | 0.85 | 0.74 | 1.00 | 1.00 | |
| 横山 | 0.79 | 0.67 | 1.00 | 1.00 | |
| 靖边 | 1.24 | 1.02 | 1.00 | 1.00 | |
| 降水量/mm | 榆林 | 0.25 | 0.17 | 1.00 | 0.99 |
| 绥德 | 0.53 | 0.31 | 0.93 | 0.97 | |
| 横山 | 0.13 | 0.09 | 0.99 | 1.00 | |
| 靖边 | 0.18 | 0.12 | 0.99 | 0.99 |
注:RMSE、MAE、r和IA分别为均方根误差、平均绝对误差、相关系数和一致性指数。 |
| [1] |
|
| [2] |
孙颖. 人类活动对气候系统的影响——解读IPCC第六次评估报告第一工作组报告第三章[J]. 大气科学学报, 2021, 44(5): 654-657.
[
|
| [3] |
|
| [4] |
|
| [5] |
|
| [6] |
|
| [7] |
曾颖婷, 陆尔. 1961—2010年我国夏季总降水和极端降水的变化[J]. 气候变化研究进展, 2015, 11(2): 79-85.
[
|
| [8] |
陈效逑, 刘立, 尉杨平. 1961—2005年黄河流域极端气候事件变化趋势[J]. 人民黄河, 2011, 33(5): 3-5.
[
|
| [9] |
任宗萍, 马勇勇, 王友胜, 等. 无定河流域不同地貌区径流变化归因分析[J]. 生态学报, 2019, 39(12): 4309-4318.
[
|
| [10] |
党维勤, 郝鲁东, 高健健, 等. 基于“7·26”暴雨洪水灾害的淤地坝作用分析与思考[J]. 中国水利, 2019(8): 52-55.
[
|
| [11] |
|
| [12] |
|
| [13] |
|
| [14] |
杨梅焕, 王钰尧, 王涛, 等. 西北干旱区极端降水时空变化特征及驱动因素[J]. 西安理工大学学报, 2023, 39(3): 393-403.
[
|
| [15] |
李军龙, 张剑, 张丛, 等. 气象要素空间插值方法的比较分析[J]. 草业科学, 2006, 23(8): 6-11.
[
|
| [16] |
林忠辉, 莫兴国, 李宏轩, 等. 中国陆地区域气象要素的空间插值[J]. 地理学报, 2002, 57(1): 47-56.
[
|
| [17] |
郭飞. 基于WRF的城市热岛效应高分辨率评估方法[J]. 土木建筑与环境工程, 2017, 39(1): 13-19.
[
|
| [18] |
侯嘉琪. 基于WRF模式的中国西北地区未来气候变化预测分析[D]. 武汉: 华中农业大学, 2023.
[
|
| [19] |
|
| [20] |
|
| [21] |
赵雪岩. 无定河流域土地利用变化方式及对径流的影响研究[D]. 咸阳: 西北农林科技大学, 2023.
[
|
| [22] |
马伟东, 刘峰贵, 周强, 等. 1961—2017年青藏高原极端降水特征分析[J]. 自然资源学报, 2020, 35(12): 3039-3050.
[
|
| [23] |
李胜利, 巩在武, 石振彬. 近50年来山东省极端降水指数变化特征分析[J]. 水土保持研究, 2016, 23(4): 120-127.
[
|
| [24] |
王倩之, 刘凯, 汪明. NEX-GDDP降尺度数据对中国极端降水指数模拟能力的评估[J]. 气候变化研究进展, 2022, 18(1): 31-43.
[
|
| [25] |
李宛鸿, 徐影. CMIP6模式对青藏高原极端气温指数模拟能力评估及预估[J]. 高原气象, 2023, 42(2): 305-319.
[
|
| [26] |
|
| [27] |
|
| [28] |
|
| [29] |
|
| [30] |
田磊. 变化环境下黄土高原水文气候要素数值模拟及未来预测[D]. 咸阳: 西北农林科技大学, 2019.
[
|
| [31] |
方利, 王文杰, 蒋卫国, 等. 2000—2014年黑龙江流域(中国)植被覆盖时空变化及其对气候变化的响应[J]. 地理科学, 2017, 37(11): 1745-1754.
[
|
| [32] |
李双双, 孔锋, 韩鹭, 等. 陕北黄土高原区极端降水时空变化特征及其影响因素[J]. 地理研究, 2020, 39(1): 140-151.
[
|
| [33] |
杨维涛, 孙建国, 康永泰, 等. 黄土高原地区极端气候指数时空变化[J]. 干旱区地理, 2020, 43(6): 1456-1466.
[
|
| [34] |
黎珩, 朱冰冰, 边熇, 等. 1970—2020年黄土高原水蚀风蚀交错区极端降水时空变化研究及驱动因素分析[J]. 干旱区地理, 2024, 47(4): 539-548.
[
|
| [35] |
|
| [36] |
WMO. State of the global climate 2021: WMO provisional report[M]. Geneva: WMO, 2021: 1-4.
|
| [37] |
|
/
| 〈 |
|
〉 |