
Variation characteristics and influencing factors of air negative ion concentration in summer residential areas of Xining City
Received date: 2023-08-14
Revised date: 2023-10-10
Online published: 2026-03-11
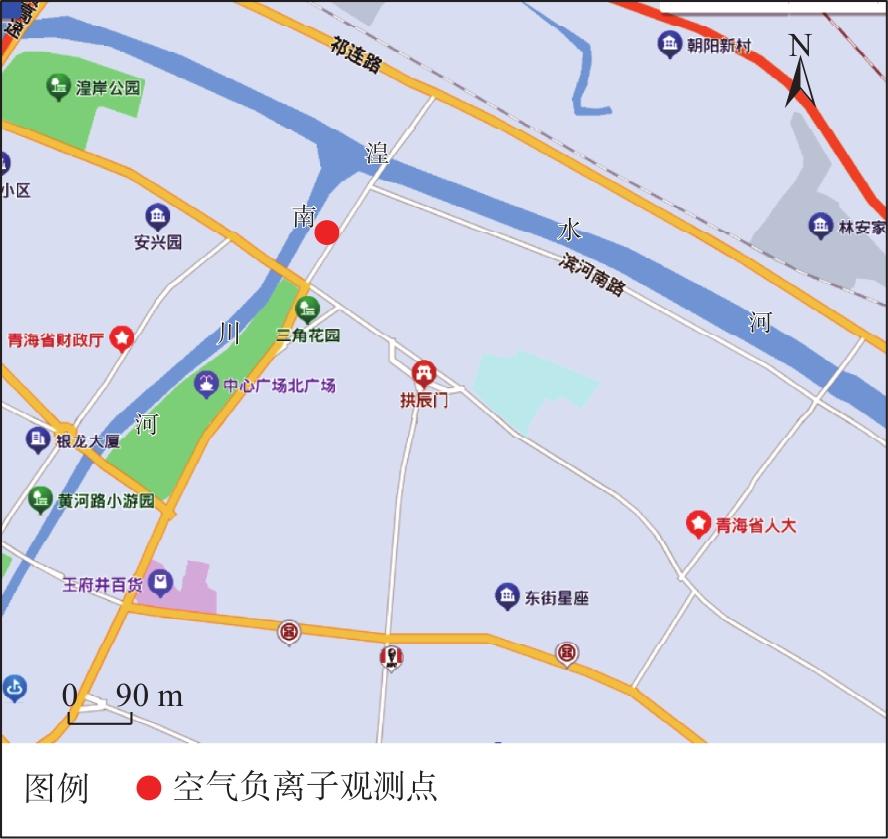
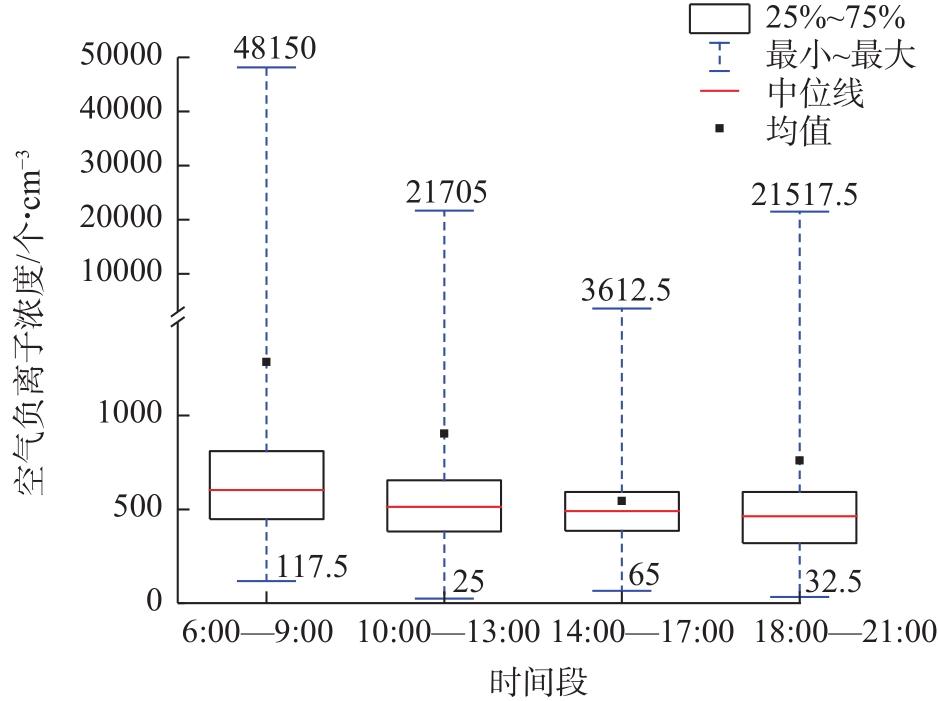
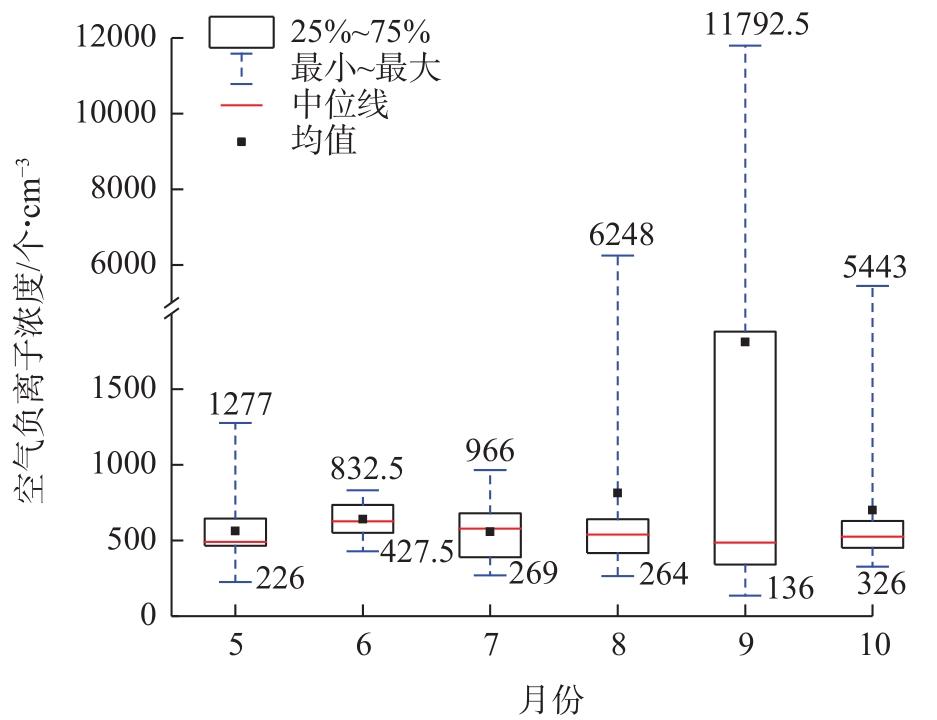
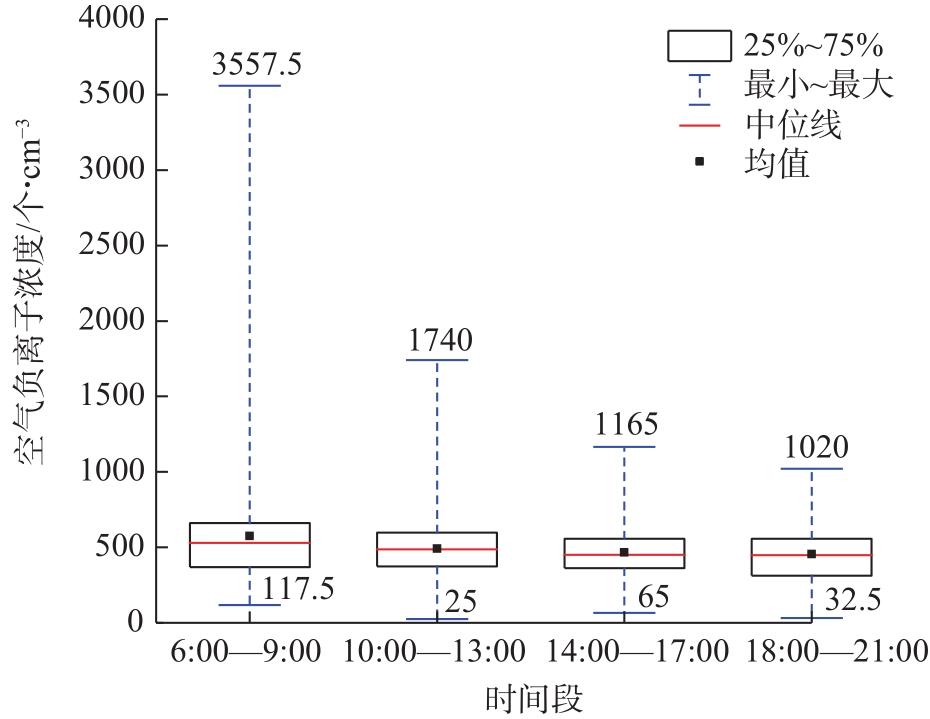
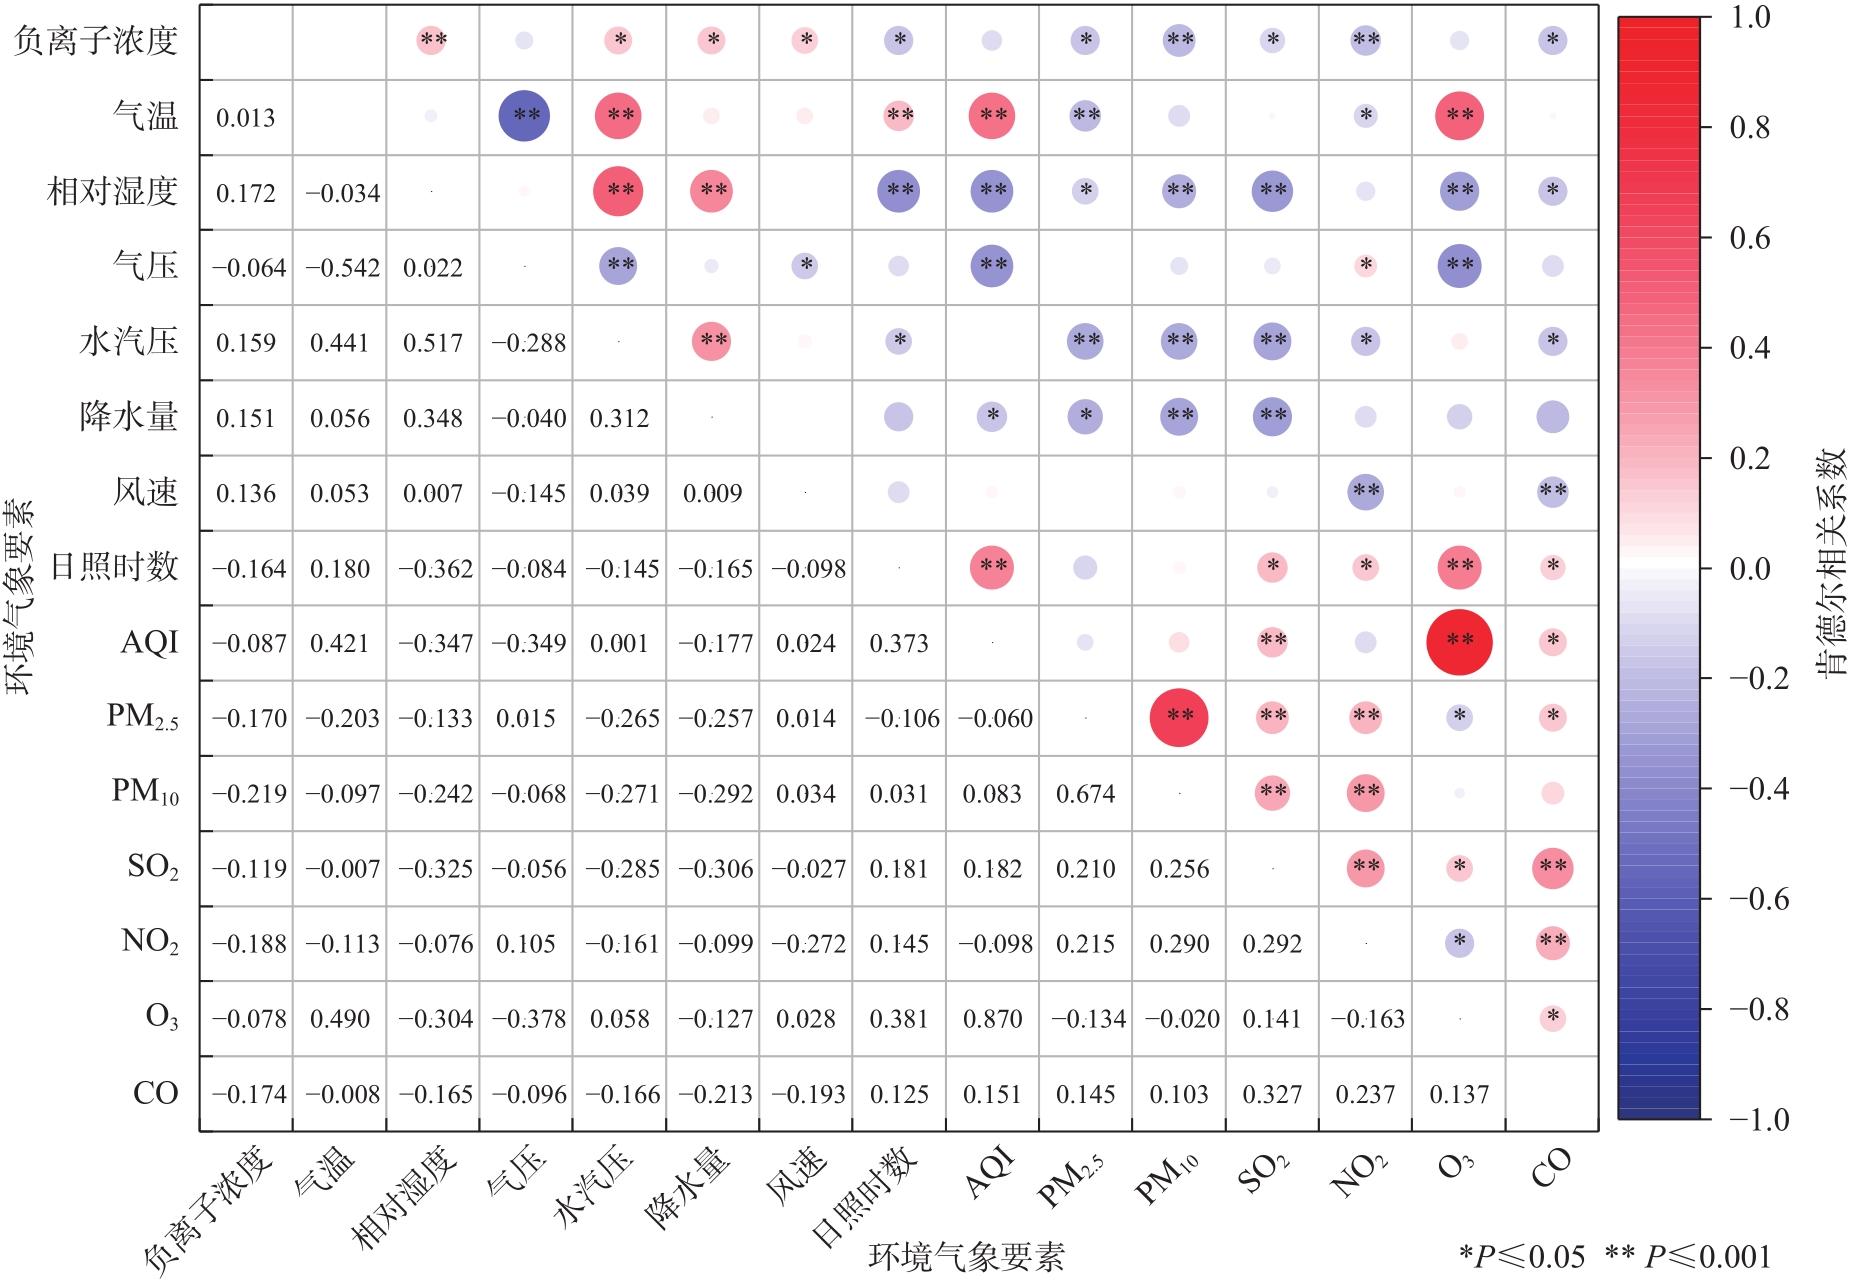
Positive and negative air ion concentrations were monitored in a typical residential area of Xining City, Qinghai Province, China, from May to October 2022. The temporal distribution characteristics of negative air ion concentration were analyzed, and air freshness and cleanliness were evaluated. The correlation between negative air ion concentration and concurrent meteorological conditions and air pollutant concentrations was investigated. The following are the study findings: (1) The negative air ion concentration in a typical residential areas of Xining City is higher in the morning than in the afternoon and night. The negative air ion concentrations from August to October are higher than those from May to July. (2) The change in the negative air ion concentrations in the Xining residential area is closely related to weather conditions during monitoring, following the pattern of “rainy>cloudy>sunny”. (3) High concentrations of negative air ions indicate that air is fresh but do not necessarily mean that air is clean. On sunny days, the negative air ion concentration in plateau cities are not high and air freshness is moderate; however, air cleanliness is high. (4) Relative humidity, sunshine hours, water vapor pressure, precipitation, and wind speed mainly affect the change in negative air ion concentration. Concentrations of NO2, PM10, CO, and PM2.5 inhibit the increase of negative air ion concentration. The results provide scientific data supporting living environment improvement, tourism health management, and ecological environmental protection in plateau areas.
Honglu MA , Donglin QI , Tong ZHAO , Xiaoyun CAO , Quanning ZHAO , Rui ZHANG . Variation characteristics and influencing factors of air negative ion concentration in summer residential areas of Xining City[J]. Arid Land Geography, 2024 , 47(8) : 1358 -1366 . DOI: 10.12118/j.issn.1000-6060.2023.428
表1 空气负离子浓度等级Tab. 1 Grade of negative air ion concentration |
| 浓度等级 | 空气负离子浓度(N) | 说明 |
|---|---|---|
| Ⅰ级 | N≥1200 | 浓度高,空气清新 |
| Ⅱ级 | 500≤N<1200 | 浓度较高,空气较清新 |
| Ⅲ级 | 100≤N<500 | 浓度中,空气一般 |
| Ⅳ级 | 0<N<100 | 浓度低,空气不够清新 |
表2 空气清洁度等级标准Tab. 2 Air cleanliness class standard |
| 评价指标 | 清洁度等级 | ||||
|---|---|---|---|---|---|
| A | B | C | D | E | |
| 空气清洁度 | 最清洁 | 清洁 | 中等 | 容许 | 临界值 |
| CI | ≥1.00 | (1.00, 0.70] | (0.70, 0.50] | (0.50, 0.30] | <0.30 |
注:CI为安倍空气离子评价系数。下同。 |
表3 不同天气状况下西宁市居民区空气负离子浓度Tab. 3 Negative air ion concentration of residential areas of Xining City in different weather condition /个·cm-3 |
| 月份 | 晴天 | 多云 | 阴天 | 雨天 | 平均 |
|---|---|---|---|---|---|
| 5 | (85~922.5) 477.17 | (120~1545) 516.62 | (82.5~1565) 639.46 | (240~2300) 804.55 | (82.5~2300) 558.89 |
| 6 | (365~757.5) 588.17 | (290~912.5) 627.8 | (400~1135) 711.09 | (477.5~1097.5) 787.5 | (290~1135) 645.19 |
| 7 | (65~1020) 440.61 | (130~1232.5) 606.81 | (122.5~1870) 563.8 | (322.5~1365) 775 | (65~1870) 536.12 |
| 8 | (257.5~640) 391.56 | (192.5~2170) 450.65 | (225~13310) 986.9 | (672.5~48150) 5880 | (182.5~48150) 1347.14 |
| 9 | (102.5~3557.5) 495.22 | (25~28270) 969.63 | (157.5~14302.25) 2083.75 | (632.5~26250) 8299.5 | (25~28270) 2003.31 |
| 10 | (177.5~755) 475.63 | (50~1165) 590.66 | (272.5~7257.5) 700.75 | (357.5~21705) 7392.08 | (50~21705) 835.79 |
| 平均 | 478.06 | 627.03 | 947.63 | 3989.77 | - |
注:括号中数值为空气负离子浓度变化范围,括号下方数值为空气负离子浓度平均值。 |
表4 西宁市居民区空气负离子浓度等级及清洁度评价结果Tab. 4 Assessment result of negative air ion concentration grade and cleanliness for residential areas of Xining City |
| 月份 | 天气状况 | 6:00—9:00 | 10:00—13:00 | 14:00—17:00 | 18:00—21:00 | 雨天 | 阴天 | 多云 | 晴天 | 平均 |
|---|---|---|---|---|---|---|---|---|---|---|
| 5 | 浓度等级 | Ⅱ级 | Ⅱ级 | Ⅱ级 | Ⅱ级 | Ⅱ级 | Ⅱ级 | Ⅱ级 | Ⅲ级 | Ⅱ级 |
| q | 1.64 | 1.75 | 1.47 | 1.54 | 1.14 | 1.56 | 1.57 | 1.73 | 1.59 | |
| CI | 0.45 | 0.49 | 0.46 | 19.34 | 117.30 | 0.56 | 0.43 | 0.38 | 5.77 | |
| 清洁度等级 | D | D | D | A | A | C | D | D | A | |
| 6 | 浓度等级 | Ⅱ级 | Ⅱ级 | Ⅱ级 | Ⅱ级 | Ⅱ级 | Ⅱ级 | Ⅱ级 | Ⅱ级 | Ⅱ级 |
| q | 1.21 | 1.02 | 1.47 | 1.15 | 1.54 | 1.13 | 1.24 | 1.28 | 1.24 | |
| CI | 0.64 | 0.85 | 0.42 | 0.63 | 0.57 | 0.71 | 0.59 | 0.53 | 0.60 | |
| 清洁度等级 | C | B | D | C | C | B | C | C | C | |
| 7 | 浓度等级 | Ⅱ级 | Ⅲ级 | Ⅲ级 | Ⅱ级 | Ⅱ级 | Ⅱ级 | Ⅱ级 | Ⅲ级 | Ⅱ级 |
| q | 1.26 | 1.79 | 2.37 | 1.01 | 1.11 | 1.36 | 1.31 | 1.71 | 1.48 | |
| CI | 6.46 | 0.54 | 2.02 | 0.93 | 9.22 | 5.85 | 0.58 | 0.43 | 2.67 | |
| 清洁度等级 | A | C | A | B | A | A | C | D | A | |
| 8 | 浓度等级 | Ⅰ级 | Ⅱ级 | Ⅱ级 | Ⅱ级 | Ⅰ级 | Ⅱ级 | Ⅲ级 | Ⅲ级 | Ⅰ级 |
| q | 0.74 | 1.24 | 1.48 | 1.20 | 0.39 | 0.98 | 1.38 | 1.70 | 1.08 | |
| CI | 14914.71 | 0.81 | 1.10 | 1363.30 | 42807.48 | 818.12 | 35.54 | 0.33 | 5341.15 | |
| 清洁度等级 | A | B | A | A | A | A | A | D | A | |
| 9 | 浓度等级 | Ⅰ级 | Ⅱ级 | Ⅱ级 | Ⅰ级 | Ⅰ级 | Ⅰ级 | Ⅱ级 | Ⅲ级 | Ⅰ级 |
| q | 0.63 | 2.92 | 1.56 | 1.38 | 0.01 | 0.61 | 2.42 | 1.10 | 1.42 | |
| CI | 5476.50 | 273.64 | 144.74 | 3339.30 | 26980.20 | 2918.55 | 2779.51 | 119.42 | 4976.14 | |
| 清洁度等级 | A | A | A | A | A | A | A | A | A | |
| 10 | 浓度等级 | Ⅱ级 | Ⅰ级 | Ⅱ级 | Ⅲ级 | Ⅰ级 | Ⅱ级 | Ⅱ级 | Ⅲ级 | Ⅱ级 |
| q | 0.38 | 0.75 | 0.98 | 1.01 | 0.17 | 0.82 | 0.66 | 0.86 | 0.77 | |
| CI | 23.52 | 4616.10 | 1.05 | 0.91 | 28006.13 | 235.59 | 11.26 | 0.80 | 1104.39 | |
| 清洁度等级 | A | A | A | B | A | A | A | B | A |
注:q为单级系数。 |
| [1] |
余娟, 高占冬, 王德远, 等. 天缘洞空气负离子时空分布特征及影响因素分析[J]. 环境化学, 2021, 40(4): 1078-1087.
[
|
| [2] |
王薇, 余庄, 凤全. 基于空气负离子浓度的城市环境空气清洁度评价[J]. 生态环境学报, 2013, 22(2): 298-303.
[
|
| [3] |
|
| [4] |
|
| [5] |
刘燕, 王业成, 王让会, 等. 南京浦口区大气负离子的时空特征及其与气象条件的关系[J]. 长江流域资源与环境, 2017, 26(5): 706-712.
[
|
| [6] |
王一荃, 周璋, 李意德, 等. 不同热带森林空气负离子浓度评价研究[J]. 生态环境学报, 2021, 30(5): 898-906.
[
|
| [7] |
彭巍, 李明文, 王慧, 等. 空气负离子国内外研究进展及其在森林康养方面的积极作用综述[J]. 温带林业研究, 2020, 3(3): 11-14, 54.
[
|
| [8] |
|
| [9] |
|
| [10] |
李少宁, 李嫒, 鲁绍伟, 等. 北京西山国家森林公园中空气负离子浓度与气象因子的相关性研究[J]. 生态环境学报, 2021, 30(3): 541-547.
[
|
| [11] |
冯鹏飞, 于新文, 张旭. 北京地区不同植被类型空气负离子浓度及其影响因素分析[J]. 生态环境学报, 2015, 24(5): 818-824.
[
|
| [12] |
刘晴, 高鹏, 李成, 等. 泰安市典型生态功能区空气负离子的时空分布及影响因素分析[J]. 环境化学, 2019, 38(1): 169-176.
[
|
| [13] |
张毓涛, 李吉玫. 新疆主要城市不同生态功能区夏季空气负离子特征[J]. 干旱区地理, 2012, 35(6): 864-874.
[
|
| [14] |
|
| [15] |
|
| [16] |
袁相洋, 孙迎雪, 田媛, 等. 北京市不同功能区空气负氧离子及影响因素研究[J]. 环境科学与技术, 2014, 37(6): 97-102.
[
|
| [17] |
韦朝领, 王敬涛, 蒋跃林, 等. 合肥市不同生态功能区空气负离子浓度分布特征及其与气象因子的关系[J]. 应用生态学报, 2006, 17(11): 2158-2162.
[
|
| [18] |
QX/R 380-2017. 中华人民共和国气象行业标准: 空气负(氧)离子浓度等级[S]. 北京: 气象出版社, 2017.
[QX/R 380-2017. Meteorological Industry Standard of the People’s Republic of China: Grade of air negative (oxygen) ion concentration[S]. Beijing: China Meteorological Press, 2017.]
|
| [19] |
郁珍艳, 李正泉, 樊高峰, 等. 浙江省气象及环境因子对负氧离子浓度的影响分析[J]. 中国环境科学, 2023, 43(2): 514-524.
[
|
| [20] |
王薇, 余庄. 中国城市环境中空气负离子研究进展[J]. 生态环境学报, 2013, 22(4): 705-711.
[
|
| [21] |
耿生莲, 王志涛, 辛永清, 等. 西宁市城市典型绿地空气负氧离子浓度特征研究[J]. 山西林业科技, 2016, 45(4): 4-9.
[
|
| [22] |
卢振礼, 杨成芳, 崔广暑, 等. 雷雨天气对负氧离子浓度的影响[J]. 气象科技, 2021, 49(2): 284-290.
[
|
| [23] |
施光耀, 桑玉强, 张劲松, 等. 不同光照强度下植物电信号变化特征及其与空气负离子的关系[J]. 应用生态学报, 2022, 33(2): 439-447.
[
|
| [24] |
侯秀娟, 闫晓云, 王波, 等. 夏季干旱半干旱城市公园绿地空气负离子与空气颗粒物变化特征[J]. 南京林业大学学报(自然科学版), 2022, 46(4): 212-220.
[
|
| [25] |
|
| [26] |
黄向华, 王健, 曾宏达, 等. 城市空气负离子浓度时空分布及其影响因素综述[J]. 应用生态学报, 2013, 24(6): 1761-1768.
[
|
| [27] |
王薇, 陈明. 城市绿地空气负离子和PM2.5及其与微气候关系——以合肥天鹅湖为例[J]. 生态环境学报, 2016, 25(9): 1499-1507.
[
|
| [28] |
|
| [29] |
曹建新, 张宝贵, 张友杰. 海滨森林环境中空气负离子分布特征及其与环境因子的关系[J]. 生态环境学报, 2017, 26(8): 1375-1383.
[
|
/
| 〈 |
|
〉 |