Climatology and Hydrology

Research review of mass changes for lake-terminating glaciers in the Himalayas

  • Shangkun JIA , 1 ,
  • Junfeng WEI , 1 ,
  • Fagang ZHANG 1 ,
  • Xin WANG 1, 2
Expand
  • 1. School of Earth Sciences and Spatial Information Engineering, Hunan University of Science and Technology, Xiangtan 411201, Hunan, China
  • 2. State Key Laboratory of Cryospheric Science, Northwest Institute of Eco-Environment and Resources, Chinese Academy of Sciences, Lanzhou 730000, Gansu, China

Received date: 2023-10-11

  Revised date: 2024-01-27

  Online published: 2026-03-11

Abstract

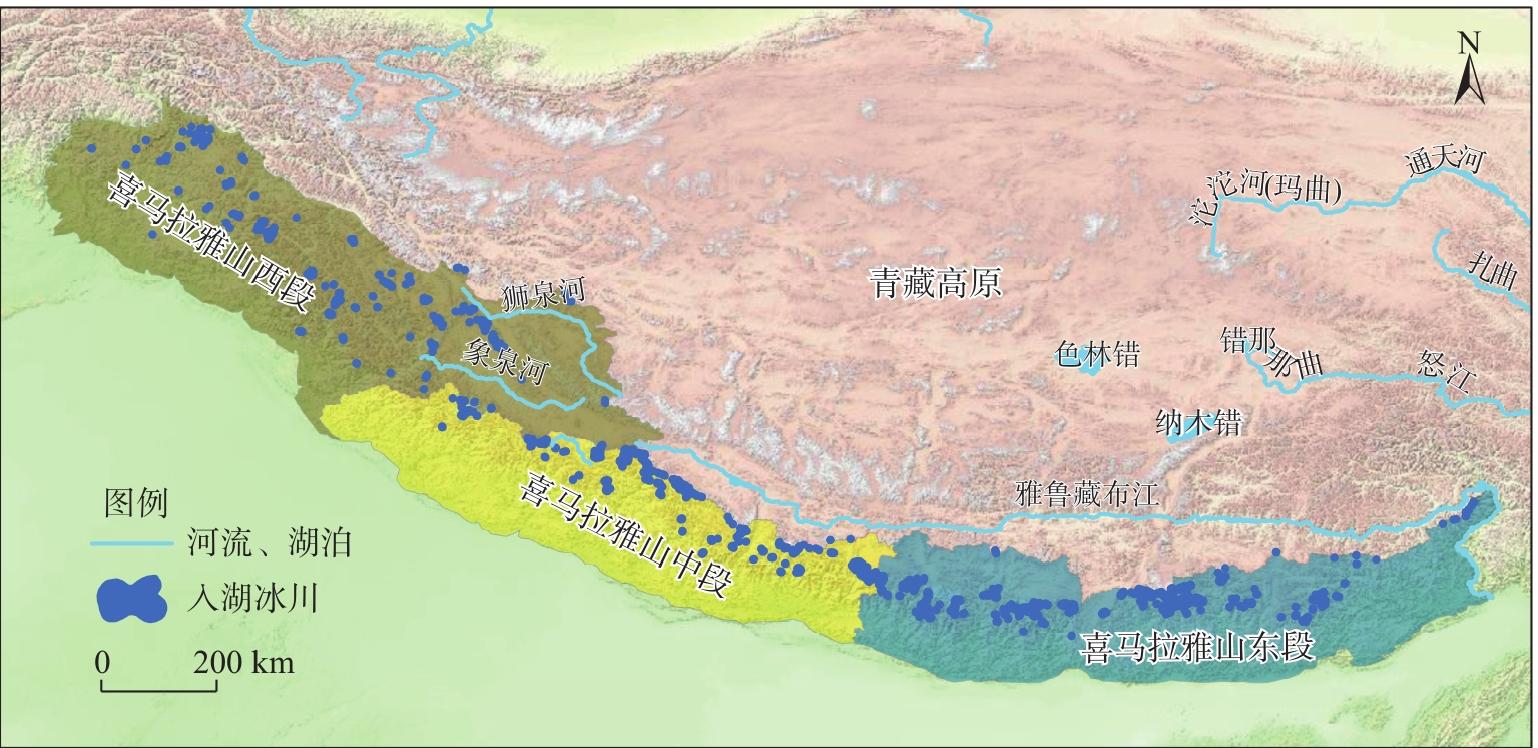
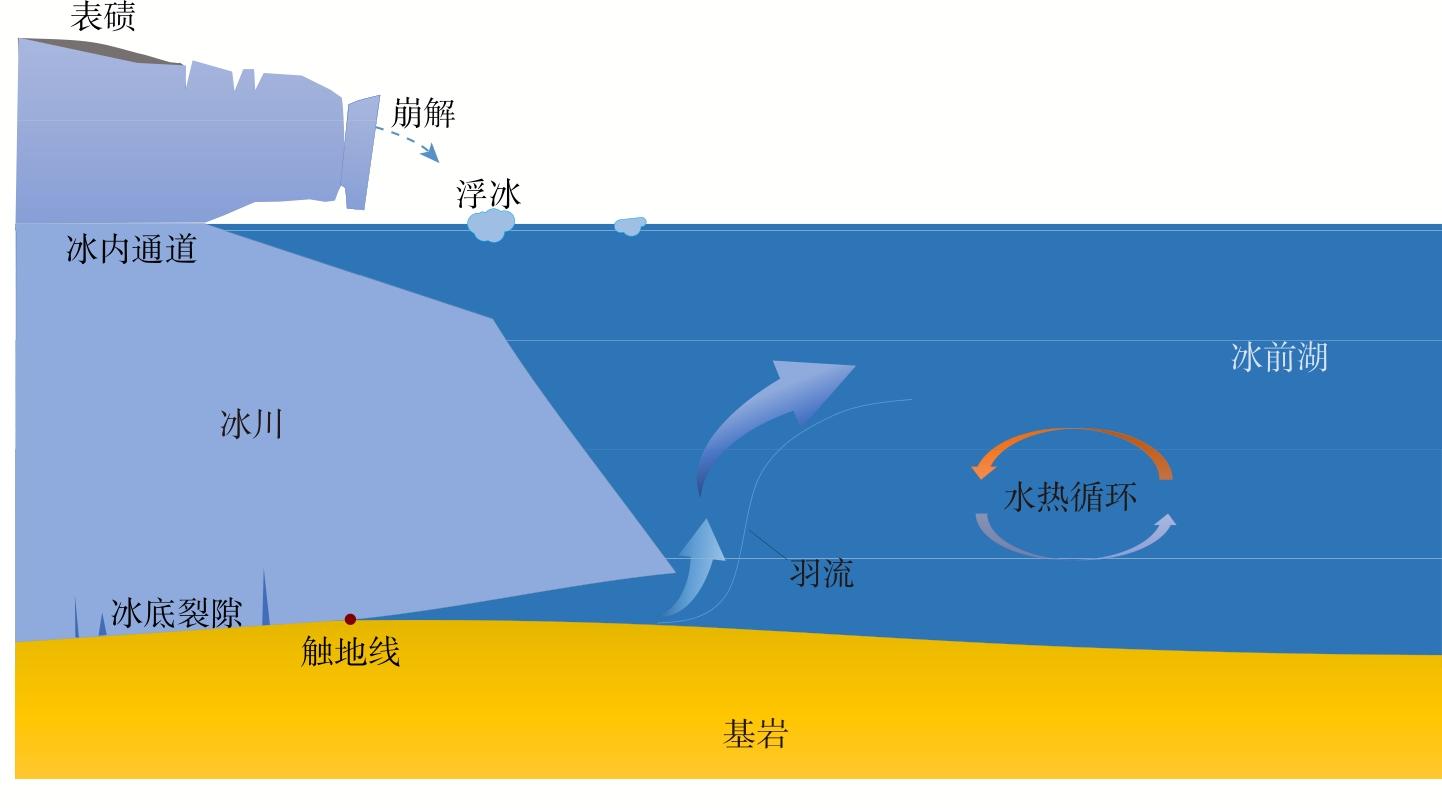
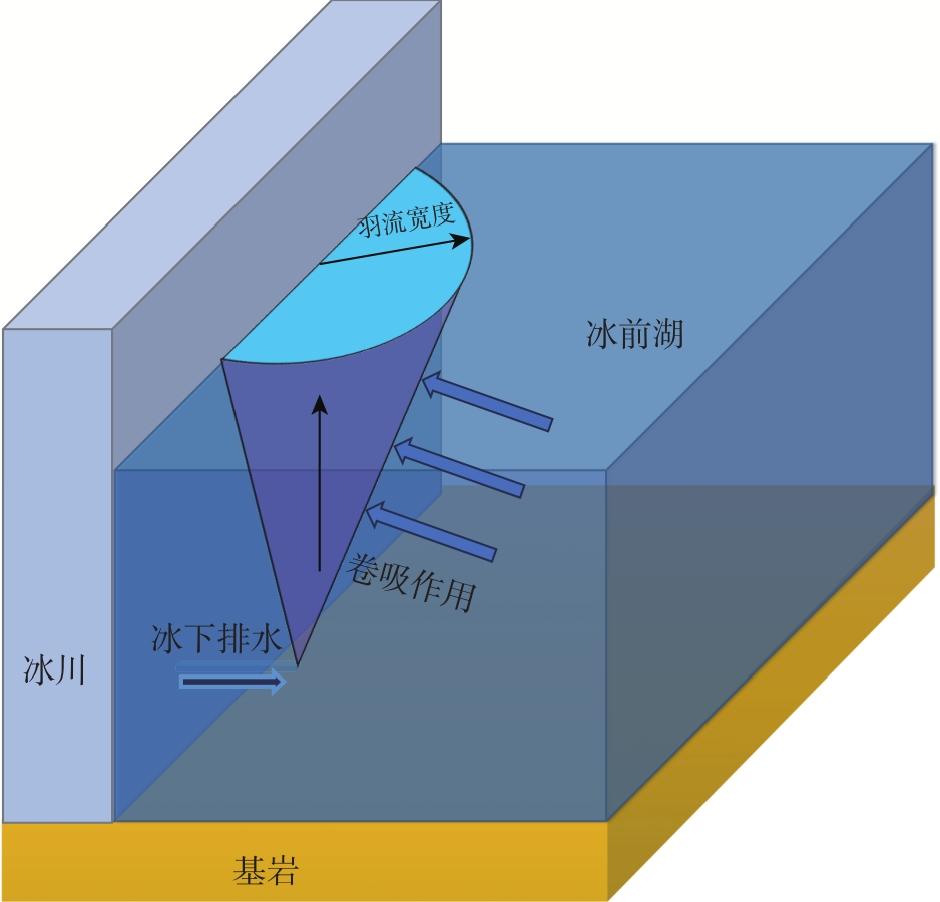
Lake-terminating glaciers are widely distributed in the Himalayas, and their rapid melting and terminal calving are the most significant triggering and influencing factors of glacial lake outburst floods in the region. In recent years, the lake-terminating glaciers have experienced continuous and accelerating mass loss. From 1975 to 2000, the mass loss of lake-terminating glaciers was −0.33±0.07 m w.e.·a−1. In the past 10 years, it has reached −0.56±0.08 m w.e.·a−1, and its average mass loss rate was −0.45±0.08 m w.e.·a−1. The mass loss rate of lake-terminating glaciers is significantly higher than that of others, and terminal melting and calving are the primary reasons. The subaqueous mass loss of lake-terminating glaciers terminus cannot be accurately estimated. The plume model is widely used to simulate the melting of tidewater glaciers, providing a feasible method for determining the lake-ice mass/heat exchange process at the lake-terminating glaciers terminus. The amount of subglacial meltwater runoff, the cross-section shape of the glacier terminal, and the temperature and density of lake water significantly affect the estimation results of the plume model. Evaluating the underwater melting characteristics of glacier terminals based on the plume model will lay the foundation for accurately estimating future glacier mass changes.

Cite this article

Shangkun JIA , Junfeng WEI , Fagang ZHANG , Xin WANG . Research review of mass changes for lake-terminating glaciers in the Himalayas[J]. Arid Land Geography, 2024 , 47(7) : 1156 -1164 . DOI: 10.12118/j.issn.1000-6060.2023.566

在全球持续变暖的气候背景下,存储着大量淡水资源的山地冰川普遍持续且加速退缩 [1-2]。入湖冰川受冰前湖影响,相较于其他类型冰川物质损失更为明显[3-4]。冰前湖通过湖-冰物/热交换[5-6],促进入湖冰川末端消融和冰体流动[7-8],同时可能引发冰体崩解[9],最终导致冰川末端加速退缩[10-11],并进一步提高冰湖扩张速率[12-13]。1990—2018年亚洲高山区冰前湖数量增加了10%,面积增加了53%[14]。入湖冰川的快速消融和末端崩解是冰湖溃决洪水的重要影响因素[15],喜马拉雅山地区有3/4的冰湖溃决事件由冰川末端崩解触发[16]。且随着入湖冰川的进一步退缩,未来冰湖溃决洪水的潜在危险仍会继续增加[10]
喜马拉雅山地区是山地冰川和冰湖的主要集中发育区之一[17],其中入湖冰川610条,占区域冰川数量的13%和冰川总面积的11%[18]。入湖冰川的快速退缩和冰前湖的急速扩张,导致喜马拉雅山地区成为冰湖溃决洪水事件最为频发的区域之一[19]。目前,对入湖冰川物质平衡研究以大地测量法为主,缺乏对冰川末端湖-冰接触面的物/热交换过程的考虑,会低估入湖冰川物质损失速率[12,20],进而影响到冰湖扩张和冰川灾害研究的准确性。
本文将对喜马拉雅山地区入湖冰川分布及变化、入湖冰川物质平衡研究方法以及物质变化影响因素等方面进行综述,同时介绍羽流模型在入湖冰川末端物/热交换过程研究中的应用,分析和揭示喜马拉雅山地区入湖冰川物质变化的研究进展。

1 喜马拉雅山入湖冰川分布及变化特征

目前,喜马拉雅山共有冰川24776条,面积20298 km2;以西段数量最多,共有13146条,面积8350 km2;东段与中段分别有5503和6127条,面积分别为5454 km2和6494 km2[21]。喜马拉雅山地区入湖冰川约占区域冰川总数的13%,面积为2089.82 km2;其中,喜马拉雅山地区东段最多(252条),西段次之(214条),中段有144条(图1);区域内以大于2 km2的冰川为主;区域入湖冰川体积为56.21±5.05 km3,其中喜马拉雅山东段入湖冰川体积占喜马拉雅地区的46.57%,中段与西段分别为30.95%和22.48%[17]
图1 研究区示意图

Fig. 1 Schematic diagram of the study area

当前气候背景下,喜马拉雅山地区冰川呈现物质加速损失趋势[22-23]。2000—2021年喜马拉雅山地区冰川平均物质平衡为-0.40±0.10 m w.e.·a-1,其中东段物质平衡为-0.43±0.11 m w.e.·a-1,中段物质平衡为-0.35±0.09 m w.e.·a-1,西段与东段相当,为-0.42±0.10 m w.e.·a-1[4,7,20,22,24]。相较于山地冰川,入湖冰川物质损失速率有明显升高。1975—2000年喜马拉雅山地区入湖冰川物质平衡为-0.33±0.07 m w.e.·a-1;2000—2016年为-0.56±0.08 m w.e.·a-1[25]。1974—2000年喜马拉雅山地区入湖冰川末端以平均15.9 ±1.1 m·a-1的速率后退,高于山地冰川平均7.1±1.1 m·a-1的末端后退速率,2000—2018年山地冰川和入湖冰川末端平均后退速率分别为10.4±1.4 m·a-1和26.8±1.4 m·a-1,在这2个时期,山地冰川的末端后退速率平均增加了约46%,入湖冰川末端退缩速率增加了近70%[26-27]。1974—2000年喜马拉雅山地区入湖冰川物质平衡(-0.32±0.12 m w.e.·a-1)低于山地冰川物质平衡(-0.23±0.09 m w.e.·a-1);而2000—2015年入湖冰川物质平衡(-0.55±0.12 m w.e.·a-1)与山地冰川物质平衡(-0.37±0.12 m w.e.·a-1)之差是前一时期的2倍,入湖冰川物质损失约占区域冰川总物质损失量的30%[18]。位于喜马拉雅山中段的龙巴萨巴冰川是该区域典型的入湖冰川,1988—2018年冰川物质损失0.286±0.018 km3,占冰川总物质量的8%,其中末端崩解和消融导致的物质损失占区域冰川总物质损失量的23%,且贡献比例从1988—2000年的14%增加到2000—2018年的33%[12,28]
湖-冰相互作用对入湖冰川物质变化存在显著影响[29]。喜马拉雅山地区入湖冰川表面流速的平均值为18.83 m·a-1,而山地冰川表面流速仅为8.24 m·a-1[7,30]。Zhang等[20]研究发现入湖冰川水下物质损失被严重低估,其中喜马拉雅山中段被低估最多(1.2±0.4 Gt)。King等[31]通过研究2000—2015年喜马拉雅山中段珠穆朗玛峰地区入湖冰川的变化,认为在冰前湖发育的不同阶段湖-冰相互作用强度不同,其中冰前湖发育早期对冰川影响较小。Jiang等[32]通过研究也认为喜马拉雅山中段吉隆流域冰前湖通过湖-冰物/热交换加速了冰川的退缩。
入湖冰川快速退缩导致冰前湖加速扩张,冰前湖又通过末端崩解和水下消融加剧入湖冰川物质损失。2020年喜马拉雅山地区冰前湖数量为623个,面积为141.38 km2。2000—2020年喜马拉雅山地区冰前湖的数量增加了47%,面积增加了近33%,体积增加了约42%[20]。然而,冰前湖对喜马拉雅山地区入湖冰川物质损失的研究仍然较为缺乏,冰川物质损失难以精确评估。

2 入湖冰川物质平衡研究方法

入湖冰川的物质变化对冰前湖储水量以及下游生态和环境安全具有重要影响[19,22,33-35]。入湖冰川与其他类型冰川物质变化最主要的区别,是前者末端物质损失受直接接触的冰前湖影响,以消融和崩解等方式直接进入冰湖中[7-9],且末端冰湖的存在,也影响了入湖冰川的动力学过程[10-11,36]。入湖冰川的物质损失可分为厚度减薄和末端退缩2部分,其中前者为表面物质平衡及冰体流动导致,后者为冰体流动、末端崩解与消融共同作用的结果。

2.1 冰川厚度变化

入湖冰川厚度变化的研究方法和其他冰川一致,包括探地雷达等直接测量方式[37-38]、基于不同时期多源冰川表面高程信息等间接测量方式的大地测量法[39-41]以及采用数值模型的冰川厚度模拟[42-43]等。冰川厚度及变化的准确估算对于衡量入湖冰川表面物质平衡具有重要意义。
大地测量方法是目前入湖冰川主要的厚度变化估算方法。实地测量方法观测虽然精度较高,但结果分布稀疏且受地形影响较大,且相比于数值模拟方法,大地测量法不需要繁杂的参数,适合大范围冰川物质变化的计算。基于大地测量法的估算结果[41,44-45],2000—2015年喜马拉雅山东段入湖冰川末端表面高程减薄速率达4 m·a-1,同期的山地冰川高程减薄速率仅为1 m·a-1,二者区别的主要驱动因素是湖-冰接触面物质的加速损失[19]。1974—2015年雅弄冰川积累区和消融区厚度变化率分别为-0.23±0.10 m·a-1和-1.55±0.10 m·a-1,期间冰川物质平衡为-0.73±0.13 m w.e.·a-1,且这种状态仍呈加速趋势[41]。1975—2015年阿布拉莫夫冰川平均厚度变化为-0.43±0.14 m·a-1,期间体积减少了0.45±0.15 km3,由此计算得到的冰川物质平衡为-0.38±0.12 m w.e.·a-1[46]。2012—2017年Breiðamerkurjökull冰川东支末端高程发生明显降低(100~130 m),同期冰川末端平均流速也保持在较高水平(1.63~1.68 m·d-1[47]。2003—2020年Kaskawulsh冰川末端平均表面高程变化为-26.6±1.7 m,期间冰前湖面积也在不断扩张,并于2015年达到最大面积3.6 km2[48]。目前,对入湖冰川的研究多是考虑冰湖扩张、冰川末端退缩与流速之间的相互作用,对末端高程变化的讨论仍比较少,湖-冰接触面物质损失估计不足。

2.2 末端崩解与消融

冰前湖改变了入湖冰川的动力和消融过程,并最终通过末端崩解和消融,加速了入湖冰川物质损失,这是相较于其他类型冰川物质变化的典型特征[20,29]。入湖冰川末端湖-冰物/热交换[18,49-51],促进冰川末端消融和冰体流动,引发冰体崩解[7-9],加速冰川退缩,从而增加冰川物质损失。冰前湖对冰川物质变化的影响可分为冰川末端崩解和消融2部分(图2),前者是冰川末端受重力和冰内水通道的共同作用下,物质突然大规模损失并直接进入冰湖,导致冰川快速退缩,并对冰湖水体产生冲击,这也是冰湖溃决洪水的主要触发因素之一;后者为湖-冰接触面处发生的物/热交换,导致冰川加速融化而致使末端退缩[52-53]
图2 入湖冰川末端形态

Fig. 2 Terminal morphology of lake-terminating glaciers

入湖冰川末端崩解主要受冰体流动和消融空间差异以及裂隙分布的影响[9,54],与末端应力场、冰川表面/底部裂隙深度及含水特征以及末端表面形态等存在联系[55-56]。湖水进入冰体内部及底部,变薄的冰川末端受水体浮力抬升,底部有效压力变小和底部滑动增加,影响冰体流动速率分布[18],导致冰川底部张应力升高,促进底部及表面裂隙发育[54]。Todd等[55]通过构建Full-Stocks三维崩解模型,对格陵兰Store冰川末端崩解过程进行了数值模拟,认为羽流消融特征对冰体崩解作用明显。
入湖冰川末端消融可分为水上和水下消融2部分。水上消融部分可看作冰川末端竖直面的冰崖消融,其与冰川其他区域的冰崖消融的区别,包括冰崖面的角度以及周边地物辐射等。冰川表面冰崖可看作坡度坡向相对稳定的平面,其物质变化除受到太阳辐射的直接影响外,还受到周围环境和冰川表碛的影响,较薄的表碛覆盖会导致冰崖反照率降低加速消融[57]。末端冰崖消融模拟除考虑周边基岩和冰湖坝体长波辐射外,还需要考虑冰前湖随太阳高度角及时间变化的反射与辐射影响[58]。冰川水下融化是冰川物质损失的重要组成部分,但冰下观测的缺乏限制了对湖-冰物质交换的理解[6-20]。入湖冰川水下消融主要受几何形态、湖-冰物/热交换、浮力等的综合影响[59]。冰下融水径流与湖水温度也会使冰川末端水下消融速率加快[60]。冰下融水径流从冰川底部释放后受浮力作用上升并与相对温暖的湖水对流,从而促进冰川消融[6]

2.3 羽流模型

羽流模型是研究水-冰物质/能量交互作用的主要模型之一,在入海冰川末端物质变化研究中得到了广泛应用[61-63]。冰下融水径流从冰川底部接地线处释放进入海洋后,受不同深度的冰水和海水之间温度、盐度和密度差异影响缓慢上升,同时促进水下冰体消融并进一步释放融水,导致冰下径流呈紊流上升且体积逐渐变大(图3),该过程称为浮力羽流理论,羽流卷动上升的过程中,通过卷吸作用,将外围不同温度和密度的水体吸入体内,并挟带其一起卷动上升;进入水体并上升过程中的作用范围称为羽流体[64]。由于水下测量的匮乏,使得对水-冰界面的变化通常以构建模型的方法进行研究,而模型构建的核心便是浮力羽流理论,基于羽流体的质量、动量和热量等属性建立方程[65-66]
d D × U d X = e ˙ + m ˙
d D × U 2 d X = D ρ a - ρ ρ 0 g × s i n α - C d U 2
d D × U × T d X = e ˙ T a + m ˙ T b - C d 1 2 Γ T U T - T b
d D × U × S d X = e ˙ S a + m ˙ S b - C d 1 2 Γ S U S - S b
式中:X为羽流体某横截面距触地线的高度(m),触地线处X=0;D为羽流体宽度或半径(m);U为羽流体垂直上升速率(m·s-1); e ˙为夹带速率(m·s-1); m ˙为冰川水下消融速率(m·d-1); ρ a为周围水体密度(kg·m-3); ρ为羽流密度(kg·m-3), ρ 0为参考密度(kg·m-3);g为重力加速度(m·s-2); C d为阻力系数;T为羽流温度(℃); T a为水体温度(℃); T b为湖-冰接触面处温度(℃); Γ T为热传递系数; Γ S为盐传递系数;S为羽流盐度(psu); S a为水体盐度(psu); S b为湖-冰接触面处盐度(psu)。
图3 冰下释放羽流示意图

Fig. 3 Schematic diagram of subglacial discharge plumes

相较于海水,冰湖与冰川融水径流之间无盐度差异,羽流体仅受到温度和密度影响而紊流上升。但是,与海水中盐度类似的冰前湖的含沙量或浊度,也可以通过影响水体的密度来控制羽流运动。因此,羽流模型应用于入湖冰川时,湖水浊度连同温度,共同决定羽流体及周边水体的密度,并参与模型解算。同时,冰下融水径流释放量也对羽流体的发育存在重要影响,羽流宽度和速度会随着流量的增加而增大,并且羽流上升高度也会更接近于水面[67-68]。较高的冰下融水径流量也会增加冰川末端水下消融速率,且消融速率与冰下径流量和水体温度成正比[69],同时羽流体的不同形态和体积也会影响冰川水下消融速率[60]。根据冰川末端表面和冰下径流出水口的不同,羽流模型发展出了沿接地线建立的二维线性羽流模型[66]和距冰底出水口一定宽度建立的三维锥型羽流模型[70-71]。其中,锥型羽流体在特定的冰下融水径流[72]和羽流体物质运动特征[68]驱动下,相较于线性羽流体表现出与观测数据更好的一致性[73-74],但需要模拟单元分辨率更精细的冰川末端表面形态模型支撑[75];线性羽流体能保证湖-冰物/热交换以及羽流体自身属性随着湖-冰接触面深度不同而稳定变化[66],适合模拟非离散的冰下融水径流冰川[71]。由于冰川末端水下部分不同表面形态对末端消融速率的影响不同[67],“凹”和“凸”冰切面的差异,在相同的水下冰体消融速率作用下会产生差异化的物质亏损量,水-冰接触面越大,冰体融化量就越高;在冰体流动速率影响下,接地线位置会随着时间演化[76],同时导致末端“凹面”进一步内切,改变冰川动力过程,增加冰川末端冰体崩解风险,促进和加速冰川退缩[77]

3 入湖冰川物质变化影响因素

温度和降水是影响包括入湖冰川在内的冰川物质变化的主要因素[78-79]。喜马拉雅山冰川分布和平衡线高度主要受印度季风和西风带影响[80-83],夏季降水由印度季风主导,冬季由中纬度西风主导[84]。由于地形阻碍,喜马拉雅山夏季降水格局表现为南北梯度,其中南坡降水量3000 mm,较北坡高2400 mm;冬季由于印度季风减弱,降水格局表现为东西梯度,自东向西降水量从2000 mm减少为150 mm[82,85-86]。1961—2010年喜马拉雅山地区平均升温速率为0.38 ℃·(10a)-1,总体降水量没有显著变化[87]
冰前湖与冰川末端之间的物质和能量交换,也是入湖冰川快速消融的重要因素,冰前湖的扩张会加快冰体流动,引发冰体崩解[7]。冰前湖对冰川物质变化过程的影响,可分为冰川末端和冰体内部作用2部分:其中前者主要表现为促进冰川末端消融[88],后者则为湖水通过冰内/冰下通道对冰川动力过程产生影响[89]。这2部分作用,均会导致冰川末端的物质变化与再分配发生空间差异,并可能引起末端冰体崩解[90],最终影响冰川物质变化特征并诱发冰湖溃决风险。但冰内/冰下通道变化频繁,难以获取和模拟[91]。且相较于冰川表面消融(冰体减薄)和末端表面形态变化,湖水通过冰内/冰下通道对冰川动力过程直接影响的量级较小[54],湖水温度的升高,将导致热融蚀作用加快,冰川末端曲面进一步内切,加剧水下物质损失[92]。此外,当冰前湖溃决而突然发生大规模排水时,水位急速下降会导致冰川的局部区域在瞬间失去支撑,局部裂隙和水平流动速度突然增加,也会促进冰崩导致冰川物质损失[75,93]。同时,风浪会通过促进湖水的对流,从而影响湖中泥沙的输移[94]。湖泊含沙量与盐度类似,主要通过影响水体密度来控制羽流运动,进而影响冰川末端水下物质损失。
末端表碛覆盖也会提升入湖冰川物质损失速率和发生冰湖溃决洪水灾害的危险性。入湖冰川末端普遍存在表碛覆盖,其对入湖冰川的表面消融和末端崩解均产生影响[13]。前者与其他冰川一样,表碛覆盖通过表面反照率和热传导率影响冰川物质变化:较薄表碛层通过吸收太阳辐射并将热量快速传导至冰川表层加速冰川表面融化;当表碛达到一定厚度时,会阻碍表层热量的传导,抑制冰川融化[95-96]。后者会改变入湖冰川末端内部应力分布及差异,促进冰体发生崩解,且冰体崩解时会带入表碛突然进入冰湖,在激起巨大涌浪的同时也会在一定程度上改变冰湖底部地形和湖岸形态,影响冰湖稳定性[97]

4 结论

入湖冰川在喜马拉雅山地区广泛分布,受湖-冰物/热交换过程影响,其物质损失速率高于其他类型冰川,增加了区域冰川灾害风险,而无法准确定量化评估入湖冰川末端物质变化过程,导致对入湖冰川物质损失及其对冰川灾害风险贡献的低估。本文系统地阐述了喜马拉雅山地区入湖冰川物质变化特征,并通过收集和梳理已有成果中对湖-冰物/热交换及影响过程的相关研究,最终对定量估算入湖冰川物质平衡的研究重点及未来发展方向进行阐述。
(1) 入湖冰川末端通过消融和崩解等形式造成物质损失且直接进入冰湖,而对直接入湖物质评估的忽略或缺失,是当前研究低估入湖冰川物质损失速率的主要原因,因此后续研究须对入湖冰川末端物质损失进行定量刻画。
(2) 厘清入湖冰川末端物质损失过程,关键是冰川末端消融估算和崩解模拟,其中前者可分为水上和水下消融,后者则可采用冰川动力模型。
(3) 广泛应用于入海冰川末端水下消融估算的羽流模型,对入湖冰川末端湖-冰物/热交换过程模拟提供了重要参考和可行方法,且羽流模型成功应用于山地冰川,需要重点关注冰下融水径流量、冰川末端切面形态、湖水温度和密度等重要参数。
[1]
杨雪雯, 王宁练, 梁倩, 等. 近60 a天山北坡冰川变化研究[J]. 干旱区地理, 2023, 46(7): 1073-1083.

[Yang Xuewen, Wang Ninglian, Liang Qian, et al. Glacier changes on the north slope of Tianshan Mountains in recent 60 years[J]. Arid Land Geography, 2023, 46(7): 1073-1083.]

[2]
刘玉婷, 刘景时, 古丽格纳·哈力木拉提, 等. 喜马拉雅山北坡典型冰川流域水文过程比较研究[J]. 冰川冻土, 2022, 44(3): 1063-1069.

DOI

[Liu Yuting, Liu Jingshi, Halimulati Guligena, et al. Comparison of hydrological regime between two glacier-fed watersheds in the north Himalayas[J]. Journal of Glaciology and Geocryology, 2022, 44(3): 1063-1069.]

DOI

[3]
Kulkarni A V, Karyakarte Y. Observed changes in Himalayan glaciers[J]. Current Science, 2014, 106(2): 237-244.

[4]
Pandey P, Ali S N, Champati Ray P K. Glacier-glacial lake interactions and glacial lake development in the central Himalaya, India (1994—2017)[J]. Journal of Earth Science, 2021, 32: 1563-1574.

[5]
Tweed F S, Carrivick J L. Deglaciation and proglacial lakes[J]. Geology Today, 2015, 31(3): 96-102.

[6]
Truffer M, Motyka R J. Where glaciers meet water: Subaqueous melt and its relevance to glaciers in various settings[J]. Reviews of Geophysics, 2016, 54(1): 220-239.

[7]
Pronk J B, Bolch T, King O, et al. Contrasting surface velocities between lake- and land-terminating glaciers in the Himalayan region[J]. The Cryosphere, 2021, 15(12): 5577-5599.

[8]
Nick F M, Vieli A, Howat I M, et al. Large-scale changes in Greenland outlet glacier dynamics triggered at the terminus[J]. Nature Geoscience, 2009, 2: 110-114.

[9]
Benn D I, Åström J A. Calving glaciers and ice shelves[J]. Advances in Physics: X, 2018, 3(1): 1513819, doi: 10.1080/23746149.2018.1513819.

[10]
Shugar D H, Burr A, Haritashya U K, et al. Rapid worldwide growth of glacial lakes since 1990[J]. Nature Climate Change, 2020, 10: 939-945.

[11]
Zhang G Q, Chen W F, Li G, et al. Lake water and glacier mass gains in the northwestern Tibetan Plateau observed from multi-sensor remote sensing data: Implication of an enhanced hydrological cycle[J]. Remote Sensing of Environment, 2020, 237: 111554, doi: 10.1016/j.rse.2019.111554.

[12]
Wei J F, Liu S Y, Wang X, et al. Longbasaba glacier recession and contribution to its proglacial lake volume between 1988 and 2018[J]. Journal of Glaciology, 2021, 67(263): 473-484.

[13]
Song C Q, Sheng Y W, Wang J D, et al. Heterogeneous glacial lake changes and links of lake expansions to the rapid thinning of adjacent glacier termini in the Himalayas[J]. Geomorphology, 2017, 280: 30-38.

[14]
Wang X, Guo X Y, Yang C D, et al. Glacial lake inventory of high-mountain Asia in 1990 and 2018 derived from Landsat images[J]. Earth System Science Data, 2020, 12(3): 2169-2182.

[15]
Taylor C, Robinson T R, Dunning S, et al. Glacial lake outburst floods threaten millions globally[J]. Nature Communications, 2023, 14: 487, doi: 10.1038/s41467-023-36033-x.

PMID

[16]
Nie Y, Liu Q, Wang J D, et al. An inventory of historical glacial lake outburst floods in the Himalayas based on remote sensing observations and geomorphological analysis[J]. Geomorphology, 2018, 308: 91-106.

[17]
Consortium R. Randolph glacier inventory: A dataset of global glacier outlines: Version 6.0[R]. Colorado: National Snow and Ice Data Center, USA, 2017.

[18]
King O, Bhattacharya A, Bhambri R, et al. Glacial lakes exacerbate Himalayan glacier mass loss[J]. Scientific Reports, 2019, 9: 18145, doi: 10.1038/s41598-019-53733-x.

PMID

[19]
张太刚, 王伟财, 高坛光, 等. 亚洲高山区冰湖溃决洪水事件回顾[J]. 冰川冻土, 2021, 43(6): 1673-1692.

DOI

[Zhang Taigang, Wang Weicai, Gao Tanguang, et al. Glacial lake outburst floods on the High Mountain Asia: A review[J]. Journal of Glaciology and Geocryology, 2021, 43(6): 1673-1692.]

DOI

[20]
Zhang G Q, Bolch T, Yao T D, et al. Underestimated mass loss from lake-terminating glaciers in the greater Himalaya[J]. Nature Geoscience, 2023, 16: 333-338.

[21]
Consortium R. Randolph glacier inventory: A dataset of global glacier outlines: Version 7.0[R]. Colorado: National Snow and Ice Data Center, USA, 2023.

[22]
Bolch T, Kulkarni A, Kääb A, et al. The state and fate of Himalayan glaciers[J]. Science, 2012, 336(6079): 310-314.

DOI PMID

[23]
Thakuri S, Salerno F, Smiraglia C, et al. Tracing glacier changes since the 1960s on the south slope of Mt. Everest (central southern Himalaya) using optical satellite imagery[J]. The Cryosphere, 2014, 8(4): 1297-1315.

[24]
Fan Y B, Ke C Q, Zhou X B, et al. Glacier mass-balance estimates over High Mountain Asia from 2000 to 2021 based on ICESat-2 and NASADEM[J]. Journal of Glaciology, 2023, 69(275): 500-512.

[25]
Maurer J M, Schaefer J M, Rupper S, et al. Acceleration of ice loss across the Himalayas over the past 40 years[J]. Science Advances, 2019, 5(6): eaav7266, doi: 10.1126/sciadv.aav7266.

[26]
Azam M F, Wagnon P, Ramanathan A, et al. From balance to imbalance: A shift in the dynamic behaviour of Chhota Shigri glacier, western Himalaya, India[J]. Journal of Glaciology, 2012, 58(208): 315-324.

[27]
Dehecq A, Gourmelen N, Gardner A S, et al. Twenty-first century glacier slowdown driven by mass loss in High Mountain Asia[J]. Nature Geoscience, 2019, 12: 22-27.

[28]
魏俊锋, 张特, 张勇, 等. 入湖冰川物质平衡序列重建与分析——以喜马拉雅山北坡龙巴萨巴冰川为例[J]. 冰川冻土, 2022, 44(3): 914-929.

DOI

[Wei Junfeng, Zhang Te, Zhang Yong, et al. Reconstruction and analysis of mass balance for lake-terminating glaciers: A case study of Longbasaba glacier, north Himalaya[J]. Journal of Glaciology and Geocryology, 2022, 44(3): 914-929.]

DOI

[29]
Zhang G Q, Bolch T, Allen S, et al. Glacial lake evolution and glacier-lake interactions in the Poiqu River Basin, central Himalaya, 1964—2017[J]. Journal of Glaciology, 2019, 65(251): 347-365.

[30]
Agarwal V, de Vries M V W, Haritashya U K, et al. Long-term analysis of glaciers and glacier lakes in the central and eastern Himalaya[J]. Science of the Total Environment, 2023, 898: 165598, doi: 10.1016/j.scitotenv.2023.165598.

[31]
King O, Dehecq A, Quincey D, et al. Contrasting geometric and dynamic evolution of lake and land-terminating glaciers in the central Himalaya[J]. Global and Planetary Change, 2018, 167: 46-60.

[32]
Jiang S, Nie Y, Liu Q, et al. Glacier change, supraglacial debris expansion and glacial lake evolution in the Gyirong River Basin, central Himalayas, between 1988 and 2015[J]. Remote Sensing, 2018, 10(7): 986, doi: 10.3390/rs10070986.

[33]
徐道明, 冯清华. 西藏喜马拉雅山区危险冰湖及其溃决特征[J]. 地理学报, 1989, 44(3): 343-352.

DOI

[Xu Daoming, Feng Qinghua. Dangerous glacial lake and outburst features in Xizang Himalayas[J]. Acta Geographica Sinica, 1989, 44(3): 343-352.]

DOI

[34]
汤明高, 陈浩文, 赵欢乐, 等. 青藏高原冰湖溃决灾害隐患识别、发育规律及危险性评价[J]. 地质通报, 2023, 42(5): 730-742.

[Tang Minggao, Chen Haowen, Zhao Huanle, et al. Identification, development law and risk assessment of the hidden dangers of glacial lake outburst disasters on the Qinghai-Tibet Plateau[J]. Geological Bulletin of China, 2023, 42(5): 730-742.]

[35]
Cook K L, Andermann C, Gimbert F, et al. Glacial lake outburst floods as drivers of fluvial erosion in the Himalaya[J]. Science, 2018, 362(6410): 53-57.

DOI PMID

[36]
Zhang G Q, Yao T D, Xie H J, et al. An inventory of glacial lakes in the Third Pole region and their changes in response to global warming[J]. Global and Planetary Change, 2015, 131: 148-157.

[37]
Pelto B M, Maussion F, Menounos B, et al. Bias-corrected estimates of glacier thickness in the Columbia River Basin, Canada[J]. Journal of Glaciology, 2020, 66(260): 1051-1063.

[38]
Welty E, Zemp M, Navarro F, et al. Worldwide version-controlled database of glacier thickness observations[J]. Earth System Science Data, 2020, 12(4): 3039-3055.

[39]
Li C, Jiang L M, Liu L, et al. Regional and altitude-dependent estimate of the SRTM C/X-band radar penetration difference on High Mountain Asia glaciers[J]. IEEE Journal of Selected Topics in Applied Earth Observations and Remote Sensing, 2021, 14: 4244-4253.

[40]
Zhao F Y, Long D, Li X D, et al. Rapid glacier mass loss in the southeastern Tibetan Plateau since the year 2000 from satellite observations[J]. Remote Sensing of Environment, 2022, 270: 112853, doi: 10.1016/j.rse.2021.112853.

[41]
Zhou Y S, Li X, Zheng D H, et al. Evolution of geodetic mass balance over the largest lake-terminating glacier in the Tibetan Plateau with a revised radar penetration depth based on multi-source high-resolution satellite data[J]. Remote Sensing of Environment, 2022, 275: 113029, doi: 10.1016/j.rse.2022.113029.

[42]
Werder M A, Huss M, Paul F, et al. A Bayesian ice thickness estimation model for large-scale applications[J]. Journal of Glaciology, 2020, 66(255): 137-152.

[43]
Millan R, Mouginot J, Rabatel A, et al. Ice velocity and thickness of the world’s glaciers[J]. Nature Geoscience, 2022, 15: 124-129.

[44]
Moholdt G, Nuth C, Hagen J O, et al. Recent elevation changes of Svalbard glaciers derived from ICESat laser altimetry[J]. Remote Sensing of Environment, 2010, 114(11): 2756-2767.

[45]
Zhao C X, Yang W, Miles E, et al. Thinning and surface mass balance patterns of two neighbouring debris-covered glaciers in the southeastern Tibetan Plateau[J]. The Cryosphere, 2023, 17(9): 3895-3913.

[46]
Denzinger F, Machguth H, Barandun M, et al. Geodetic mass balance of Abramov glacier from 1975 to 2015[J]. Journal of Glaciology, 2021, 67(262): 331-342.

[47]
Baurley N R, Robson B A, Hart J K. Long-term impact of the proglacial lake Jökulsárlón on the flow velocity and stability of Breiðamerkurjökull glacier, Iceland[J]. Earth Surface Processes and Landforms, 2020, 45(11): 2647-2663.

[48]
Main B, Copland L, Smeda B, et al. Terminus change of Kaskawulsh glacier, Yukon, under a warming climate: Retreat, thinning, slowdown and modified proglacial lake geometry[J]. Journal of Glaciology, 2023, 69(276): 936-952.

[49]
Lee E, Carrivick J L, Quincey D J, et al. Accelerated mass loss of Himalayan glaciers since the Little Ice Age[J]. Scientific Reports, 2021, 11: 24284, doi: 10.1038/s41598-021-03805-8.

PMID

[50]
Tsutaki S, Fujita K, Nuimura T, et al. Contrasting thinning patterns between lake- and land-terminating glaciers in the Bhutanese Himalaya[J]. The Cryosphere, 2019, 13(10): 2733-2750.

[51]
Carrivick J L, Tweed F S. A global assessment of the societal impacts of glacier outburst floods[J]. Global and Planetary Change, 2016, 144: 1-16.

[52]
Stubblefield A G, Creyts T T, Kingslake J, et al. Modeling oscillations in connected glacial lakes[J]. Journal of Glaciology, 2019, 65(253): 745-758.

DOI

[53]
Bolch T, Peters J, Yegorov A, et al. Identification of potentially dangerous glacial lakes in the northern Tien Shan[J]. Natural Hazards, 2011, 59: 1691-1714.

[54]
Boyce E S, Motyka R J, Truffer M. Flotation and retreat of a lake-calving terminus, Mendenhall glacier, southeast Alaska, USA[J]. Journal of Glaciology, 2007, 53(181): 211-224.

[55]
Todd J, Christoffersen P, Zwinger T, et al. A full-Stokes 3-D calving model applied to a large Greenlandic glacier[J]. Journal of Geophysical Research: Earth Surface, 2018, 123(3): 410-432.

[56]
Cook S J, Christoffersen P, Todd J, et al. Coupled modelling of subglacial hydrology and calving-front melting at Store glacier, west Greenland[J]. The Cryosphere, 2020, 14(3): 905-924.

[57]
Kneib M, Miles E S, Buri P, et al. Sub-seasonal variability of supraglacial ice cliff melt rates and associated processes from time-lapse photogrammetry[J]. The Cryosphere, 2022, 16(11): 4701-4725.

[58]
Buri P, Miles E S, Steiner J F, et al. A physically based 3-D model of ice cliff evolution over debris-covered glaciers[J]. Journal of Geophysical Research: Earth Surface, 2016, 121(12): 2471-2493.

[59]
Holland D M, Thomas R H, de Young B, et al. Acceleration of Jakobshavn Isbrae triggered by warm subsurface ocean waters[J]. Nature Geoscience, 2008, 1: 659-664.

[60]
Carroll D, Sutherland D A, Shroyer E L, et al. Modeling turbulent subglacial meltwater plumes: Implications for fjord-scale buoyancy-driven circulation[J]. Journal of Physical Oceanography, 2015, 45(8): 2169-2185.

[61]
Burchard H, Bolding K, Jenkins A, et al. The vertical structure and entrainment of subglacial melt water plumes[J]. Journal of Advances in Modeling Earth Systems, 2022, 14(3): e2021MS002925, doi: 10.1029/2021MS002925.

[62]
Slater D A, Straneo F. Submarine melting of glaciers in Greenland amplified by atmospheric warming[J]. Nature Geoscience, 2022, 15: 794-799.

[63]
Cook S J, Christoffersen P, Todd J. A fully-coupled 3D model of a large Greenlandic outlet glacier with evolving subglacial hydrology, frontal plume melting and calving[J]. Journal of Glaciology, 2022, 68(269): 486-502.

[64]
Morton B R, Taylor G I, Turner J S. Turbulent gravitational convection from maintained and instantaneous sources[J]. Proceedings of the Royal Society of London. Series A. Mathematical and Physical Sciences, 1956, 234(1196): 1-23.

[65]
Holland D M, Jenkins A. Modeling thermodynamic ice-ocean interactions at the base of an ice shelf[J]. Journal of Physical Oceanography, 1999, 29(8): 1787-1800.

[66]
Jenkins A. Convection-driven melting near the grounding lines of ice shelves and tidewater glaciers[J]. Journal of Physical Oceanography, 2011, 41(12): 2279-2294.

[67]
Jackson R H, Shroyer E L, Nash J D, et al. Near-glacier surveying of a subglacial discharge plume: Implications for plume parameterizations[J]. Geophysical Research Letters, 2017, 44(13): 6886-6894.

[68]
Slater D, Nienow P, Sole A, et al. Spatially distributed runoff at the grounding line of a large Greenlandic tidewater glacier inferred from plume modelling[J]. Journal of Glaciology, 2017, 63(238): 309-323.

[69]
Kimura S, Holland P R, Jenkins A, et al. The effect of meltwater plumes on the melting of a vertical glacier face[J]. Journal of Physical Oceanography, 2014, 44(12): 3099-3117.

[70]
Cowton T, Slater D, Sole A, et al. Modeling the impact of glacial runoff on fjord circulation and submarine melt rate using a new subgrid-scale parameterization for glacial plumes[J]. Journal of Geophysical Research: Oceans, 2015, 120(2): 796-812.

[71]
Carroll D, Sutherland D A, Hudson B, et al. The impact of glacier geometry on meltwater plume structure and submarine melt in Greenland fjords[J]. Geophysical Research Letters, 2016, 43(18): 9739-9748.

[72]
Bartholomaus T C, Stearns L A, Sutherland D A, et al. Contrasts in the response of adjacent fjords and glaciers to ice-sheet surface melt in west Greenland[J]. Annals of Glaciology, 2016, 57(73): 25-38.

[73]
Mankoff K D, Straneo F, Cenedese C, et al. Structure and dynamics of a subglacial discharge plume in a Greenlandic fjord[J]. Journal of Geophysical Research: Oceans, 2016, 121(12): 8670-8688.

[74]
Stevens L A, Straneo F, Das S B, et al. Linking glacially modified waters to catchment-scale subglacial discharge using autonomous underwater vehicle observations[J]. The Cryosphere, 2016, 10(1): 417-432.

[75]
Xu Y, Rignot E, Fenty I, et al. Subaqueous melting of Store glacier, west Greenland from three-dimensional, high-resolution numerical modeling and ocean observations[J]. Geophysical Research Letters, 2013, 40(17): 4648-4653.

[76]
Slater D A, Nienow P W, Goldberg D N, et al. A model for tidewater glacier undercutting by submarine melting[J]. Geophysical Research Letters, 2017, 44(5): 2360-2368.

[77]
van den Broeke M R, Enderlin E M, Howat I M, et al. On the recent contribution of the Greenland ice sheet to sea level change[J]. The Cryosphere, 2016, 10(5): 1933-1946.

[78]
晋子振, 秦翔, 赵求东, 等. 祁连山西段老虎沟流域消融季径流变化特征研究[J]. 干旱区地理, 2023, 46(2): 178-190.

[Jin Zizhen, Qin Xiang, Zhao Qiudong, et al. Characteristics of runoff variation during ablation season in Laohugou Watershed of western Qilian Mountains[J]. Arid Land Geography, 2023, 46(2): 178-190.]

[79]
谢自楚, 刘潮海. 冰川学导论[M]. 上海: 上海科学普及出版社, 2010: 85-158.

[Xie Zichu, Liu Chaohai. Introduction to glaciation[M]. Shanghai: Shanghai Popular Science Press, 2010: 85-158.]

[80]
Yao T D, Thompson L, Yang W, et al. Different glacier status with atmospheric circulations in Tibetan Plateau and surroundings[J]. Nature Climate Change, 2012, 2: 663-667.

[81]
Mölg T, Maussion F, Scherer D. Mid-latitude westerlies as a driver of glacier variability in monsoonal High Asia[J]. Nature Climate Change, 2014, 4: 68-73.

[82]
Maussion F, Scherer D, Mölg T, et al. Precipitation seasonality and variability over the Tibetan Plateau as resolved by the High Asia reanalysis[J]. Journal of Climate, 2014, 27(5): 1910-1927.

[83]
Fugger S, Fyffe C L, Fatichi S, et al. Understanding monsoon controls on the energy and mass balance of glaciers in the central and eastern Himalaya[J]. The Cryosphere, 2022, 16(5): 1631-1652.

[84]
Bohner J. General climatic controls and topoclimatic variations in central and high Asia[J]. Boreas, 2006, 35(2): 279-295.

[85]
Bookhagen B, Burbank D W. Topography, relief, and TRMM-derived rainfall variations along the Himalaya[J]. Geophysical Research Letters, 2006, 33(13): L08405, doi: 10.1029/2006GL026037.

[86]
Worni R, Huggel C, Stoffel M. Glacial lakes in the Indian Himalayas: From an area-wide glacial lake inventory to on-site and modeling based risk assessment of critical glacial lakes[J]. Science of the Total Environment, 2013, 468: S71-S84.

[87]
张东启, 效存德, 刘伟刚. 喜马拉雅山区1951—2010年气候变化事实分析[J]. 气候变化研究进展, 2012, 8(2): 110-118.

[Zhang Dongqi, Xiao Cunde, Liu Weigang. Analysis on Himalayan climate change in 1951—2010[J]. Climate Change Research, 2012, 8(2): 110-118.]

[88]
Fried M J, Catania G A, Bartholomaus T C, et al. Distributed subglacial discharge drives significant submarine melt at a Greenland tidewater glacier[J]. Geophysical Research Letters, 2015, 42(21): 9328-9336.

[89]
Sutherland J L, Carrivick J L, Gandy N, et al. Proglacial lakes control glacier geometry and behavior during recession[J]. Geophysical Research Letters, 2020, 47(19): e2020GL088865, doi: 10.1029/2020GL088865.

[90]
Werder M A, Hewitt I J, Schoof C G, et al. Modeling channelized and distributed subglacial drainage in two dimensions[J]. Journal of Geophysical Research: Earth Surface, 2013, 118(4): 2140-2158.

[91]
Sugden D E, Clapperton C M, Knight P G. A jökulhlaup near Søndre Strømfjord, west Greenland, and some effects on the ice-sheet margin[J]. Journal of Glaciology, 1985, 31(109): 366-368.

[92]
Carrivick J L, Tweed F S, Sutherland J L, et al. Toward numerical modeling of interactions between ice-marginal proglacial lakes and glaciers[J]. Frontiers in Earth Science, 2020, 8: 577068, doi: 10.3389/feart.2020.577068.

[93]
Mallalieu J, Carrivick J L, Quincey D J, et al. Calving seasonality associated with melt-undercutting and lake ice cover[J]. Geophysical Research Letters, 2020, 47(8): e2019GL086561, doi: 10.1029/2019GL086561.

[94]
van Wyk de Vries M, Ito E, Shapley M, et al. Physical limnology and sediment dynamics of Lago Argentino: The world’s largest ice-contact lake[J]. Journal of Geophysical Research: Earth Surface, 2022, 127(3): e2022JF006598, doi: 10.1029/2022JF006598.

[95]
Östrem G. Ice melting under a thin layer of moraine, and the existence of ice cores in moraine ridges[J]. Geografiska Annaler, 1959, 41(4): 228-230.

[96]
Reznichenko N, Davies T, Shulmeister J, et al. Effects of debris on ice-surface melting rates: An experimental study[J]. Journal of Glaciology, 2010, 56(197): 384-394.

[97]
Veh G, Korup O, Walz A. Hazard from Himalayan glacier lake outburst floods[J]. Proceedings of the National Academy of Sciences, 2020, 117(2): 907-912.

Outlines

/