
Simulation of storm flood inundation and critical rainfall threshold for disaster in Subash Reservoir based on two types of precipitation data
Received date: 2023-10-11
Revised date: 2023-12-06
Online published: 2026-03-11
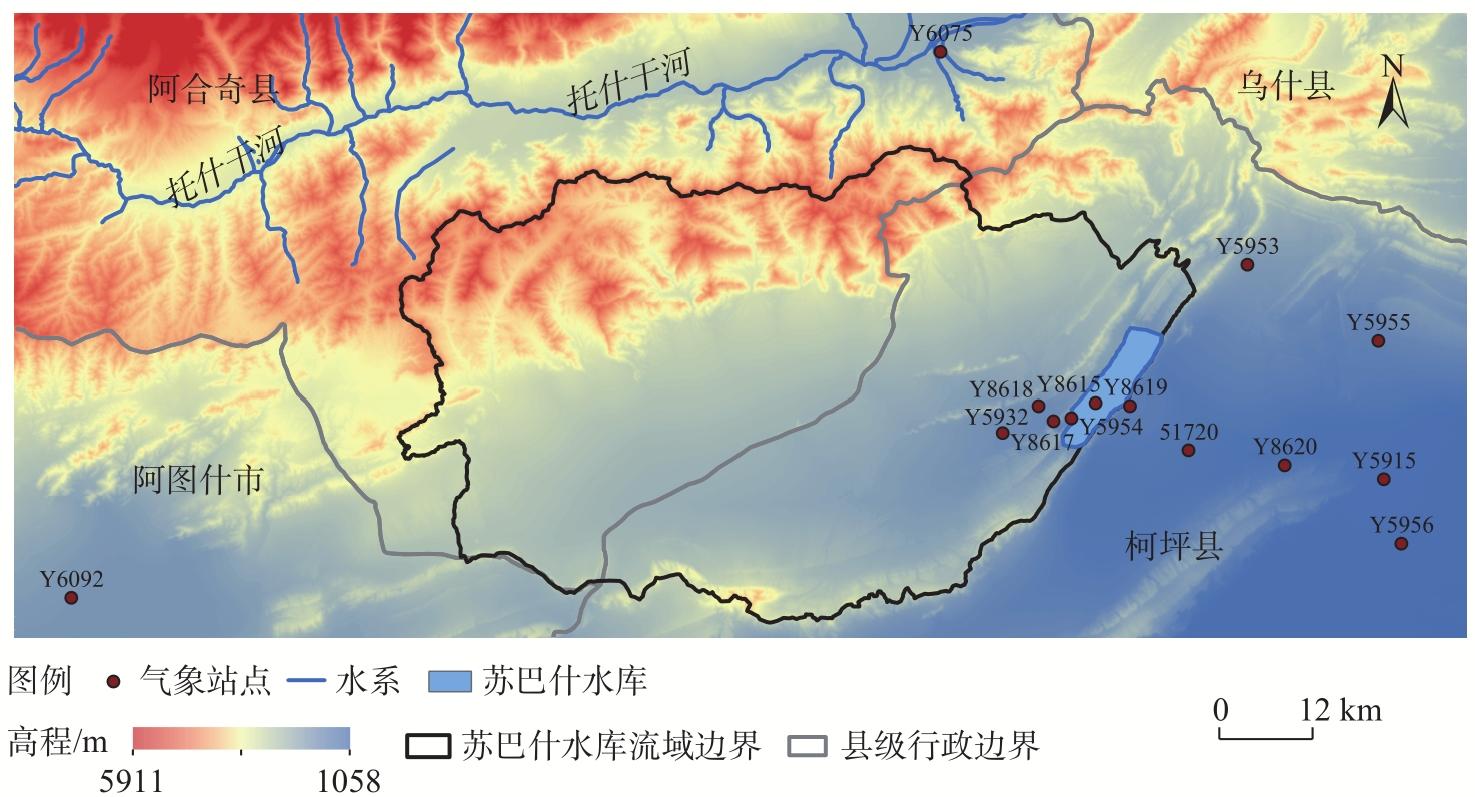
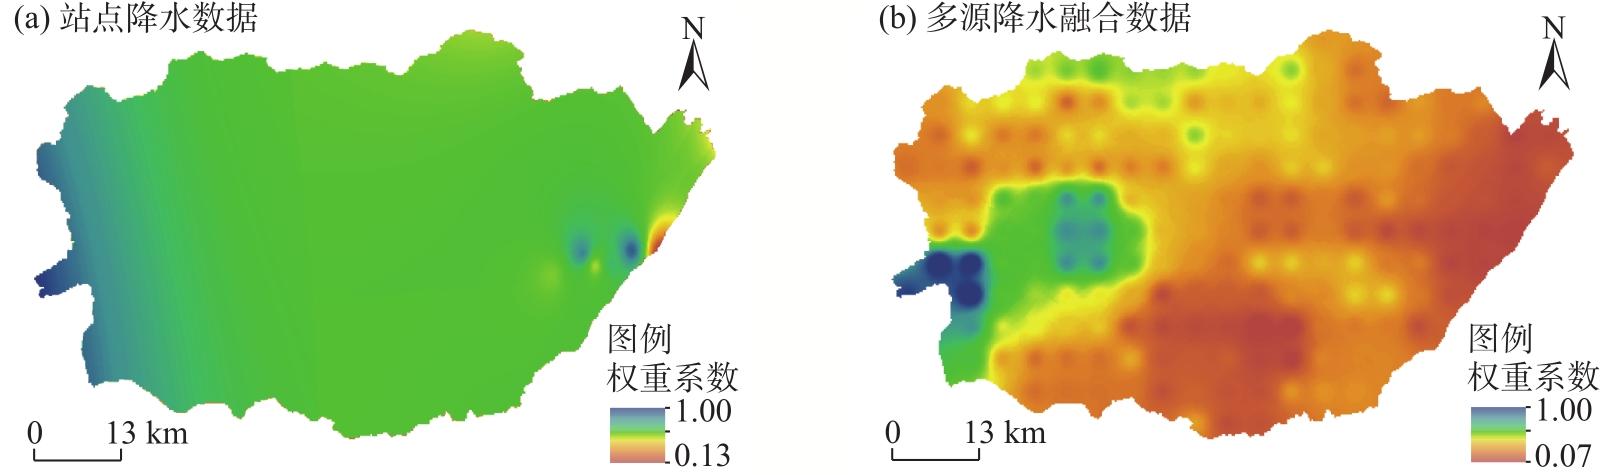
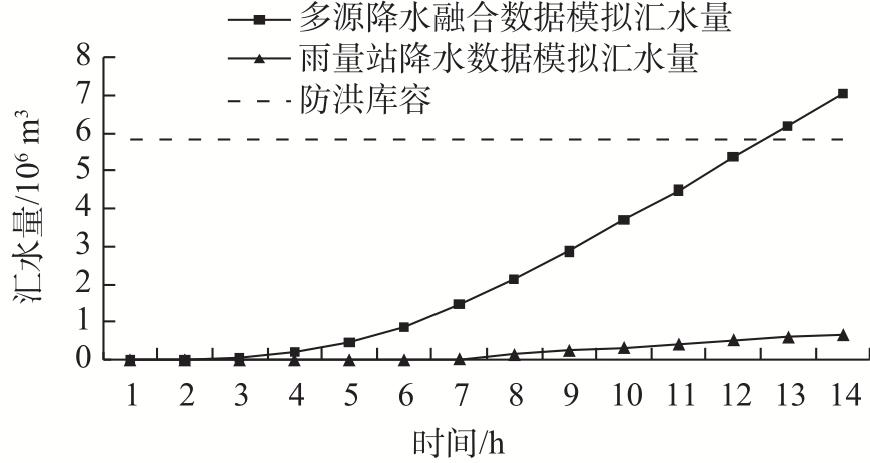
This study focuses on the Subash Reservoir area in the Aksu Prefecture, Xinjiang, China, employing various data sources, including merged precipitation, rainfall station, digital elevation model, and land-use data. Using the FloodArea model, a refined simulation of typical torrential rain-induced flood processes in the Subash Reservoir is conducted. By analyzing the inundation depth and runoff volume, and the simulation results of two precipitation data sources are compared, and a precipitation-inundation depth relationship model is established, determining critical rainfall thresholds corresponding to the sediment-flushing gate bottom elevation, flood limit water level, spillway gate weir top elevation, and dam crest elevation. The results reveal that the FloodArea model driven by multi-source precipitation fusion data has higher accuracy and closer approximation to the actual values for the inundation depth and calculated runoff volume in the Subash Reservoir than the model driven by rain gauge precipitation data. The error simulation rates for inundation depth of the two kind of data are 8.59% and 18.67%, respectively. The cumulative 4-hour precipitation thresholds for reaching inundation levels corresponding to the sediment-flushing gate bottom elevation, flood limit water level, spillway gate weir top elevation, and dam crest elevation of the Subash Reservoir are 7.1 mm, 20.1 mm, 32.9 mm, and 44.7 mm, respectively. The results provide a theoretical reference for torrential rain-induced early flood warning in the Subash Reservoir region to enhance the capability of early flood warning for such scenarios.
Liancheng ZHANG , Jiayi SI , Liequn HU , Meixia WANG , Taixi ZHANG . Simulation of storm flood inundation and critical rainfall threshold for disaster in Subash Reservoir based on two types of precipitation data[J]. Arid Land Geography, 2024 , 47(7) : 1147 -1155 . DOI: 10.12118/j.issn.1000-6060.2023.565
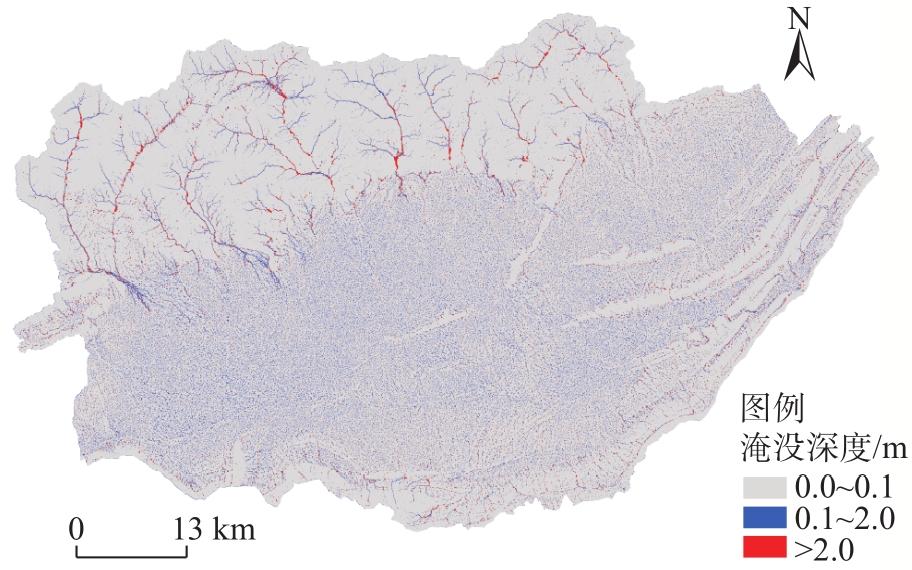
图3 研究区第14 h淹没空间分布Fig. 3 Spatial distribution of inundation in the 14th hour in the study area |
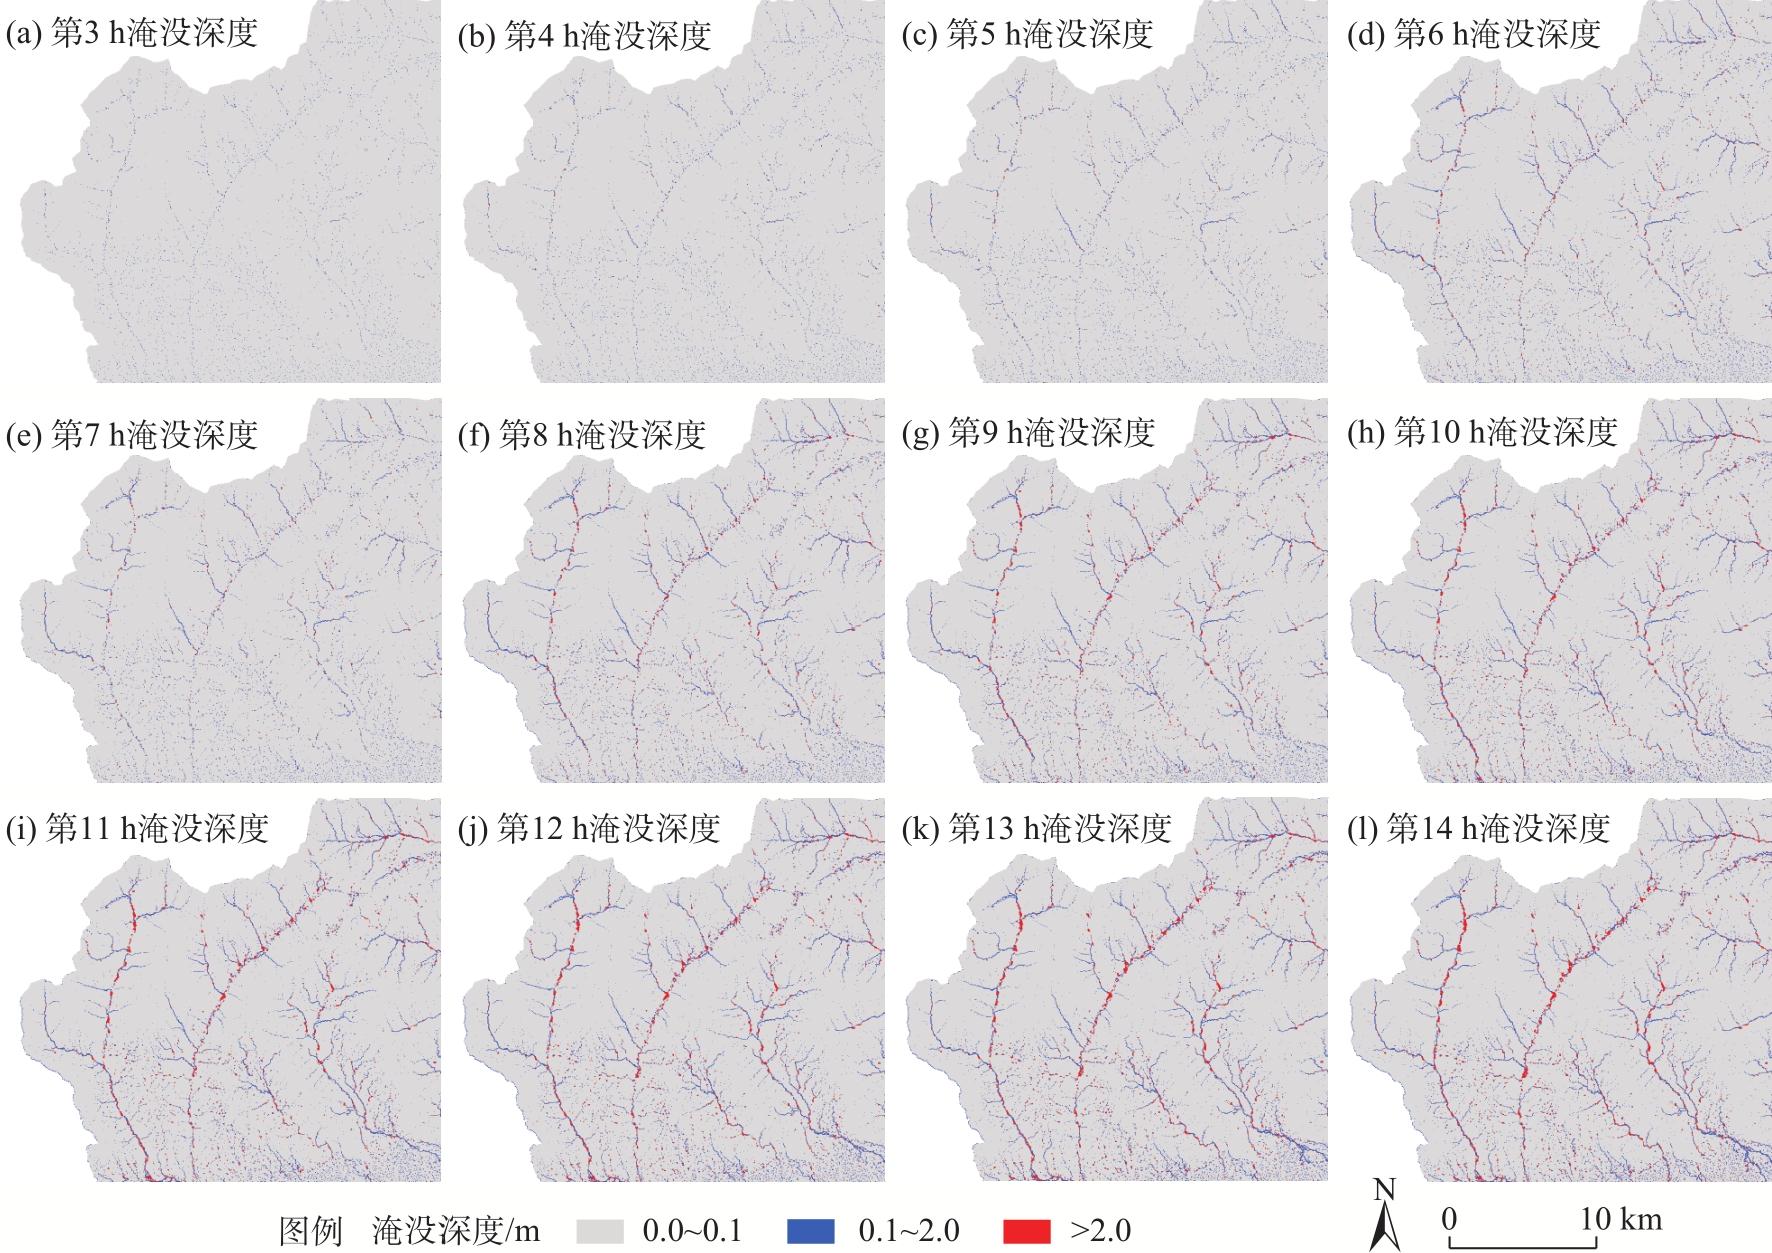
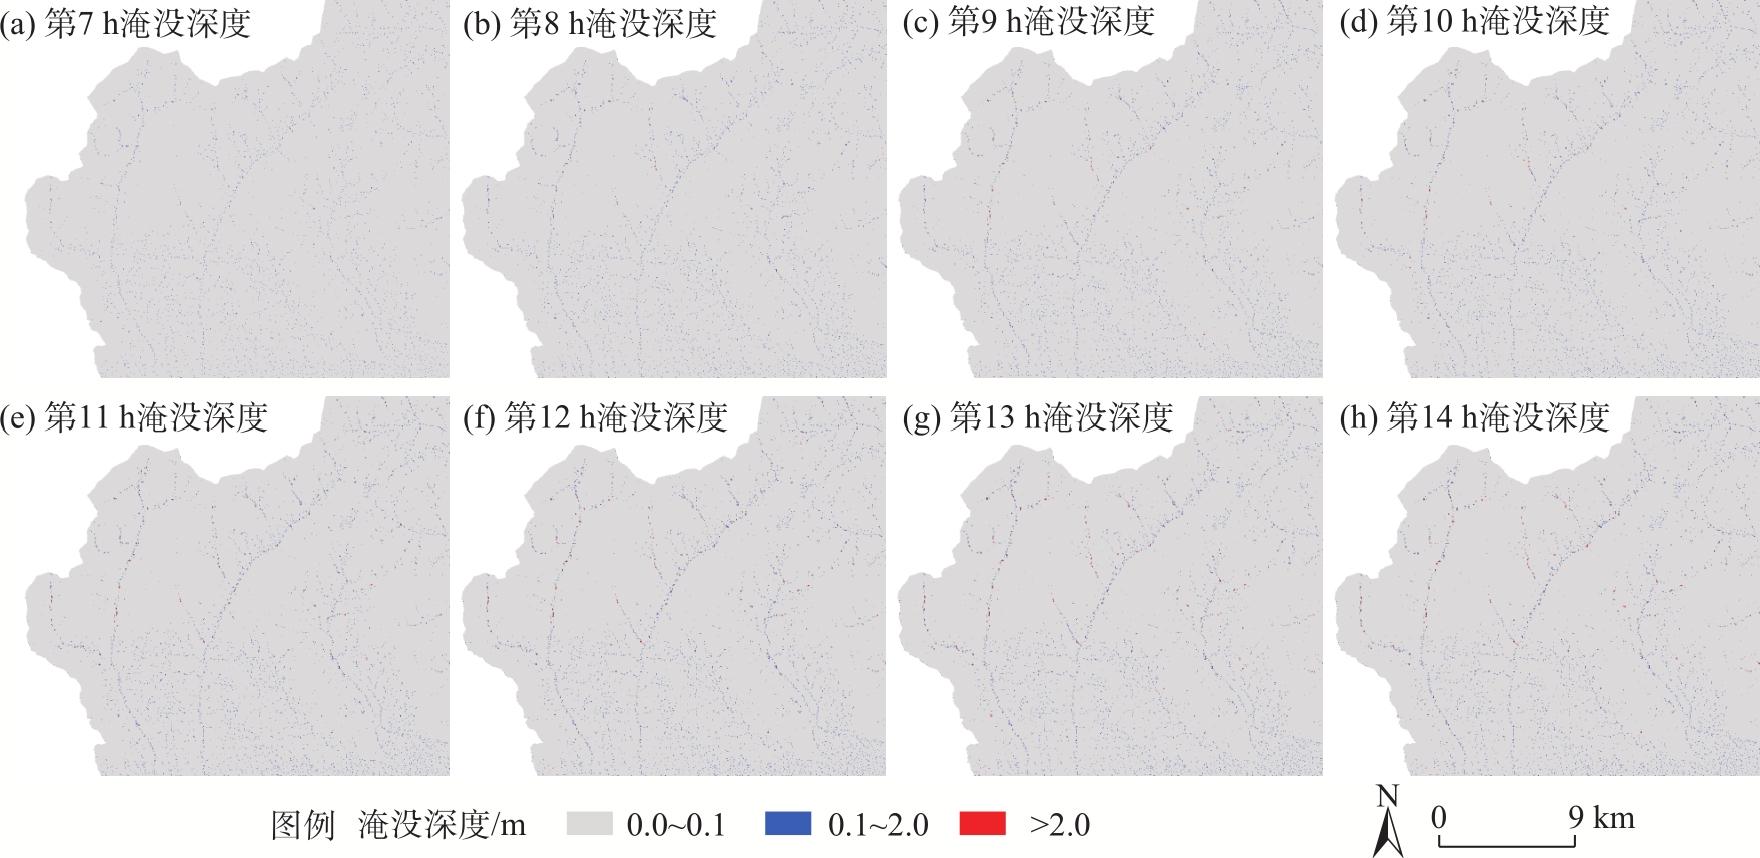
图4 多源降水融合数据驱动的FloodArea模型反演研究区局部逐小时淹没过程Fig. 4 Inversion of local hourly flooding process in the study area driven by multi-source precipitation fusion data using the FloodArea model |
表1 模拟淹没深度和实测淹没深度Tab. 1 Simulated and observed inundation depths |
| 序号 | 经度/°E | 纬度/°N | 实测淹没深度/m | 模拟淹没深度/m | |
|---|---|---|---|---|---|
| 多源降水融合数据 | 气象站点降水数据 | ||||
| 1 | 78.92 | 40.57 | 0.79 | 0.83 | 0.53 |
| 2 | 78.92 | 40.57 | 0.30 | 0.38 | 0.17 |
| 3 | 78.90 | 40.55 | 0.31 | 0.40 | 0.27 |
| 4 | 78.82 | 40.53 | 0.17 | 0.22 | 0.13 |
| 5 | 78.79 | 40.52 | 0.49 | 0.53 | 0.29 |
| 6 | 78.79 | 40.52 | 0.52 | 0.58 | 0.43 |
| 7 | 78.79 | 40.52 | 0.59 | 0.62 | 0.47 |
| 8 | 78.79 | 40.52 | 0.32 | 0.37 | 0.38 |
| 9 | 78.76 | 40.52 | 0.50 | 0.48 | 0.38 |
| 10 | 78.75 | 40.51 | 0.17 | 0.22 | 0.07 |
| 11 | 78.75 | 40.51 | 0.33 | 0.29 | 0.23 |
| 12 | 78.75 | 40.51 | 0.35 | 0.42 | 0.32 |
| 13 | 78.73 | 40.50 | 0.40 | 0.45 | 0.28 |
| 14 | 78.92 | 40.56 | 0.31 | 0.34 | 0.23 |
| 15 | 78.92 | 40.56 | 0.43 | 0.45 | 0.44 |
| 16 | 78.92 | 40.56 | 0.28 | 0.28 | 0.23 |
| 17 | 78.92 | 40.56 | 0.21 | 0.21 | 0.19 |
| 18 | 78.92 | 40.56 | 0.36 | 0.36 | 0.35 |
| 19 | 78.92 | 40.56 | 0.35 | 0.36 | 0.34 |
| 20 | 78.92 | 40.56 | 0.24 | 0.25 | 0.24 |
表2 水库各指标高程参数和致灾临界雨量阈值Tab. 2 Elevation parameters and critical rainfall thresholds for reservoir indicators |
| 指标参数 | 冲砂闸底板高程 | 汛限水位 | 泄洪闸堰顶高程 | 坝顶高程 |
|---|---|---|---|---|
| 距海平面高度/m | 1293.0 | 1302.0 | 1310.8 | 1319.0 |
| 距地面高度/m | 3.0 | 12.0 | 20.8 | 29.0 |
| 致灾临界雨量阈值/mm | 7.1 | 20.1 | 32.9 | 44.7 |
表3 不同小时累积降水与淹没深度相关性Tab. 3 Correlation between accumulated precipitation and inundation depth at different hours |
| 累积小时/h | 1 | 2 | 3 | 4 | 5 | 6 | 7 | 8 | 9 | 10 |
|---|---|---|---|---|---|---|---|---|---|---|
| 相关系数 | 0.26 | 0.26 | 0.37 | 0.73* | 0.64 | 0.67 | 0.83* | 0.69 | 0.70 | 0.67 |
注:*表示通过0.05显著性水平检验。 |
| [1] |
张磊, 王文, 文明章, 等. 基于“FloodArea”模型的山洪灾害精细化预警方法研究[J]. 复旦学报 (自然科学版), 2015, 54(3): 282-287.
[
|
| [2] |
赵琳娜, 包红军, 田付友, 等. 水文气象研究进展[J]. 气象, 2012, 38(2): 147-154.
[
|
| [3] |
叶勇, 王振宇, 范波序. 浙江省小流域山洪灾害临界雨量确定方法分析[J]. 水文, 2008, 28(1): 56-58.
[
|
| [4] |
李兰, 周月华, 叶丽梅, 等. 基于GIS淹没模型的流域暴雨洪涝风险区划方法[J]. 气象, 2013, 39(1): 112-117.
[
|
| [5] |
叶金印, 李致家, 常露. 基于动态临界雨量的山洪预警方法研究与应用[J]. 气象, 2014, 40(1): 101-107.
[
|
| [6] |
谢五三, 田红, 卢燕宇. 基于FloodArea模型的大通河流域暴雨洪涝灾害风险评估[J]. 暴雨灾害, 2015, 34(4): 384-387.
[
|
| [7] |
郑璟, 谭畅, 李春梅. 基于洪水淹没模型的山洪致灾临界雨量确定方法研究[C]// 宋军, 李景涛. 湖泊湿地与绿色发展——第五届中国湖泊论坛论文集. 长春: 吉林人民出版社, 2015: 98-102.
[
|
| [8] |
陈晓丹. 基于FloodArea的山洪淹没灾害预警研究[D]. 长沙: 湖南师范大学, 2018.
[
|
| [9] |
张明达, 李蒙, 戴丛蕊, 等. 基于FloodArea模型的云南山洪淹没模拟研究[J]. 灾害学, 2016, 31(1): 78-82.
[
|
| [10] |
卢燕宇, 邓汗青, 田红, 等. 改进的暴雨洪水淹没模拟算法及其在淮河流域的应用研究[J]. 气象科技进展, 2020, 10(5): 121-129.
[
|
| [11] |
张连成, 江远安, 刘精, 等. 基于FloodArea模型的新疆山洪淹没模拟及致灾临界雨量阈值的研究——以皮里青河流域为例[J]. 干旱区地理, 2018, 41(1): 48-55.
[
|
| [12] |
张连成, 余行杰, 邵伟玲, 等. 基于不同数据的新疆山洪淹没模拟及致灾阈值分析[J]. 高原气象, 2020, 39(1): 80-89.
[
|
| [13] |
吴秀兰, 江远安, 余行杰, 等. 基于FloodArea的新疆依格孜牙河流域山洪灾害风险区划[J]. 干旱气象, 2019, 37(4): 663-669.
[
|
| [14] |
姚俊强, 杨青, 毛炜峄, 等. 基于HYSPLIT4的一次新疆天山夏季特大暴雨水汽路径分析[J]. 高原气象, 2018, 37(1): 68-77.
[
|
| [15] |
潘旸, 谷军霞, 徐宾, 等. 多源降水数据融合研究及应用进展[J]. 气象科技进展, 2018, 8(1): 143-152.
[
|
| [16] |
许冠宇, 李琳琳, 田刚, 等. 国家级降水融合产品在长江流域的适用性评估[J]. 暴雨灾害, 2020, 39(4): 400-408.
[
|
| [17] |
李鹤, 李玉建, 俞晓伟, 等. 苏巴什水库泄水建筑物消能防冲优化试验研究[J]. 水利技术监督, 2020(6): 156-160.
[
|
| [18] |
孔灿. 新疆柯坪苏巴什水库水雨情预警系统设计及运行管理探讨[J]. 地下水, 2022, 44(1): 230-232.
[
|
| [19] |
|
| [20] |
王梅霞, 张太西, 余行杰, 等. 新疆哈密2018·7·31特大暴雨山洪汇水量估算与应用研究[J]. 干旱区地理, 2020, 43(4): 939-945.
[
|
| [21] |
罗尊骅, 林广发, 张容焱, 等. FloodArea模型糙率系数改进方法[J]. 海南师范大学学报(自然科学版), 2018, 31(1): 98-104.
[
|
| [22] |
郭玉琳, 赵勇, 周雅蔓, 等. 新疆天山山区夏季降水日变化特征及其与海拔高度关系[J]. 干旱区地理, 2022, 45(1): 57-65.
[
|
| [23] |
胡轶佳, 吴欣原, 李荔珊, 等. 基于年际增量法的中国西部山区夏季降水统计预测研究[J]. 气象与减灾研究, 2019, 42(3): 161-169.
[
|
| [24] |
张雯, 马阳, 王岱, 等. 不同时间尺度海温因子对西北地区东部夏季降水的影响及预测[J]. 干旱区研究, 2023, 40(4): 532-542.
[
|
| [25] |
赵泽艺, 李朝阳, 王洪博, 等. 南疆盐碱土水、氮、盐光谱特征及其反演模型[J]. 灌溉排水学报, 2023, 42(7): 93-100.
[
|
/
| 〈 |
|
〉 |