
Spatial and temporal variation characteristics of comfort index of human body in Xizang Plateau
Received date: 2023-05-16
Revised date: 2023-06-19
Online published: 2026-03-11
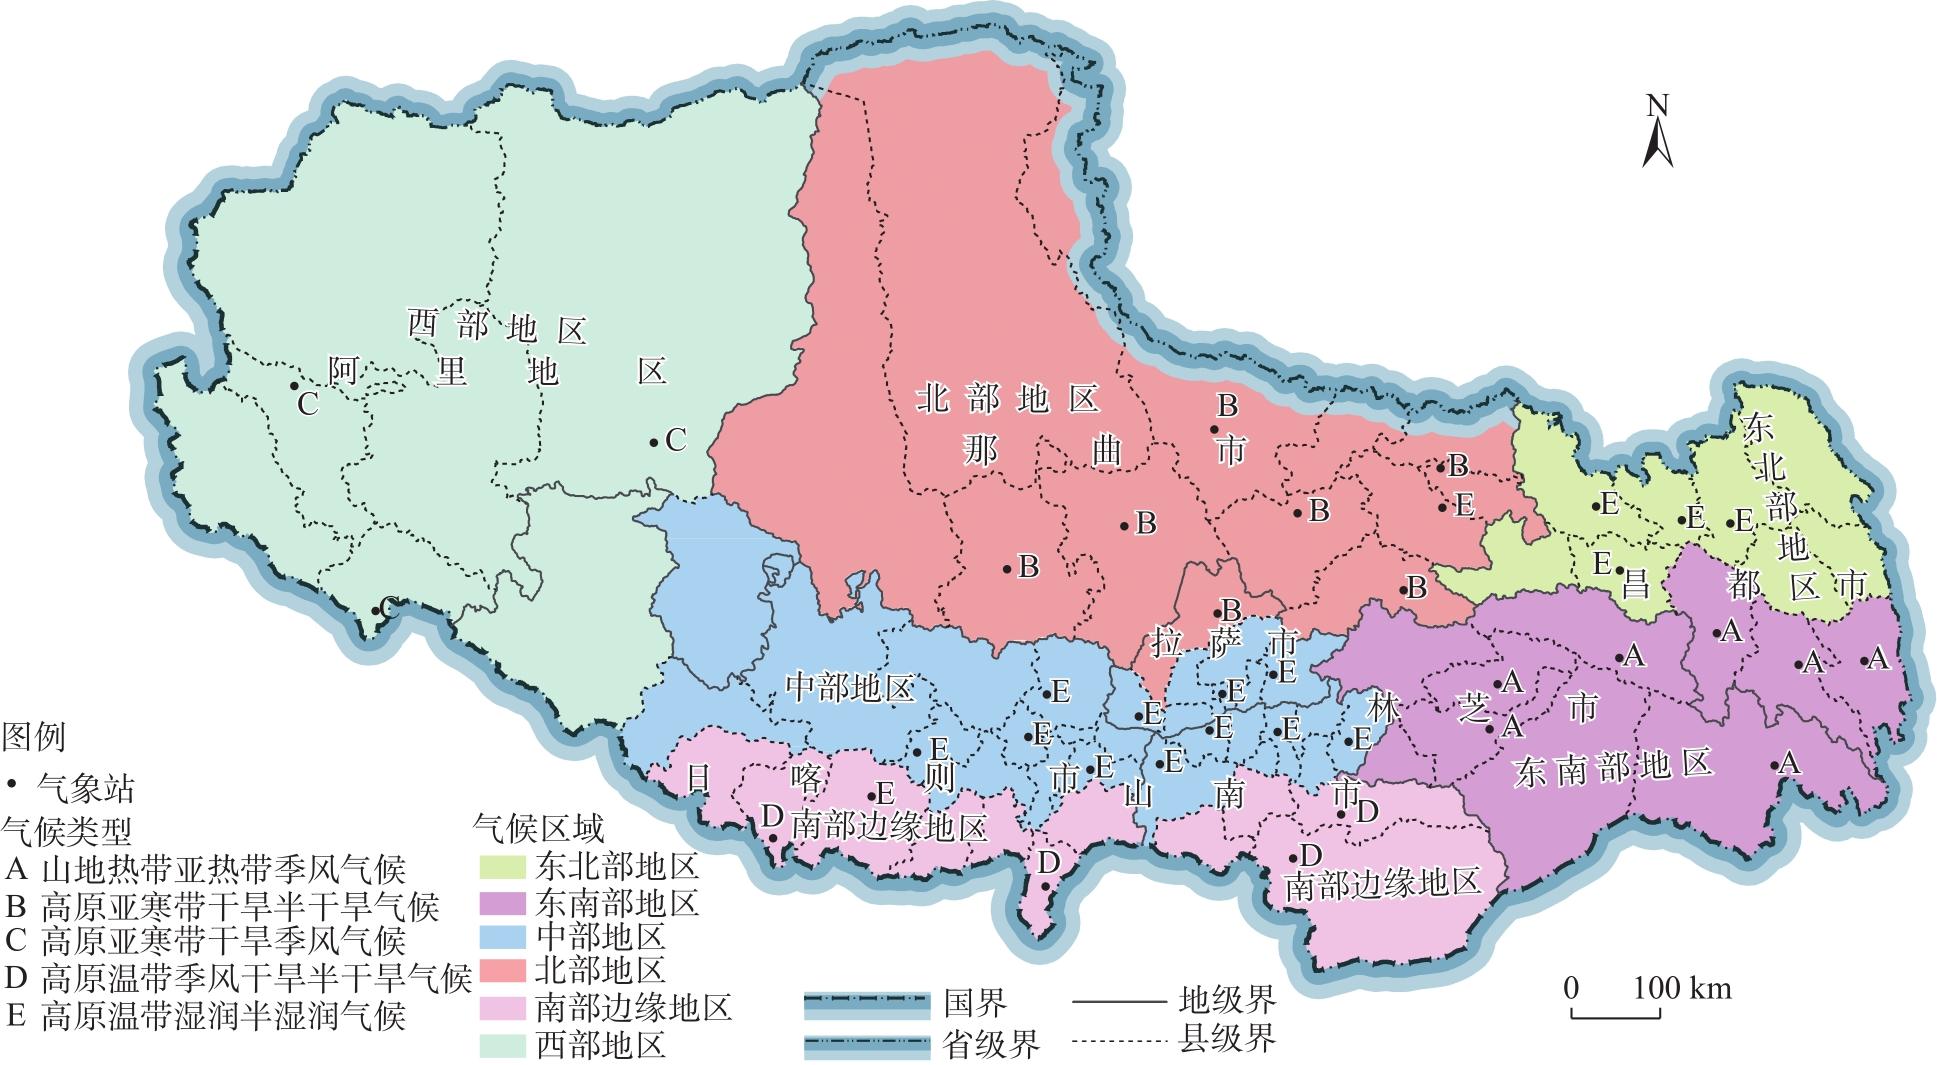
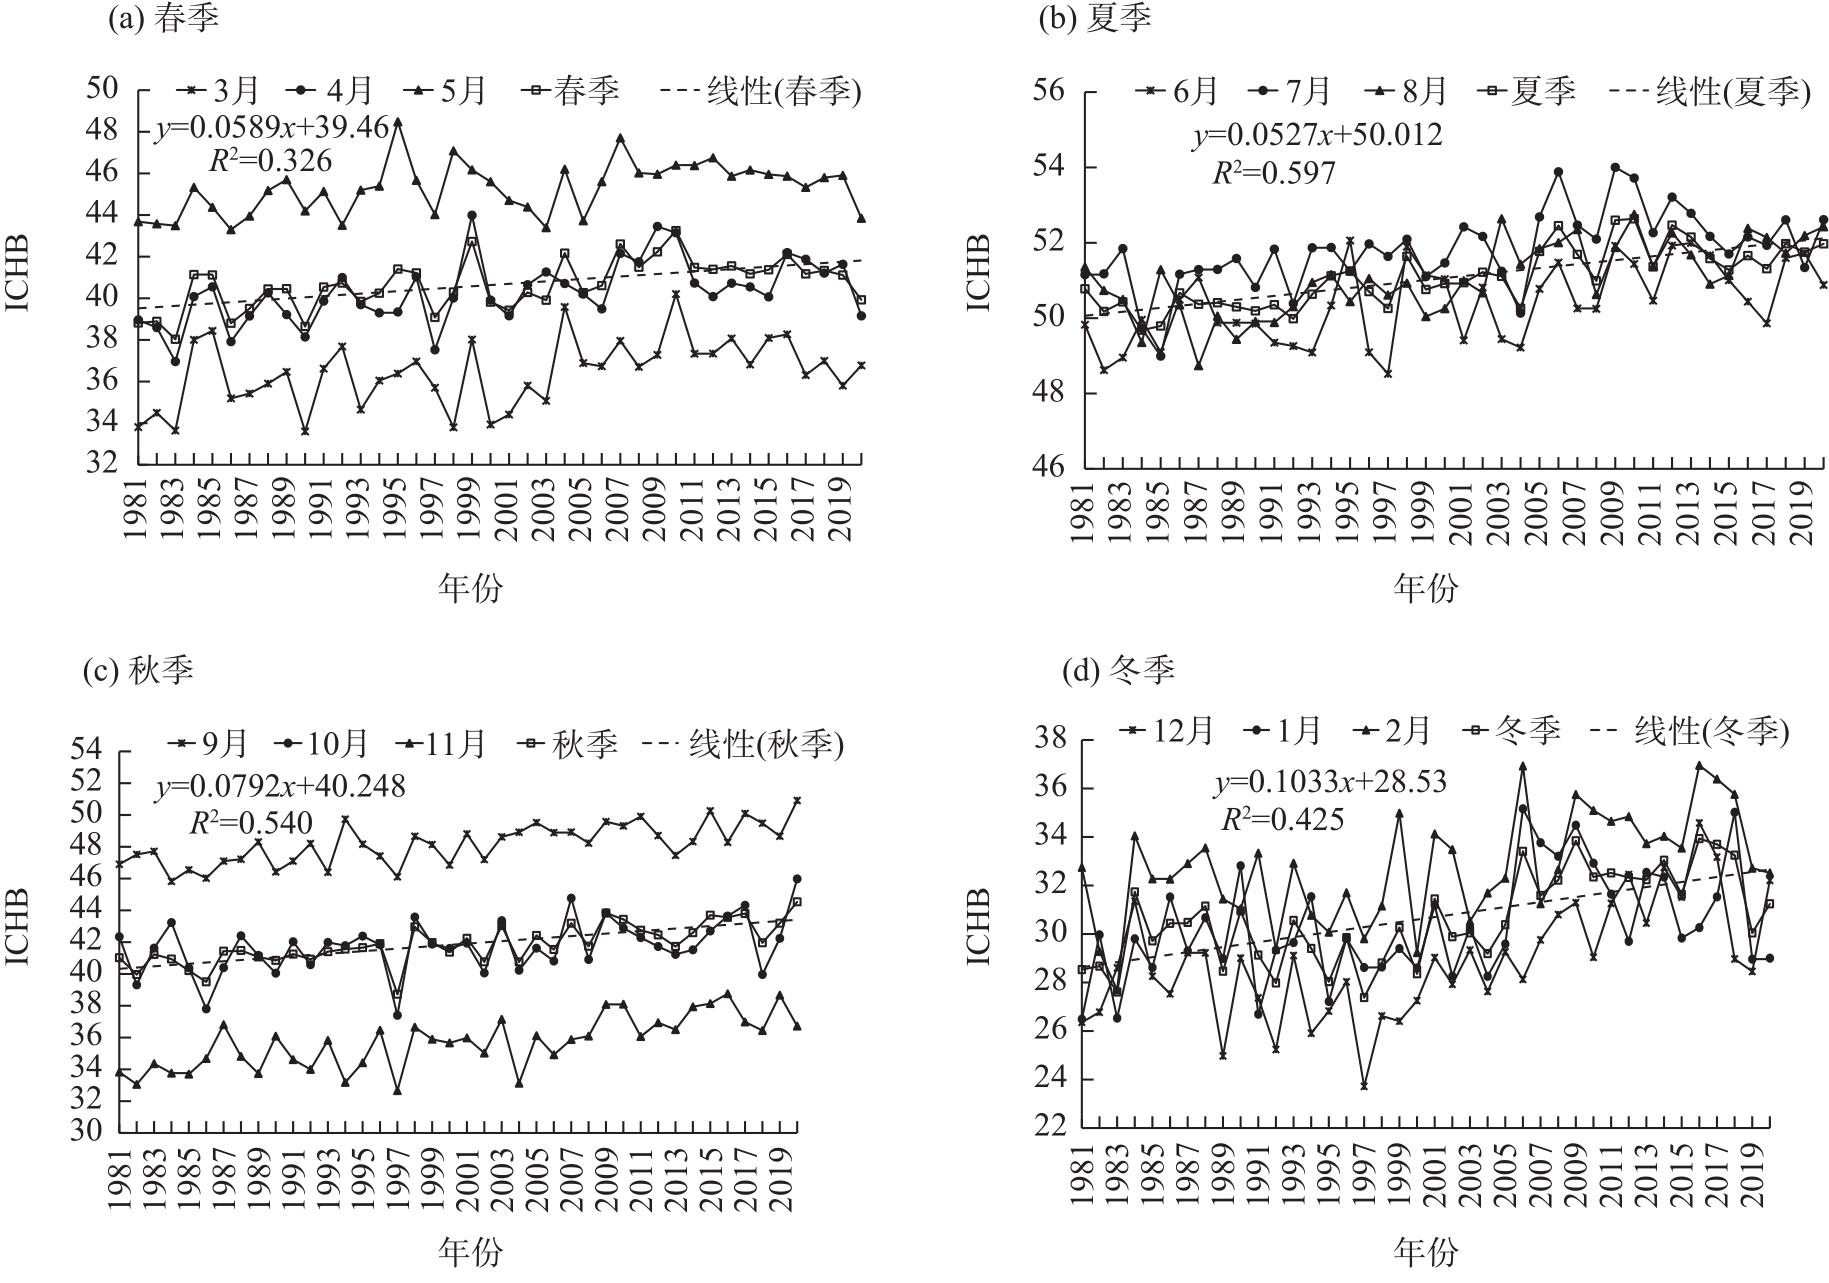
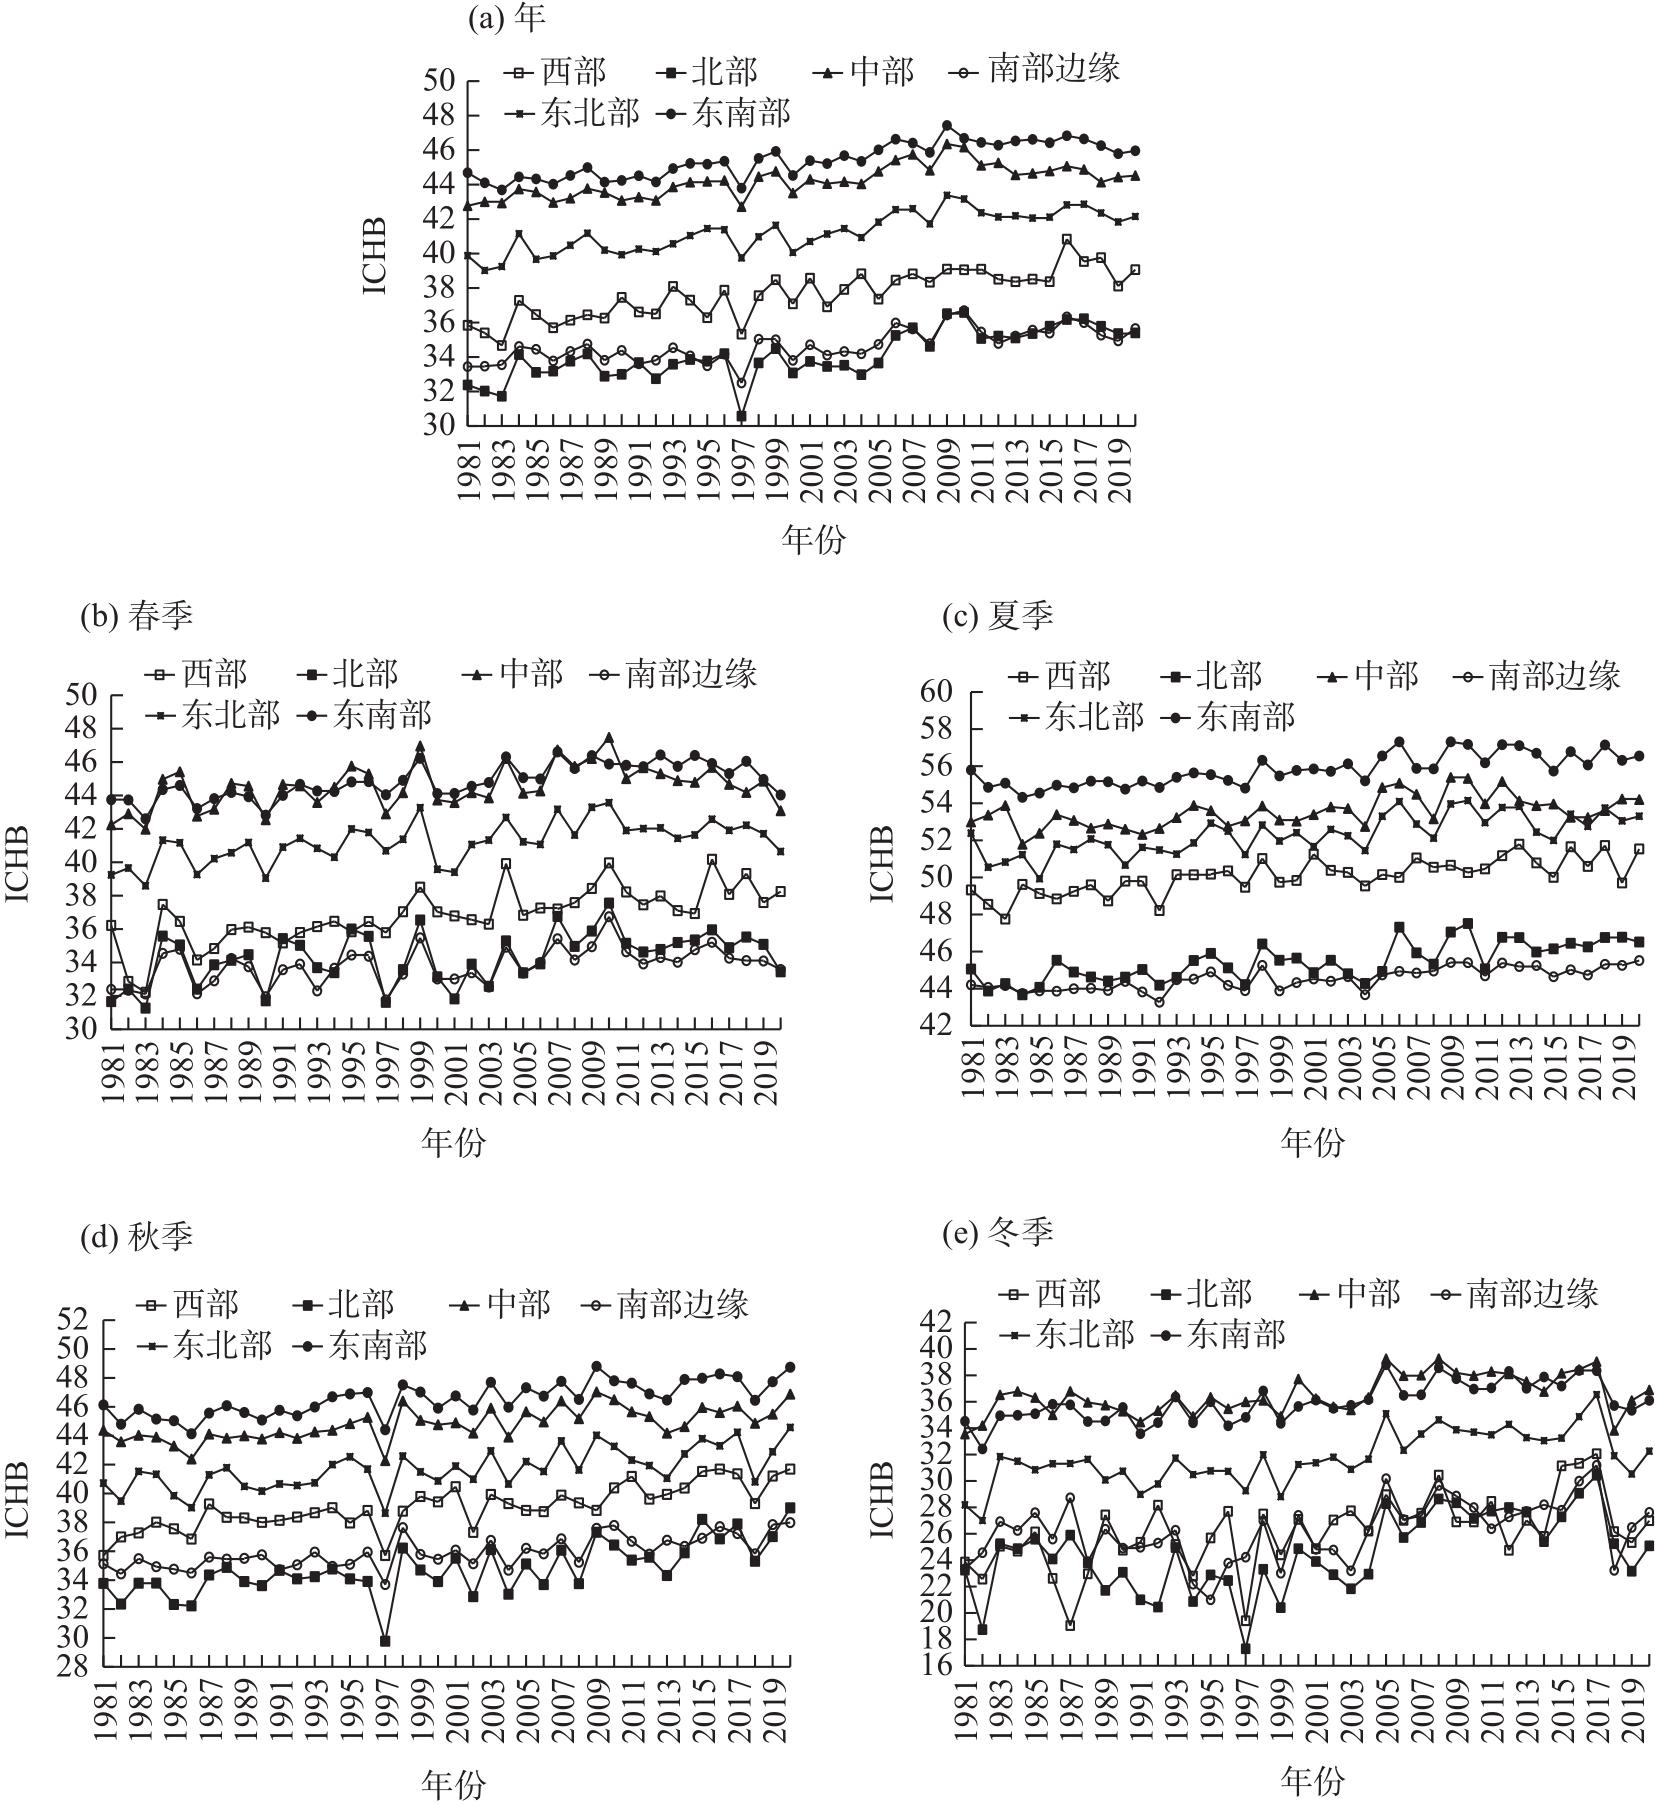
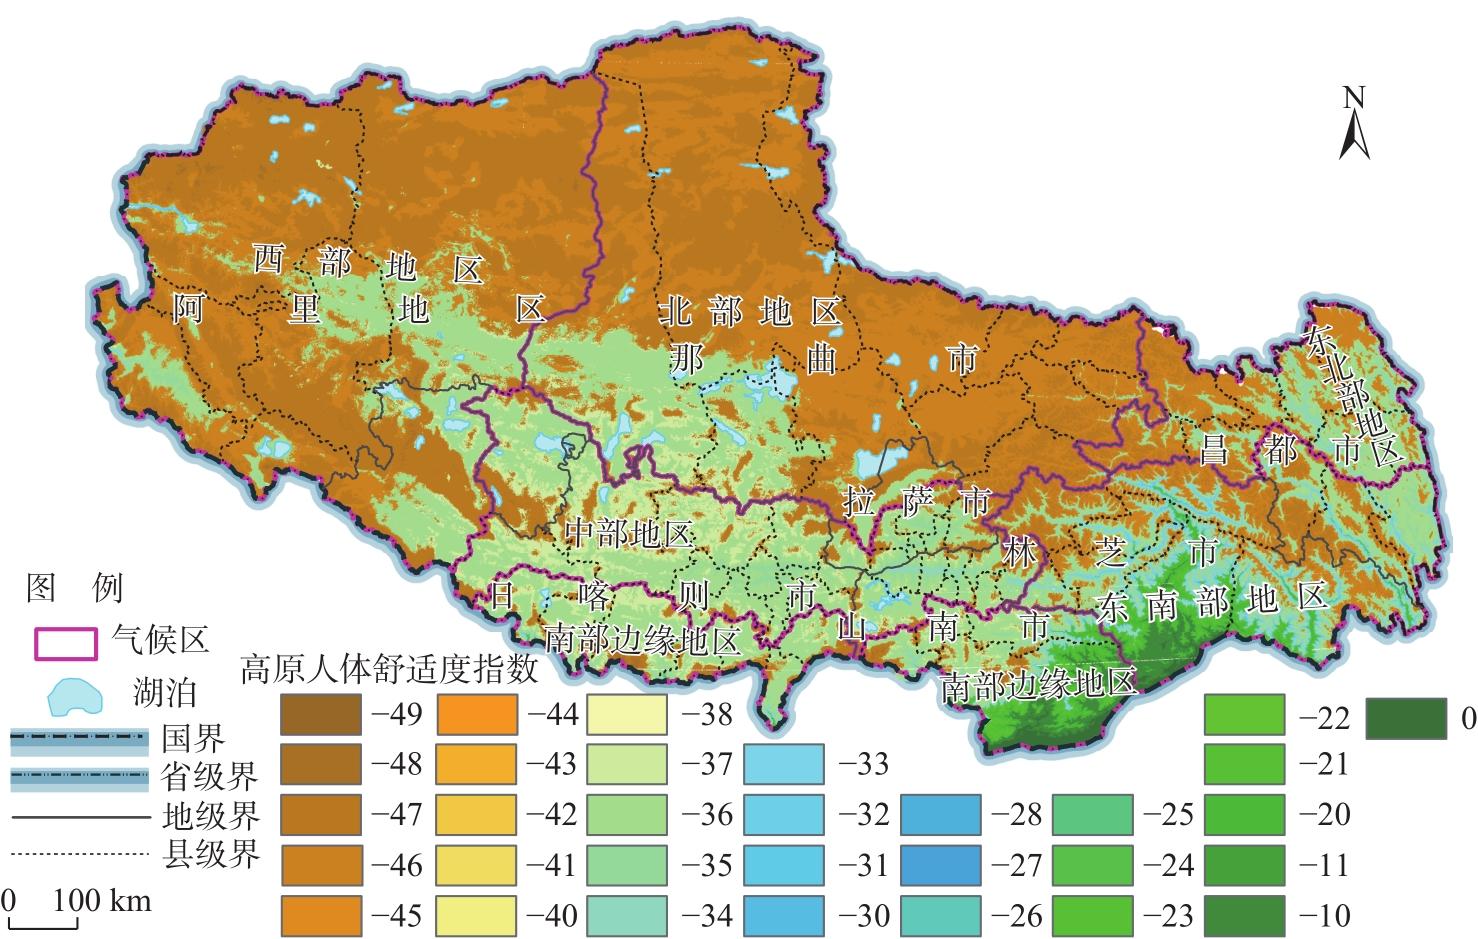
Based on daily meteorological data from 38 meteorological stations from 1981 to 2020 and climate data with a spatial resolution of 30 seconds (approximately 1 km2) from 1970 to 2000 in the Xizang Plateau, China, we analyzed the temporal and spatial variation characteristics of the comfort index of human body (ICHB) and comfort index of human body in plateau (PICHB). The results showed that: (1) Over the past 40 years, the ICHB in Xizang showed a noticeable upward trend. The overall increase rate of ICHB in the Xizang Plateau was 0.76·(10a)-1, with regional increase rates ranging from 0.57·(10a)-1 to 0.98·(10a)-1. (2) The annual and seasonal increase rates in ICHB followed the order, west>north>northeast>southeast>central and southern edge, and winter>autumn>spring>summer. (3) The PICHB indicated a cold and extremely uncomfortable environment, with severe plateau reactions mainly distributed in the mountains of the northern, western, and northeastern regions of the Xizang Plateau. Cold, uncomfortable, and severe plateau response areas were mainly distributed on the northern, central, and southern mountain edges. The cold, uncomfortable, and moderate plateau response areas were mainly distributed at lower altitudes on the northern, central, and southern margins. Cool, uncomfortable, and mild plateau response areas were mainly distributed southeast and east of the southern edge. Areas that were neither cold nor hot, felt comfortable, and had no plateau reactions were mainly distributed in southern Cona County and southern Medog County. In general, with the warming and humidifying climate trend in the Xizang Plateau, the ICHB significantly increased, and the PICHB shifted to a more comfortable state.
Jihong LI , Kanshe ZHOU , Dongdong ZHANG , Duoji PUBU , Weihua ZHANG , Jiqing SHI . Spatial and temporal variation characteristics of comfort index of human body in Xizang Plateau[J]. Arid Land Geography, 2024 , 47(6) : 980 -992 . DOI: 10.12118/j.issn.1000-6060.2023.224
表1 ICHB分级及人体反应特征Tab. 1 ICHB classification and human response characteristics |
| 等级 | ICHB | 级别 | 人体反应特征 |
|---|---|---|---|
| -5 | ICHB≤0 | 冷 | 极冷,极不舒适、极易冻伤 |
| -4 | 0<ICHB≤25 | 冷 | 寒冷,特不舒适,有冻伤危险 |
| -3 | 25<ICHB≤38 | 冷 | 冷,不舒适,注意防寒保暖 |
| -2 | 38<ICHB≤50 | 凉 | 凉,较不舒适,需注意保暖 |
| -1 | 50<ICHB≤55 | 凉 | 凉爽,较舒适 |
| 0 | 55<ICHB≤70 | 舒适 | 不冷不热,感觉很舒适 |
| 1 | 70<ICHB≤75 | 舒适 | 暖和,较舒适 |
| 2 | 75<ICHB≤80 | 热 | 热,较不舒适,需适当降温 |
| 3 | 80<ICHB≤85 | 热 | 炎热,不舒适,需注意防暑降温 |
| 4 | 85<ICHB≤90 | 酷热 | 酷热,特不舒适,易中暑,需注意防暑降温 |
| 5 | 90<ICHB | 酷热 | 极其酷热,极不舒适,极易中暑 |
注:ICHB为人体舒适度指数。下同。 |
表2 高原反应指数分级Tab. 2 Classification of high altitude reaction index in plateau |
| 高原反应 等级 | 高原反应指数(P) | 海拔/m | 反应 级别 | 反应等 级描述 | 人体反应及建议 |
|---|---|---|---|---|---|
| 0 | P≤0.20 | ≤2000 | 无反应 | 无反应 | 无高原反应 |
| 1 | 0.20<P≤0.27 | 2001~2700 | 轻度 | 轻微度 | 极少数人轻微高原反应 |
| 2 | 0.27<P≤0.30 | 2701~3000 | 轻度 | 中轻度 | 部分人有微弱高原反应、有危急性疾病的人勿入 |
| 3 | 0.30<P≤0.33 | 3001~3300 | 轻度 | 重轻度 | 多数人有轻度高原反应,个别人中度反应,有慢性病或身体特别虚弱的人勿入 |
| 4 | 0.33<P≤0.36 | 3301~3600 | 中度 | 轻中度 | 大部分人有轻中度持续性高原反应,部分人中度反应,身体虚弱的人勿入 |
| 5 | 0.36<P≤0.40 | 3601~4000 | 中度 | 中中度 | 绝大部分人有中度以上高原反应,身体较差的人慎入 |
| 6 | 0.40<P≤0.50 | 4001~5000 | 中度 | 重中度 | 都有中度以上高原反应,身体一般的人慎入 |
| 7 | 0.50<P≤0.60 | 5001~6000 | 重度 | 轻重度 | 重度高原反应,绝大部分人不适应,谨慎冒险 |
| 8 | 0.60<P≤0.70 | 6001~7000 | 重度 | 中重度 | 生命禁区,行动和用脑困难,禁止冒险 |
| 9 | P>0.70 | >7000 | 重度 | 极重度 | 身体不能正常代谢,为高山死亡带,只允许专业登山运动员进入 |
表3 高原人体舒适度指数(PICHB)分级Tab. 3 Classification of comfort index of human body in plateau (PICHB) |
| ICHB | 等级 | 等级(海拔/m) | |||||||||
|---|---|---|---|---|---|---|---|---|---|---|---|
| 0(≤2000) | 1(2001~ 2700) | 2(2701~ 3000) | 3(3001~ 3300) | 4(3301~ 3600) | 5(3601~ 4000) | 6(4001~ 5000) | 7(5001~ 6000) | 8(6001~ 7000) | 9(>7000) | ||
| ICHB<0 | -5 | -50 | -51 | -52 | -53 | -54 | -55 | -56 | -57 | -58 | -59 |
| 0<ICHB≤25 | -4 | -40 | -41 | -42 | -43 | -44 | -45 | -46 | -47 | -48 | -49 |
| 25<ICHB≤38 | -3 | -30 | -31 | -32 | -33 | -34 | -35 | -36 | -37 | -38 | -39 |
| 38<ICHB≤50 | -2 | -20 | -21 | -22 | -23 | -24 | -25 | -26 | -27 | -28 | -29 |
| 50<ICHB≤55 | -1 | -10 | -11 | -12 | -13 | -14 | -15 | -16 | -17 | -18 | -19 |
| 55<ICHB≤70 | 0 | 00 | 01 | 02 | 03 | 04 | 05 | 06 | 07 | 08 | 09 |
| 70<ICHB≤75 | 1 | 10 | 11 | 12 | 13 | 14 | 15 | 16 | 17 | 18 | 19 |
| 75<ICHB≤80 | 2 | 20 | 21 | 22 | 23 | 24 | 25 | 26 | 27 | 28 | 29 |
| 80<ICHB≤85 | 3 | 30 | 31 | 32 | 33 | 34 | 35 | 36 | 37 | 38 | 39 |
| 85<ICHB≤90 | 4 | 40 | 41 | 42 | 43 | 44 | 45 | 46 | 47 | 48 | 49 |
| 90<ICHB | 5 | 50 | 51 | 52 | 53 | 54 | 55 | 56 | 57 | 58 | 59 |
表4 1981—2020年平均气候态下日ICHB的等级天数及占比Tab. 4 Graded days and annual percentage of daily ICHB under average climatic conditions from 1981 to 2020 |
| 区域 | 天数及 占比 | 舒适度等级 | ||||||
|---|---|---|---|---|---|---|---|---|
| -5(极冷极不舒适) | -4(寒冷特不舒适) | -3(冷不舒适) | -2(凉较不舒适) | -1(凉爽较舒适) | 0(舒适) | 1(暖和较舒适) | ||
| 西藏 高原 | 天数/d | 0 | 29 | 133 | 139 | 49 | 15 | 0 |
| 占比/% | 0 | 7.9 | 36.3 | 38.2 | 13.4 | 4.2 | 0 | |
| 西部 | 天数/d | 0 | 48 | 147 | 120 | 50 | 0 | 0 |
| 占比/% | 0 | 13.2 | 40.2 | 32.9 | 13.0 | 0 | 0 | |
| 北部 | 天数/d | 0 | 71 | 155 | 139 | 0 | 0 | 0 |
| 占比/% | 0 | 19.5 | 42.4 | 38.1 | 0 | 0 | 0 | |
| 中部 | 天数/d | 0 | 0 | 92 | 161 | 112 | 0 | 0 |
| 占比/% | 0 | 0 | 25.2 | 44.1 | 30.7 | 0 | 0 | |
| 南部 边缘 | 天数/d | 0 | 54 | 169 | 142 | 0 | 0 | 0 |
| 占比/% | 0 | 14.8 | 46.3 | 38.9 | 0 | 0 | 0 | |
| 东北部 | 天数/d | 0 | 0 | 158 | 125 | 82 | 0 | 0 |
| 占比/% | 0 | 0 | 43.3 | 34.2 | 22.5 | 0 | 0 | |
| 东南部 | 天数/d | 0 | 0 | 74 | 149 | 50 | 92 | 0 |
| 占比/% | 0 | 0 | 20.3 | 40.8 | 13.7 | 25.2 | 0 | |
表5 1981—2020年西藏高原各气候区ICHB及其变化倾向率Tab. 5 ICHB and its change tendency rate in different regions of the Xizang Plteau form 1981 to 2020 |
| 时段 | 指数变化 | 西藏高原 | 西部 | 北部 | 中部 | 南部边缘 | 东北部 | 东南部 |
|---|---|---|---|---|---|---|---|---|
| 年 | ICHB | 39.6 | 37.7 | 34.1 | 44.2 | 34.7 | 41.3 | 45.4 |
| 倾向率/(10a)-1 | 0.76* | 0.98* | 0.91* | 0.57* | 0.57* | 0.80* | 0.72* | |
| 春季 | ICHB | 39.3 | 36.9 | 34.3 | 44.5 | 33.8 | 41.2 | 44.8 |
| 倾向率/(10a)-1 | 0.59* | 1.05* | 0.58* | 0.47* | 0.45* | 0.62* | 0.64* | |
| 夏季 | ICHB | 50.3 | 50.1 | 45.5 | 53.6 | 44.5 | 52.3 | 55.8 |
| 倾向率/(10a)-1 | 0.53* | 0.60* | 0.65* | 0.42* | 0.38* | 0.65* | 0.56* | |
| 秋季 | ICHB | 40.5 | 39.0 | 34.8 | 44.8 | 35.9 | 41.7 | 46.6 |
| 倾向率/(10a)-1 | 0.79* | 1.04* | 1.04* | 0.64* | 0.65* | 0.79* | 0.77* | |
| 冬季 | ICHB | 30.2 | 26.1 | 24.5 | 36.5 | 26.2 | 31.8 | 36.0 |
| 倾向率/(10a)-1 | 1.03* | 1.35* | 1.36* | 0.70* | 0.84* | 1.13* | 0.87* |
注:n=40,*表示达到0.001著性水平。 |
表6 高原反应各等级国土面积及占国土面积比例Tab. 6 Land area of high altitude reaction index in each level and its proportion in land area in Xizang Plateau |
| 气候区 | 面积及占比 | 等级 | |||||||||
|---|---|---|---|---|---|---|---|---|---|---|---|
| 0 | 1 | 2 | 3 | 4 | 5 | 6 | 7 | 8 | 9 | ||
| 西藏高原 | 面积/103 km2 | 33.43 | 14.55 | 7.60 | 9.69 | 14.31 | 38.01 | 628.81 | 476.01 | 5.95 | 0.02 |
| 占比/% | 2.72 | 1.18 | 0.62 | 0.79 | 1.17 | 3.09 | 51.19 | 38.75 | 0.48 | 0.01 | |
| 西部 | 面积/103 km2 | 0.00 | 0.00 | 0.00 | 0.08 | 0.22 | 1.39 | 170.41 | 194.69 | 3.95 | 0.00 |
| 占比/% | 0.00 | 0.00 | 0.00 | 0.02 | 0.06 | 0.37 | 45.98 | 52.51 | 1.06 | 0.00 | |
| 北部 | 面积/103 km2 | 0.00 | 0.00 | 0.00 | 0.02 | 0.05 | 0.45 | 220.74 | 154.47 | 0.44 | 0.00 |
| 占比/% | 0.00 | 0.00 | 0.00 | 0.01 | 0.01 | 0.12 | 58.68 | 41.06 | 0.12 | 0.00 | |
| 中部 | 面积/103 km2 | 0.00 | 0.00 | 0.00 | 0.07 | 1.01 | 7.22 | 73.21 | 70.73 | 0.56 | 0.00 |
| 占比/% | 0.00 | 0.00 | 0.00 | 0.05 | 0.66 | 4.73 | 47.91 | 46.28 | 0.37 | 0.00 | |
| 南部边缘 | 面积/103 km2 | 17.44 | 5.40 | 1.68 | 1.62 | 1.77 | 3.62 | 43.25 | 27.80 | 0.84 | 0.01 |
| 占比/% | 16.74 | 5.18 | 1.61 | 1.56 | 1.70 | 3.47 | 41.57 | 26.68 | 1.48 | 0.01 | |
| 东北部 | 面积/103 km2 | 0.00 | 0.00 | 0.08 | 0.63 | 2.02 | 8.23 | 54.34 | 8.85 | 0.03 | 0.00 |
| 占比/% | 0.00 | 0.00 | 0.12 | 0.85 | 2.72 | 11.10 | 73.25 | 11.92 | 0.04 | 0.00 | |
| 东南部 | 面积/103 km2 | 16.01 | 9.14 | 5.84 | 7.27 | 9.24 | 17.11 | 66.85 | 19.47 | 0.13 | 0.00 |
| 占比/% | 10.59 | 6.05 | 3.85 | 4.82 | 6.12 | 11.32 | 44.26 | 12.90 | 0.09 | 0.00 | |
表7 1970—2000年西藏PICHB不同等级国土面积及占比Tab. 7 Land area of PICHB in each level and its proportion in land area in Xizang form 1970 to 2000 |
| PICHB | -40 | -41 | -42 | -43 | -44 | -45 | -46 | -47 | -48 | -49 |
|---|---|---|---|---|---|---|---|---|---|---|
| 面积/103 km2 | 0.002 | 0.005 | 0.001 | 0.001 | 0.050 | 1.185 | 342.369 | 397.706 | 6.637 | 0.059 |
| 占比/% | 0.000 | 0.000 | 0.000 | 0.000 | 0.004 | 0.096 | 27.871 | 32.376 | 0.540 | 0.005 |
| PICHB | -30 | -31 | -32 | -33 | -34 | -35 | -36 | -37 | -38 | -39 |
| 面积/103 km2 | 0.034 | 2.182 | 5.039 | 8.942 | 14.210 | 36.717 | 283.729 | 79.516 | 0.013 | 0.000 |
| 占比/% | 0.003 | 0.178 | 0.410 | 0.728 | 1.157 | 2.989 | 23.098 | 6.474 | 0.001 | 0.000 |
| PICHB | -20 | -21 | -22 | -23 | -24 | -25 | -26 | -27 | -28 | -29 |
| 面积/103 km2 | 14.797 | 12.395 | 2.622 | 0.845 | 0.185 | 0.096 | 0.014 | 0.002 | 0.001 | 0.000 |
| 占比/% | 1.205 | 1.009 | 0.213 | 0.069 | 0.015 | 0.008 | 0.001 | 0.000 | 0.000 | 0.000 |
| PICHB | -10 | -11 | -12 | -13 | -14 | -15 | -16 | -17 | -18 | -19 |
| 面积/103 km2 | 13.132 | 0.005 | 0.000 | 0.000 | 0.000 | 0.000 | 0.000 | 0.000 | 0.000 | 0.000 |
| 占比/% | 1.069 | 0.000 | 0.000 | 0.000 | 0.000 | 0.000 | 0.000 | 0.000 | 0.000 | 0.000 |
| PICHB | 0 | 1 | 2 | 3 | 4 | 5 | 6 | 7 | 8 | 9 |
| 面积/103 km2 | 5.889 | 0.000 | 0.000 | 0.000 | 0.000 | 0.000 | 0.000 | 0.000 | 0.000 | 0.000 |
| 占比/% | 0.479 | 0.000 | 0.000 | 0.000 | 0.000 | 0.000 | 0.000 | 0.000 | 0.000 | 0.000 |
注:PICHB为高原人体舒适度指数。下同。 |
| [1] |
马丽君, 孙根年, 李馥丽, 等. 陕西省旅游气候舒适度评价[J]. 资源科学, 2007, 29(6): 40-44.
[
|
| [2] |
曹伟宏, 王淑新. 京津冀地区城市人居环境气候舒适性评价[J]. 冰川冻土, 2017, 39(2): 435-442.
[
|
| [3] |
胡毅, 李萍, 杨建功, 等. 应用气象学[M]. 北京: 气象出版社, 2005: 193-198.
[
|
| [4] |
|
| [5] |
刘梅, 于波, 姚克敏. 人体舒适度研究现状及其开发应用前景[J]. 气象科技, 2002, 30(1): 11-14, 18.
[
|
| [6] |
|
| [7] |
|
| [8] |
|
| [9] |
|
| [10] |
|
| [11] |
|
| [12] |
|
| [13] |
陆鼎煌, 崔森, 李重合. 北京城市绿化夏季小气候条件对人体的适宜度[C]// 林业气象论文集. 北京: 气象出版社, 1984: 144-152.
[
|
| [14] |
冯定原, 邱新法. 我国各地四季感热温度的计算和分析[J]. 南京气象学院学报, 1990, 13(1): 71-80.
[
|
| [15] |
吕伟林. 体感温度及其计算方法[J]. 北京气象, 1998(1): 23-25.
[
|
| [16] |
王远飞, 沈愈. 上海市夏季温湿效应与人体舒适度[J]. 华东师范大学学报(自然科学版), 1998(3): 60-66.
[
|
| [17] |
高超, 申双和, 蒋烨林, 等. 影响杭州人体舒适度的城市因素分析[J]. 气象, 2019, 45(6): 854-861.
[
|
| [18] |
曹云, 孙应龙, 吴门新. 近50年京津冀气候舒适度的区域时空特征分析[J]. 生态学报, 2019, 39(20): 7567-7582.
[
|
| [19] |
谭凯炎, 闵庆文, 王培娟. 一种基于中国气候特征和人体舒适感受的气候舒适指数模型[J]. 气象, 2022, 48(7): 913-924.
[
|
| [20] |
吴兑. 多种人体舒适度预报公式讨论[J]. 气象科技, 2003, 31(6): 370-372.
[
|
| [21] |
李环姣. 陕西省旅游气候舒适度研究[D]. 西安: 陕西师范大学, 2008.
[
|
| [22] |
于庚康, 徐敏, 于堃, 等. 近30年江苏人体舒适度指数变化特征分析[J]. 气象, 2011, 37(9): 1145-1150.
[
|
| [23] |
张狄, 史岚, 缪启龙, 等. 基于GIS的江苏省旅游舒适度精细化估算与评价[J]. 江苏师范大学学报(自然科学版), 2012, 30(3): 62-67.
[
|
| [24] |
金琪, 孟英杰. 1960—2016年武汉城市圈人体舒适度变化特征[J]. 气象与环境学报, 2017, 33(6): 82-88.
[
|
| [25] |
杜正静, 潘进军, 赵卫华, 等. 中国旅游气候适宜性评价研究[J]. 气象与环境科学, 2018, 41(4): 17-26.
[
|
| [26] |
普布次仁, 卓嘎, 拉巴次仁, 等. 西藏地区人体舒适度指数的变化特征[J]. 高原山地气象研究, 2012, 32(4): 80-85.
[
|
| [27] |
石磊, 黄晓清, 尼玛吉, 等. 西藏自治区旅游气候适应性分析[J]. 冰川冻土, 2015, 37(5): 1412-1419.
[
|
| [28] |
郭广, 张静, 马守存, 等. 1961—2010年青海省人体舒适度指数时空分布特征[J]. 冰川冻土, 2015, 37(3): 845-854.
[
|
| [29] |
宁文博, 李春艳, 刘赛, 等. 西藏气候舒适度时空分布特征及主要旅游城市避暑资源分析[J]. 沙漠与绿洲气象, 2022, 16(1): 116-123.
[
|
| [30] |
杜军. 西藏高原近40年的气温变化[J]. 地理学报, 2001, 56(6): 682-690.
[
|
| [31] |
杜军, 马玉才. 西藏高原降水变化趋势的气候分析[J]. 地理学报, 2004, 59(3): 375-382.
[
|
| [32] |
秦大河,
[
|
| [33] |
西藏自治区土地管理局. 西藏自治区土地利用[M]. 北京: 科学出版社, 1992.
[Bureau of Land Administration of Tibet Autonomous Region. Land use of Tibet Autonomous Region[M]. Beijing: Science Press, 1992.]
|
| [34] |
张新时. 西藏高原植被的高原地带性[J]. 植物学报, 1978, 20(2): 140-149.
[
|
| [35] |
高由禧, 蒋世逵, 张谊光. 西藏气候[M]. 北京: 科学出版社, 1984.
[
|
| [36] |
宋善允, 王鹏祥, 杜军. 西藏气候[M]. 北京: 气象出版社, 2013.
[
|
| [37] |
林志强, 路红亚, 宁斌. 气候变暖背景下西藏地区工程施工气象条件分析[J]. 气象科技, 2015, 43(5): 978-985.
[
|
| [38] |
雷桂莲, 喻迎春. 南昌市人体舒适度指数预报[J]. 江西气象科技, 1999(3): 40-41.
[
|
| [39] |
吴兑, 邓雪娇. 环境气象学与特种气象预报[J]. 广东气象, 2000, 26(8): 2-3.
[
|
| [40] |
胡琳, 胡淑兰, 苏静, 等. 陕西省人体舒适度变化及其对气象因子的响应[J]. 干旱区研究, 2019, 36(6): 1450-1456.
[
|
/
| 〈 |
|
〉 |