
Identification of the key areas of ecological restoration based on the ecological network: A case study of Yan’an City
Received date: 2023-05-27
Revised date: 2023-08-10
Online published: 2026-03-11
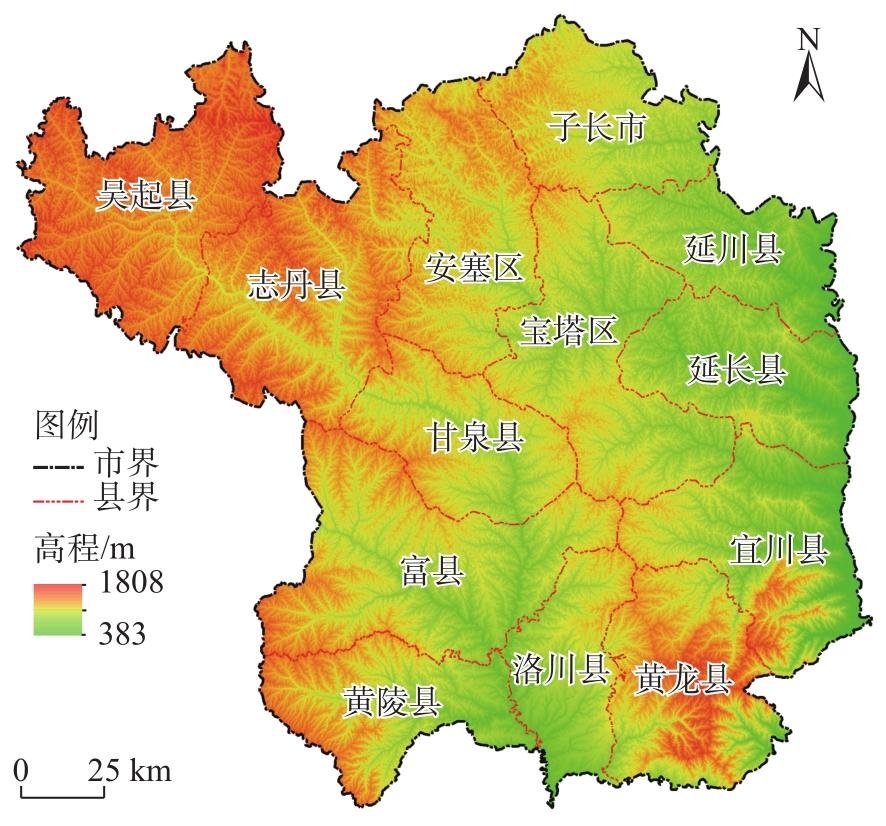
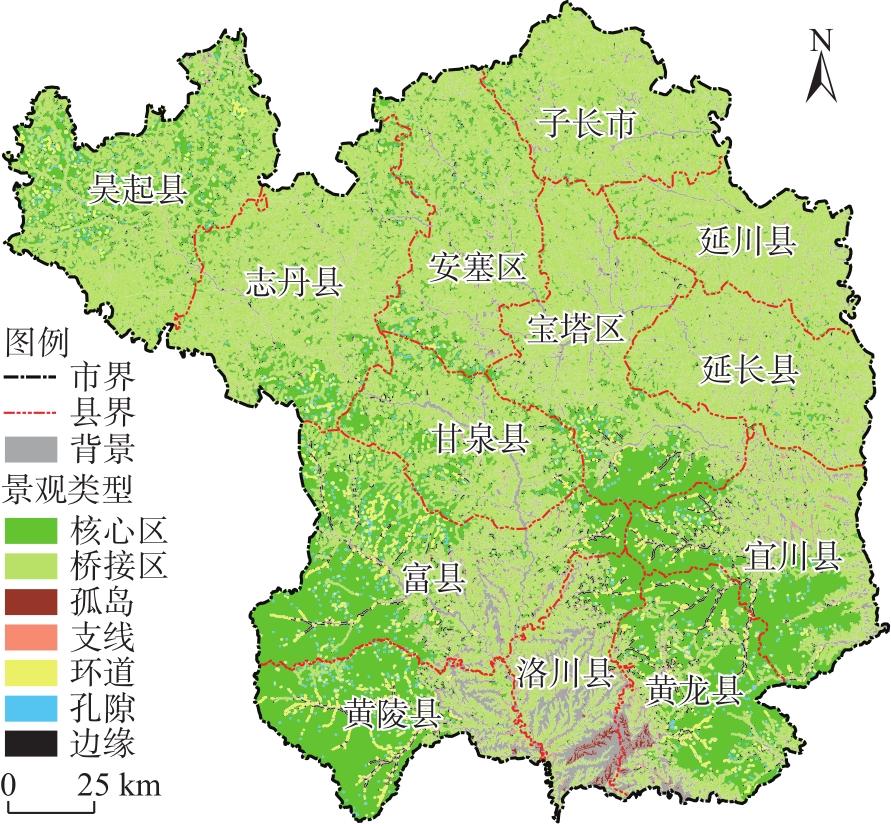
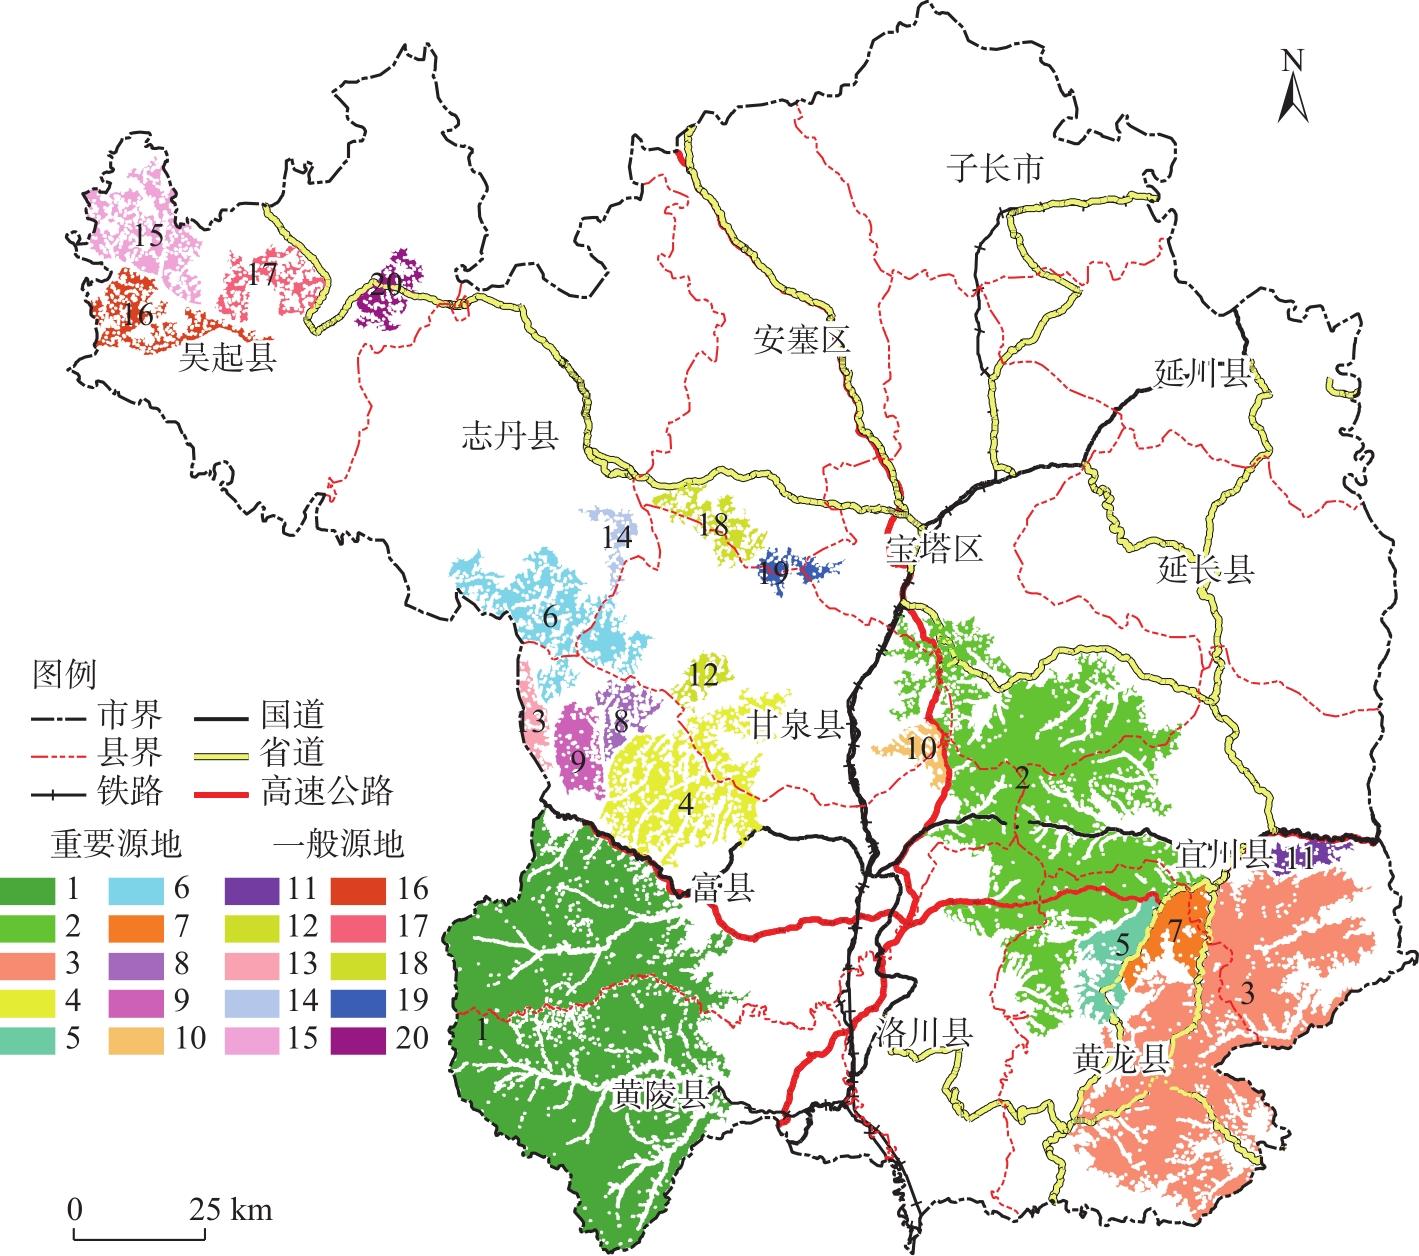
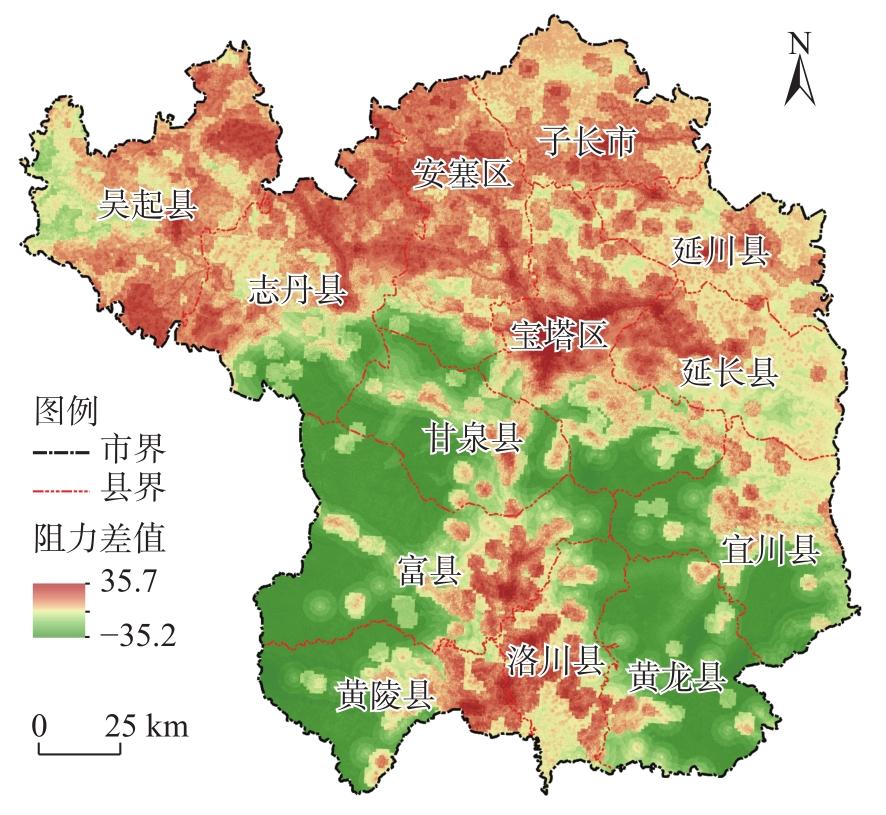
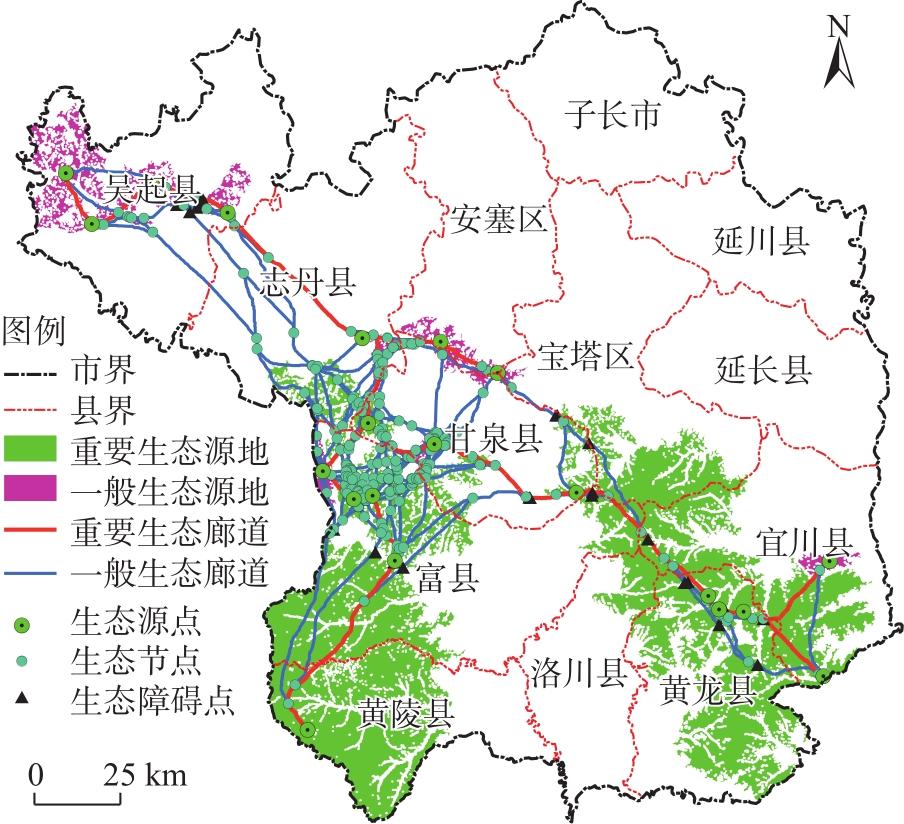
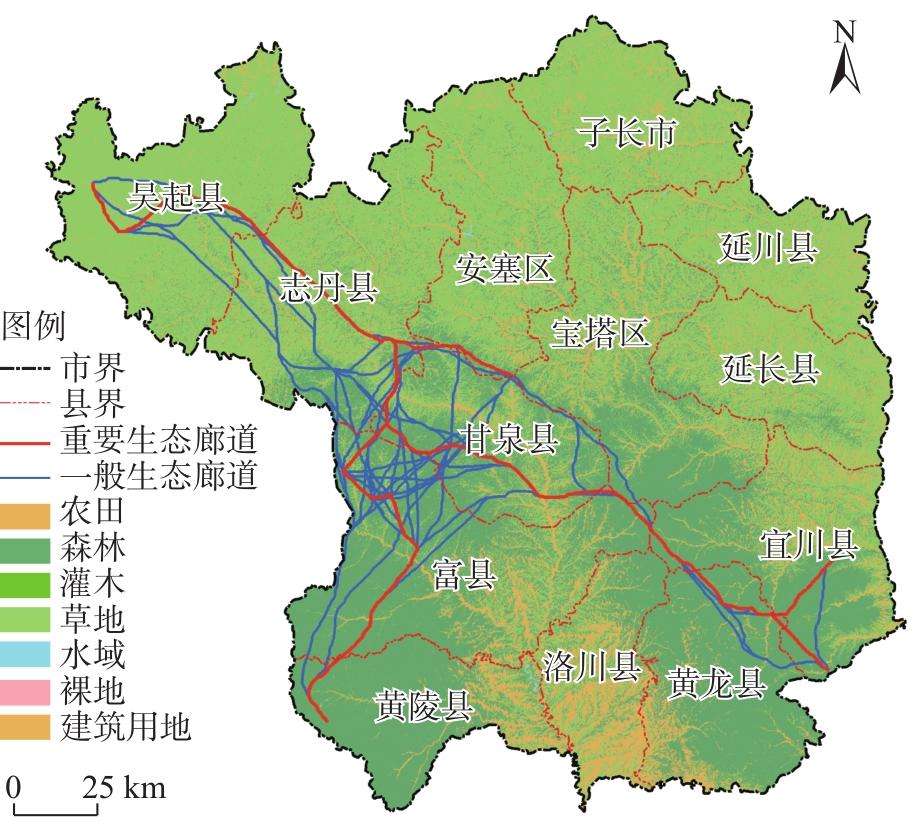
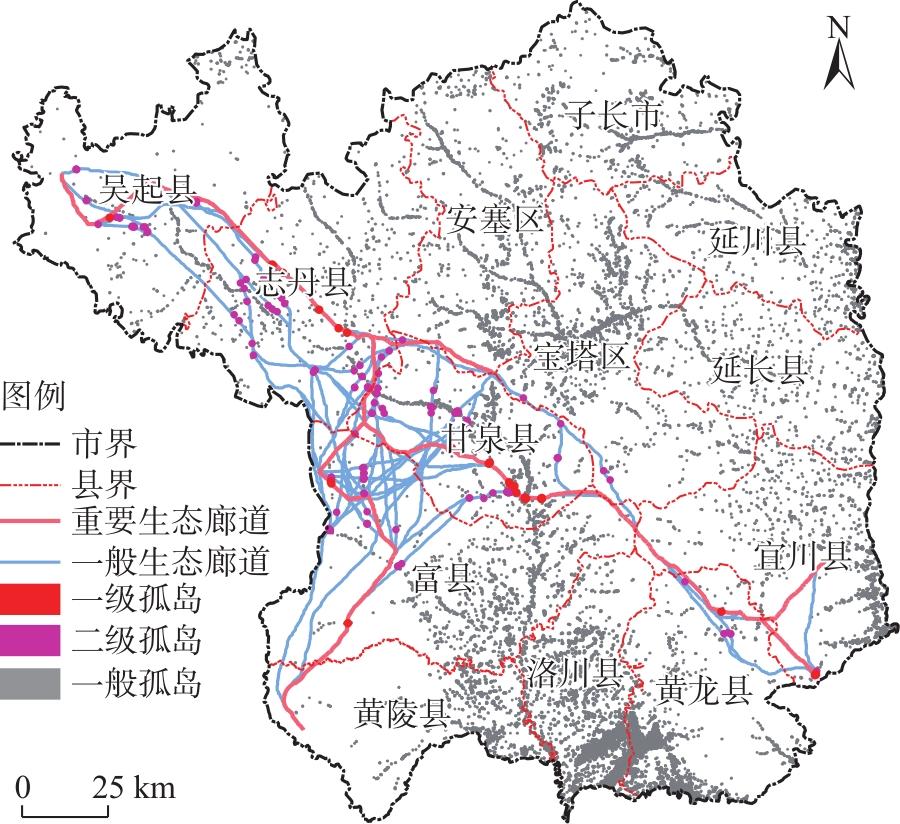
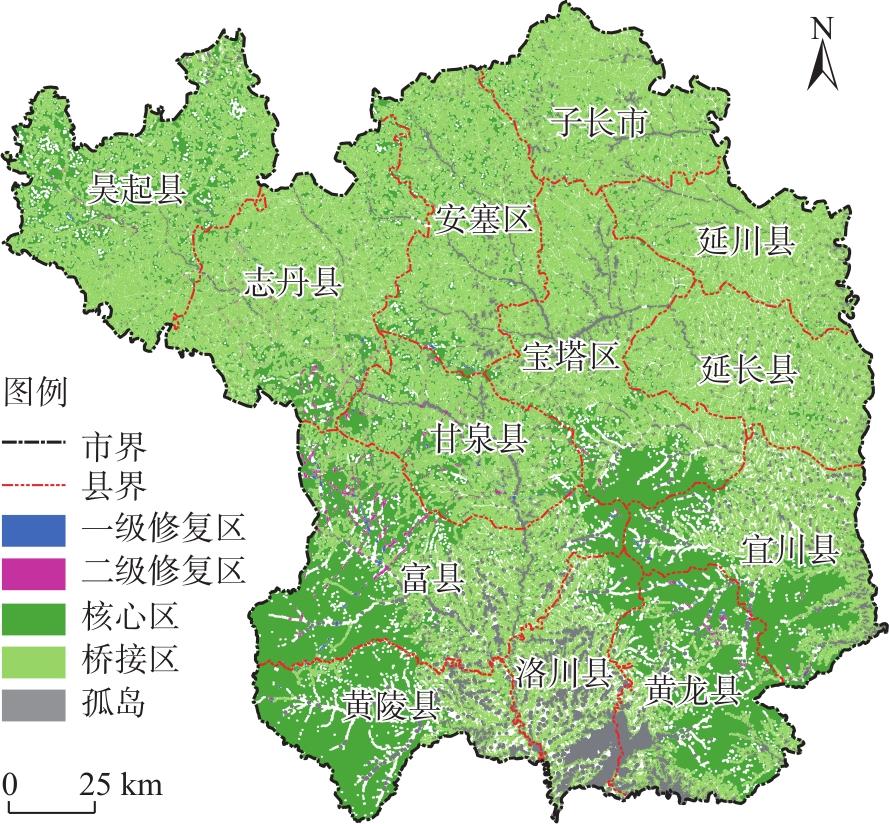
Delimiting key areas of ecological restoration is the prerequisite and foundation for implementing differentiated ecological restoration strategies. Taking Yan’an City, Shaanxi Province, China as an example, this paper employs morphological spatial pattern analysis to construct landscape patterns and integrate the probability of connectivity index to identify ecological sources. In addition, it utilizes the minimum cumulative resistance model based on impact factors like land use and normalized difference vegetation index to calculate the minimum cumulative resistance difference, extract ecological corridors, construct an ecological network, divide corridor levels by cost connectivity, and analyze network structure characteristics using graph theory. Finally, ecological corridors and landscape patterns are superimposed to identify the critical areas for ecological restoration in Yan’an City. The results show that: (1) Yan’an City has an extensive coverage of forest and grassland, although with scattered overall coverage and poor landscape connectivity. (2) Ecological sources in Yan’an City are mainly distributed in the southwest and southeast, while the northeast has poor habitat quality and is unsuitable for species habitat. (3) Ecological corridors mainly comprised forest landscapes, including 10% of the crucial corridors, with extremely uneven spatial distribution of the ecological networks. (4) Ecological networks’ closure, complexity, and connectivity are low, and the network stability is poor. (5) Islets in Yan’an City are mainly distributed in Luochuan County, with key areas of ecological restoration mainly concentrated in Fu County and Huanglong County, including 21.93% of the Level 1 restoration areas. These results can provide a reference and basis for identifying the critical areas of ecological restoration and constructing ecological networks in Yan’an City.
Zhongyang XU , Cheng WANG , Tong GU , Shiyu WANG , Chenyang PEI , Qingfeng ZHANG . Identification of the key areas of ecological restoration based on the ecological network: A case study of Yan’an City[J]. Arid Land Geography, 2024 , 47(6) : 1073 -1083 . DOI: 10.12118/j.issn.1000-6060.2023.242
表1 MSPA景观类型及其生态学含义Tab. 1 Ecological meaning of landscape types based on MSPA |
| 景观类型 | 生态学含义 |
|---|---|
| 核心区 | 前景像元中较大的生境斑块,可作为生态网络中“源地” |
| 孤岛 | 彼此不相连的孤立、破碎的小斑块,斑块内外连通作用极弱 |
| 孔隙 | 核心区与内部非潜在源地之间的过渡区域,即核心区内边界 |
| 边缘 | 核心区与外部非潜在源地之间的过渡区域,即核心区外边界 |
| 环道 | 核心区内部物质交换、能量转化和信息传递的通道,具有廊道的特征 |
| 桥接 | 核心区之间物质交换、能量转化和信息传递的通道,具有廊道的特征 |
| 支线 | 只有一端与环道、孔隙、边缘区或桥接区相连的区域 |
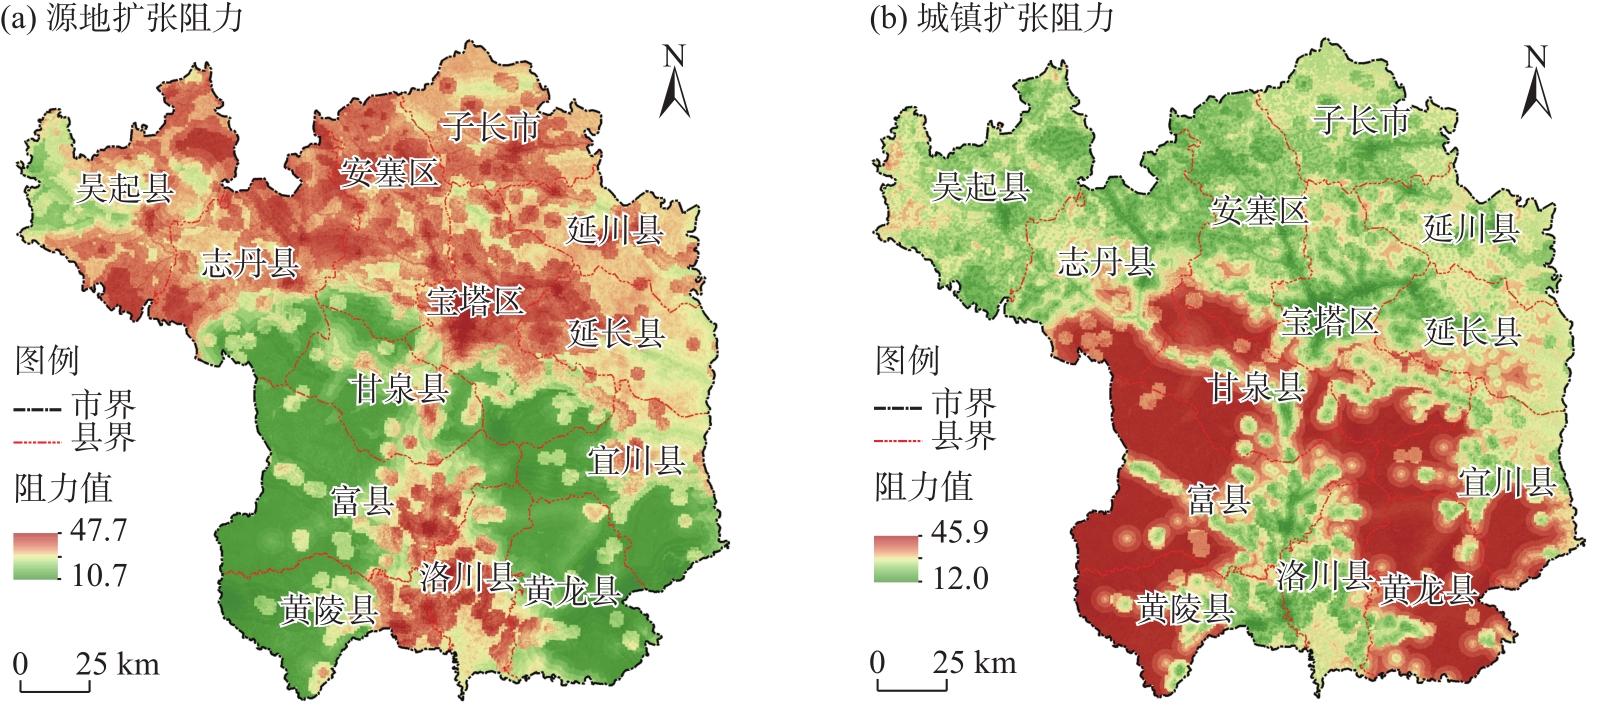
表2 生态源地(左)和城镇(右)扩张阻力因子系数及权重设定Tab. 2 Resistance coefficient and weight setting of ecological source (left) and cities and towns (right) expansion |
| 阻力因子 | 分级指标 | 阻力值 | 权重 | 阻力因子 | 分级指标 | 阻力值 | 权重 |
|---|---|---|---|---|---|---|---|
| 土地利用类型 | 水体、草地 | 10 | 0.38 | 土地利用类型 | 水体、草地 | 50 | 0.33 |
| 森林、灌木 | 20 | 森林、灌木 | 40 | ||||
| 农田 | 30 | 农田 | 30 | ||||
| 裸地 | 40 | 裸地 | 20 | ||||
| 不透水面 | 50 | 不透水面 | 10 | ||||
| 距源地距离/km | <1 | 10 | 0.22 | 距建筑用地距离/km | <0.5 | 10 | 0.25 |
| 1~3 | 20 | 0.5~1.5 | 20 | ||||
| 3~5 | 30 | 1.5~3 | 30 | ||||
| 5~8 | 40 | 3~5 | 40 | ||||
| >8 | 50 | >5 | 50 | ||||
| NDVI | 0.04~0.17 | 50 | 0.13 | 距源地距离/km | <1 | 50 | 0.19 |
| 0.17~0.29 | 40 | 1~3 | 40 | ||||
| 0.29~0.42 | 30 | 3~5 | 30 | ||||
| 0.42~0.55 | 20 | 5~8 | 20 | ||||
| 0.55~0.68 | 10 | >8 | 10 | ||||
| 距主要河流距离/km | <1 | 10 | 0.10 | 坡度/(°) | <13.3 | 10 | 0.10 |
| 1~3 | 20 | 13.3~26.6 | 20 | ||||
| 3~5 | 30 | 26.6~40.0 | 30 | ||||
| 5~8 | 40 | 40.0~53.3 | 40 | ||||
| >8 | 50 | 53.3~66.6 | 50 | ||||
| 距建筑用地距离/km | <0.5 | 50 | 0.07 | NDVI | 0.04~0.17 | 10 | 0.06 |
| 0.5~1.5 | 40 | 0.17~0.29 | 20 | ||||
| 1.5~3 | 30 | 0.29~0.42 | 30 | ||||
| 3~5 | 20 | 0.42~0.55 | 40 | ||||
| >5 | 10 | 0.55~0.68 | 50 | ||||
| 距主要道路距离/km | <1 | 50 | 0.05 | 距主要道路距离/km | <1 | 10 | 0.04 |
| 1~2 | 40 | 1~2 | 20 | ||||
| 2~4 | 30 | 2~4 | 30 | ||||
| 4~7 | 20 | 4~7 | 40 | ||||
| >7 | 10 | >7 | 50 | ||||
| DEM/km | 0.38~0.67 | 10 | 0.03 | 距主要河流距离/km | <1 | 50 | 0.03 |
| 0.67~0.95 | 20 | 1~3 | 40 | ||||
| 0.95~1.24 | 30 | 3~5 | 30 | ||||
| 1.24~1.52 | 40 | 5~8 | 20 | ||||
| 1.52~1.81 | 50 | >8 | 10 | ||||
| 坡度/(°) | <13.3 | 10 | 0.02 | DEM/km | 0.38~0.67 | 10 | 0.01 |
| 13.3~26.6 | 20 | 0.67~0.95 | 20 | ||||
| 26.6~40.0 | 30 | 0.95~1.24 | 30 | ||||
| 40.0~53.3 | 40 | 1.24~1.52 | 40 | ||||
| 53.3~66.6 | 50 | 1.52~1.81 | 50 |
注:NDVI为归一化植被指数;DEM为数字高程模型。 |
表3 基于MSPA的各景观类型面积Tab. 3 Area of each landscape type based on MSPA |
| 景观类型 | 面积/km2 | 占前景比例/% | 占总体比例/% |
|---|---|---|---|
| 桥接区 | 20859.85 | 63.73 | 56.31 |
| 核心区 | 9485.37 | 28.98 | 25.61 |
| 环道 | 914.38 | 2.79 | 2.47 |
| 边缘 | 761.27 | 2.33 | 2.06 |
| 孔隙 | 351.24 | 1.07 | 0.95 |
| 支线 | 225.67 | 0.69 | 0.61 |
| 孤岛 | 134.37 | 0.41 | 0.36 |
| 总计 | 32732.18 | 100.00 | 88.37 |
表4 生态源地重要性排序Tab. 4 Importance ranking of ecological sources |
| 斑块编号 | dPC | 面积/km2 | 占核心区比例/% |
|---|---|---|---|
| 1 | 42.43 | 2264.83 | 23.89 |
| 2 | 38.71 | 1604.91 | 16.92 |
| 3 | 33.82 | 1352.44 | 14.29 |
| 4 | 16.38 | 379.91 | 4.01 |
| 5 | 7.12 | 121.86 | 1.28 |
| 6 | 5.47 | 271.07 | 2.86 |
| 7 | 3.81 | 124.98 | 1.32 |
| 8 | 2.73 | 47.20 | 0.50 |
| 9 | 2.14 | 99.01 | 1.04 |
| 10 | 1.61 | 51.50 | 0.54 |
| 11 | 1.55 | 51.50 | 0.54 |
| 12 | 0.95 | 41.30 | 0.44 |
| 13 | 0.81 | 47.41 | 0.50 |
| 14 | 0.55 | 39.04 | 0.41 |
| 15 | 0.39 | 165.19 | 1.74 |
| 16 | 0.37 | 106.35 | 1.12 |
| 17 | 0.19 | 79.59 | 0.84 |
| 18 | 0.07 | 80.44 | 0.85 |
| 19 | 0.04 | 44.57 | 0.47 |
| 20 | 0.02 | 56.75 | 0.60 |
注:dPC为某斑块对区域景观连通性的贡献水平,值越大,斑块对整体景观连通性贡献越大。 |
| [1] |
王杰云, 罗志军, 齐松. 城镇空间扩张与景观生态风险的耦合关联——以江西省袁州区为例[J]. 水土保持研究, 2021, 28(5): 142-151.
[
|
| [2] |
包玉斌, 黄涛, 王耀宗, 等. 基于生态重要性与敏感性的六盘山区生态保护修复分区[J]. 干旱区地理, 2023, 46(11): 1778-1791.
[
|
| [3] |
张绍良, 张黎明, 侯湖平, 等. 生态自然修复及其研究综述[J]. 干旱区资源与环境, 2017, 31(1): 160-166.
[
|
| [4] |
王志强, 姜文桓, 卢诗月. 基于生态网络分析的新疆“水-能-碳”耦合系统特征研究[J]. 干旱区地理, 2023, 46(12): 2005-2016.
[
|
| [5] |
刘世梁, 侯笑云, 尹艺洁, 等. 景观生态网络研究进展[J]. 生态学报, 2017, 37(12): 3947-3956.
[
|
| [6] |
|
| [7] |
俞孔坚. 生物保护的景观生态安全格局[J]. 生态学报, 1999, 19(1): 10-17.
[
|
| [8] |
陈南南, 康帅直, 赵永华, 等. 基于MSPA和MCR模型的秦岭(陕西段)山地生态网络构建[J]. 应用生态学报, 2021, 32(5): 1545-1553.
[
|
| [9] |
范春苗, 王志泰, 汤娜, 等. 基于形态学空间格局和空间主成分的贵阳市中心城区生态网络构建[J]. 生态学报, 2022, 42(16): 6620-6632.
[
|
| [10] |
刘泓君, 牛腾, 于强, 等. 基于“重要性—敏感性—景观特征”的黄土高原生态屏障带生态空间网络构建[J]. 水土保持通报, 2022, 42(3): 103-111.
[
|
| [11] |
|
| [12] |
|
| [13] |
|
| [14] |
|
| [15] |
戴璐, 刘耀彬, 黄开忠. 基于MCR模型和DO指数的九江滨水城市生态安全网络构建[J]. 地理学报, 2020, 75(11): 2459-2474.
[
|
| [16] |
|
| [17] |
|
| [18] |
朱陇强, 郭泽呈, 肖敏, 等. 半干旱区县域生态安全格局构建——以临洮县为例[J]. 生态学报, 2022, 42(14): 5799-5811.
[
|
| [19] |
杜雨阳, 王征强, 于庆和, 等. 基于生境质量模型和电路理论的区域生态安全格局构建——以秦岭(陕西段)为例[J]. 农业资源与环境学报, 2022, 39(5): 1069-1078.
[
|
| [20] |
张利, 何玲, 闫丰, 等. 基于图论的两栖类生物栖息地网络规划——以黑斑侧褶蛙为例[J]. 应用生态学报, 2021, 32(3): 1054-1060.
[
|
| [21] |
孙亚荣, 白应飞, 王亚娟, 等. 1999—2018年延安市各区县退耕还林草实施效果分析[J]. 水土保持研究, 2023, 30(1): 209-215.
[
|
| [22] |
杜国明, 孙晓兵, 刘彦随, 等. 黄土高原生态退耕的时空分异特征[J]. 地球信息科学学报, 2017, 19(3): 355-364.
[
|
| [23] |
段艺芳, 任志远, 周晓, 等. 延安市土地生态风险时空格局演变研究[J]. 国土资源遥感, 2020, 32(1): 120-129.
[
|
| [24] |
冯琰玮, 甄江红, 马晨阳. 干旱区城市生态安全格局优化研究——以内蒙古呼和浩特市为例[J]. 水土保持研究, 2020, 27(4): 336-341.
[
|
| [25] |
|
| [26] |
刘晓阳, 魏铭, 曾坚, 等. 闽三角城市群生态网络分析与构建[J]. 资源科学, 2021, 43(2): 357-367.
[
|
| [27] |
|
| [28] |
|
| [29] |
|
| [30] |
|
| [31] |
潘越, 龚健, 杨建新, 等. 基于生态重要性和MSPA核心区连通性的生态安全格局构建——以桂江流域为例[J]. 中国土地科学, 2022, 36(4): 86-95.
[
|
| [32] |
|
| [33] |
王玉莹, 沈春竹, 金晓斌, 等. 基于MSPA和MCR模型的江苏省生态网络构建与优化[J]. 生态科学, 2019, 38(2): 138-145.
[
|
| [34] |
张海铃, 叶长盛, 胡梦姗. 基于生态安全格局的环鄱阳湖城市群生态修复关键区域识别及修复策略[J]. 水土保持研究, 2023, 30(2): 393-402.
[
|
| [35] |
|
| [36] |
|
| [37] |
李恒凯, 刘玉婷, 李芹, 等. 基于MCR模型的南方稀土矿区生态安全格局分析[J]. 地理科学, 2020, 40(6): 989-998.
[
|
| [38] |
史娜娜, 韩煜, 王琦, 等. 青海省保护地生态网络构建与优化[J]. 生态学杂志, 2018, 37(6): 1910-1916.
[
|
| [39] |
倪庆琳, 丁忠义, 侯湖平, 等. 基于电路理论的生态格局识别与保护研究——以宁武县为例[J]. 干旱区资源与环境, 2019, 33(5): 67-73.
[
|
/
| 〈 |
|
〉 |