



Spatial and temporal evolution characteristics and influencing factors of rural ecological resilience in China
Received date: 2023-12-15
Revised date: 2024-01-16
Online published: 2026-03-11
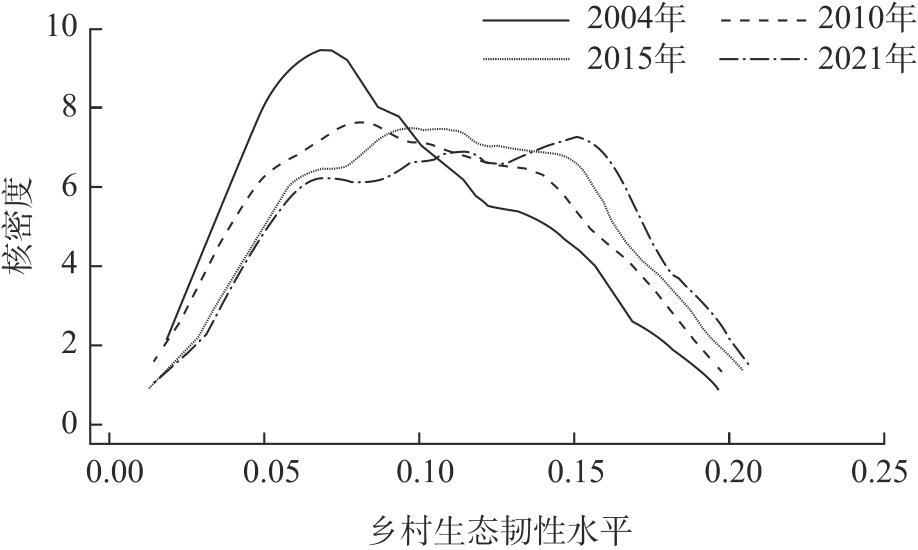
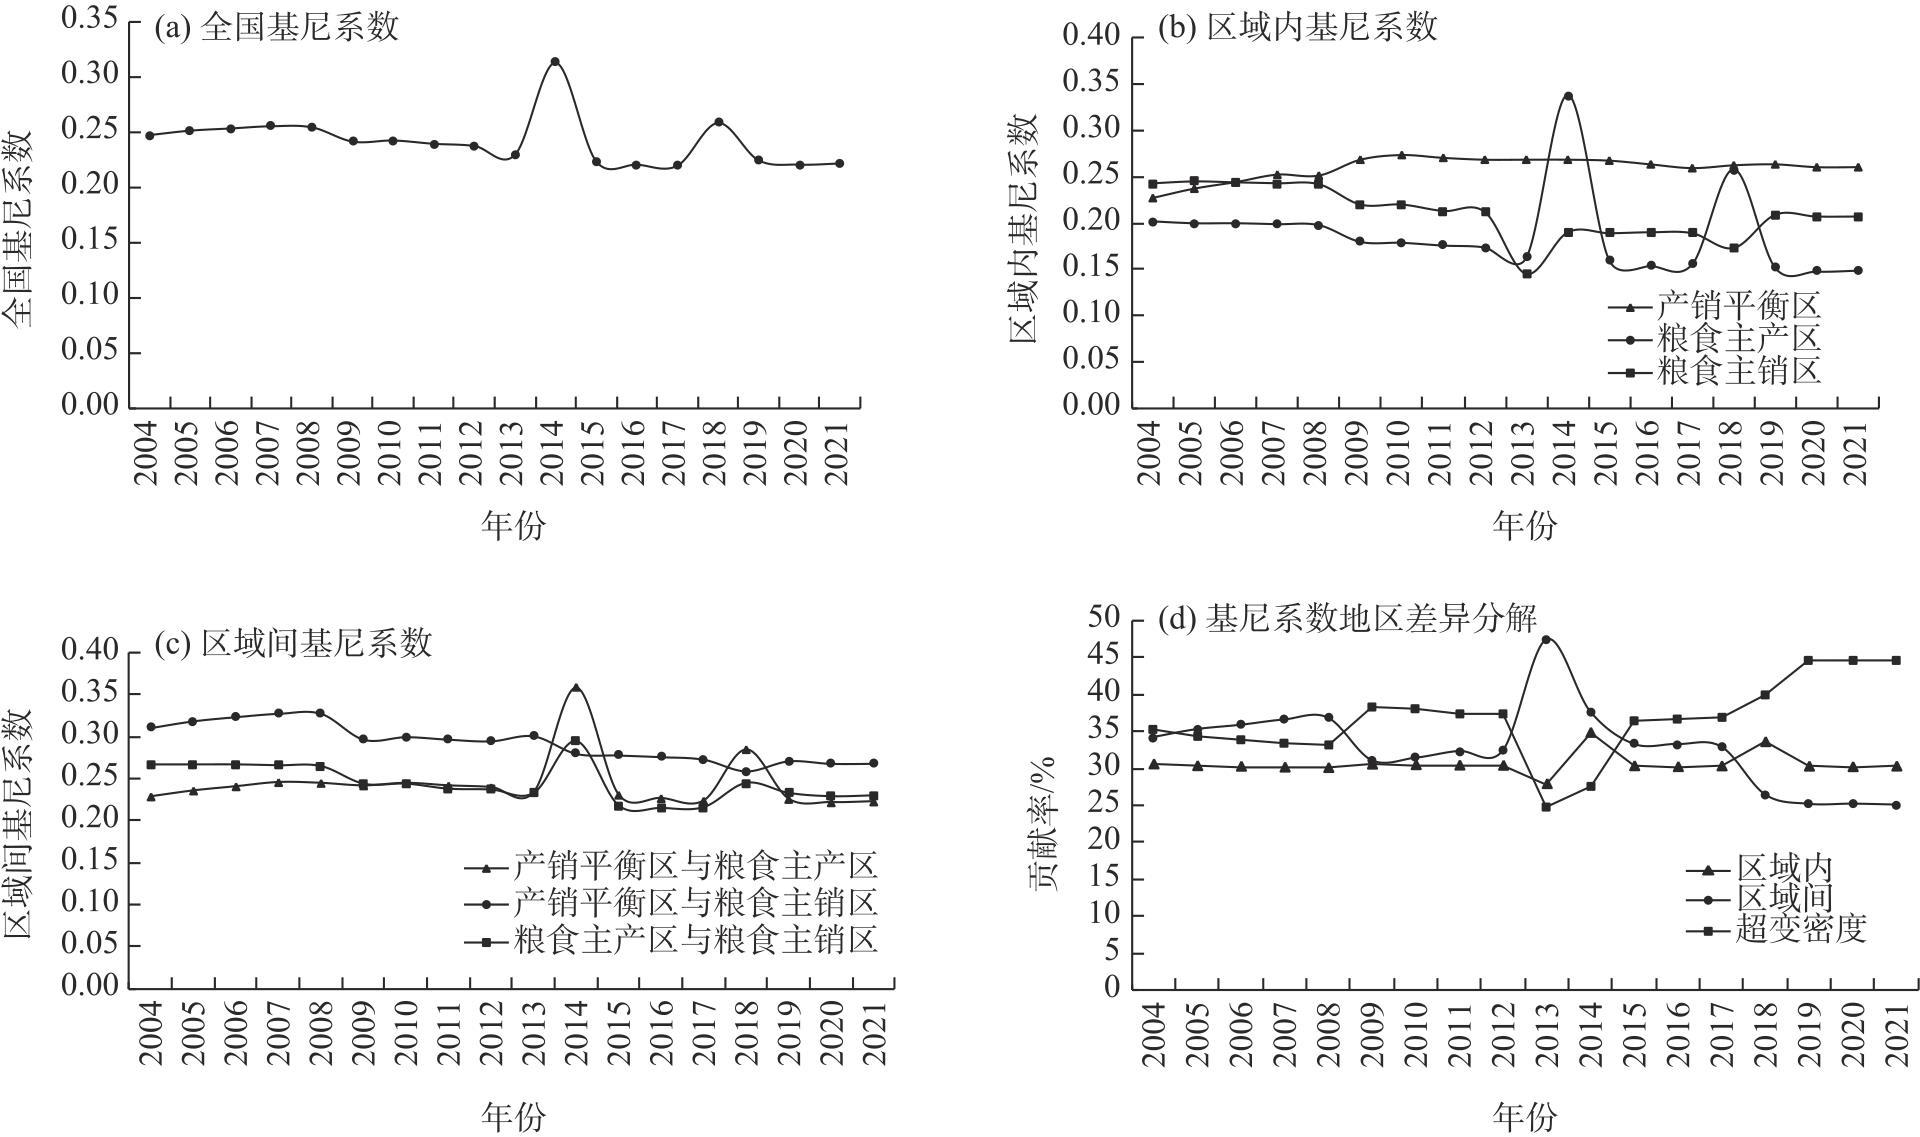
Based on the theory of resilience governance, this paper utilizes panel data from 30 provinces (cities) in China from 2004 to 2021 to construct evaluation indices from the pressure, state, and response dimensions. It objectively measures and systematically portrays the spatial and temporal evolution characteristics of China’s rural ecological resilience, employing the spatial Durbin model to empirically explore the factors influencing rural ecological resilience. The findings indicate that: (1) Although the overall ecological resilience of rural areas nationwide shows an upward trend, it remains at a low level, exhibiting the pattern of main grain marketing areas>main grain producing areas>areas with balanced grain production and marketing. (2) The rural ecological resilience scores display the characteristics of “the curve shifts rightward, the right tail extends, and the width broadens” during the study period. Decomposition of regional disparities using the Dagum Gini coefficient reveals that overall regional differences are not severe and show a persistent trend of narrowing. (3) Analysis of spatial spillover effects indicates that the intensity of environmental regulation significantly and positively influences rural ecological resilience, accompanied by a significant negative spillover effect. Conversely, the urbanization rate significantly and negatively impacts rural ecological resilience, with a significant positive spillover effect. The levels of rural economic growth and government financial support for agriculture also influence rural ecological resilience positively and negatively, respectively, though these effects are not statistically significant. Both factors exhibit significant negative spillover effects in terms of indirect influence.
Hongjie REN , Huishang LI . Spatial and temporal evolution characteristics and influencing factors of rural ecological resilience in China[J]. Arid Land Geography, 2024 , 47(11) : 1915 -1923 . DOI: 10.12118/j.issn.1000-6060.2023.707
表1 乡村生态韧性水平评价指标体系Tab. 1 Evaluation index system of rural ecological resilience level |
| 一级指标 | 二级指标 | 指标解释 | 属性 |
|---|---|---|---|
| 压力维度 | 单位播种面积农用化肥量/10-4 t·m-2 | 农用化肥量/农作物播种面积 | - |
| 单位播种面积农药施用量/10-4 t·m-2 | 农药施用量/农作物播种面积 | - | |
| 单位播种面积农用塑料薄膜使用量/10-4 t·m-2 | 农用塑料薄膜使用量/农作物播种面积 | - | |
| 单位播种面积农业用水量/10 m3·m-2 | 农业用水量/农作物播种面积 | - | |
| 人均农村居民生活污水排放量/m2·人-1 | 农村居民年生活用水量×0.75 | - | |
| 单位播种面积农作物受灾面积占比/% | 农作物受灾(旱灾、风雹灾害、低温、冷冻和雪灾)面积/农作物播种面积 | - | |
| 耕地灾害损毁面积占比/% | 耕地灾害损毁面积/总耕地面积 | - | |
| 沙化土地面积占比/% | 沙化土地面积/地区土地面积 | - | |
| 单位GDP SO2排放量/10-4 t·元-1 | SO2排放量/地区生产总值 | - | |
| 状态维度 | 森林覆盖率/% | 森林面积/地区土地面积 | + |
| 乡村绿化覆盖面积占比/% | 乡村绿化覆盖面积/地区土地面积 | + | |
| 人均水资源总量/m3·人-1 | 人均水资源总量(直接引用) | + | |
| 自然保护区面积占比/% | 自然保护区面积/地区土地面积 | + | |
| 湿地面积占比/% | 湿地面积/地区土地面积 | + | |
| 响应维度 | 水土流失治理面积占比/% | 水土流失治理面积/地区土地面积 | + |
| 除涝面积占比/% | 除涝面积/地区土地面积 | + | |
| 乡村污水处理厂处理效率/104 m2·d-1 | 乡村污水处理厂处理效率(直接引用) | + | |
| 乡村人均公共厕所数量/座·人-1 | 乡村公共厕所数量/乡村人口数量 | + | |
| 乡村人均生活垃圾中转站数量/座·人-1 | 乡村生活垃圾中转站数量/乡村人口数量 | + | |
| 乡村人均沼气池产气量/m2·人-1 | 乡村沼气池产气量/乡村人口数量 | + | |
| 乡村人均农村太阳能热水器面积/m2·人-1 | 乡村农村太阳能热水器面积/乡村人口数量 | + | |
| 乡村绿色建设投入占比/% | 乡村绿色建设投入/乡村总建设投入 | + |
注:“+”“-”分别表示正向指标、负向指标。另外,根据我国住房和城乡建设部2010年制定的《分地区农村生活污水处理技术指南》,农村污水总产生量可按照总用水量的60%~90%进行估算,本文选取中间值(75%)进行测算。 |
表2 乡村生态韧性影响因素指标选取Tab. 2 Selection of influencing factors of rural ecological resilience |
| 变量名称 | 均值 | 标准差 |
|---|---|---|
| 环境规制强度/108元·m-1 | 172.950 | 238.736 |
| 城镇化率/% | 55.098 | 14.254 |
| 农村经济增长水平/108元·人-1 | 0.791 | 0.527 |
| 政府财政支农力度/% | 0.068 | 0.056 |
表3 全国乡村生态韧性水平Tab. 3 National level of rural ecological resilience |
| 年份 | 全国 | 粮食主产区 | 粮食主销区 | 粮食产销平衡区 |
|---|---|---|---|---|
| 2004 | 0.093 | 0.093 | 0.117 | 0.077 |
| 2005 | 0.093 | 0.093 | 0.118 | 0.076 |
| 2006 | 0.093 | 0.093 | 0.118 | 0.075 |
| 2007 | 0.093 | 0.093 | 0.118 | 0.074 |
| 2008 | 0.093 | 0.093 | 0.118 | 0.074 |
| 2009 | 0.102 | 0.101 | 0.126 | 0.087 |
| 2010 | 0.102 | 0.101 | 0.126 | 0.086 |
| 2011 | 0.102 | 0.101 | 0.127 | 0.087 |
| 2012 | 0.103 | 0.102 | 0.128 | 0.087 |
| 2013 | 0.115 | 0.108 | 0.160 | 0.094 |
| 2014 | 0.133 | 0.162 | 0.136 | 0.094 |
| 2015 | 0.110 | 0.108 | 0.136 | 0.094 |
| 2016 | 0.111 | 0.109 | 0.136 | 0.095 |
| 2017 | 0.111 | 0.109 | 0.137 | 0.095 |
| 2018 | 0.127 | 0.137 | 0.142 | 0.102 |
| 2019 | 0.114 | 0.112 | 0.135 | 0.102 |
| 2020 | 0.114 | 0.113 | 0.135 | 0.102 |
| 2021 | 0.114 | 0.112 | 0.135 | 0.102 |
| 均值 | 0.107 | 0.108 | 0.131 | 0.089 |
| 增长率/% | 22.581 | 20.430 | 15.385 | 32.468 |
表4 空间杜宾模型估计结果Tab. 4 Spatial Durbin model estimation results |
| 变量 | (1) | (2) | (3) | (4) | (5) |
|---|---|---|---|---|---|
| 主效应 | 空间效应 | 直接效应 | 间接效应 | 总效应 | |
| 环境规制强度 | 0.083***(8.97) | -0.144***(-8.02) | 0.062***(5.69) | -0.236***(-4.56) | -0.174***(-3.01) |
| 城镇化率 | -0.001***(-6.24) | 0.002***(5.93) | -0.001***(-4.89) | 0.004***(4.14) | 0.003***(2.94) |
| 农村经济增长水平 | 0.006(1.20) | -0.028***(-2.69) | 0.001(0.10) | -0.061*(-1.96) | -0.061*(-1.67) |
| 政府财政支农力度 | 0.054(0.55) | -0.514***(-3.30) | -0.067(-0.69) | -1.256***(-3.34) | -1.323***(-3.19) |
| 0.645***(16.31) | |||||
| R-squared | 0.001 | ||||
注:***、**、*分别表示在1%、5%、10%水平上显著;括号内数值为Z值; 为空间自相关系数;R-squared为决定系数。 |
| [1] |
何龙斌, 王海鑫. 乡村产业振兴与生态产品价值实现: 逻辑关系、耦合机理与协同路径[J]. 经济纵横, 2023(11): 88-94.
[
|
| [2] |
谷晓芸. 推进乡村生态振兴: 现实困境与突破路径[J]. 农业经济, 2023(12): 58-59.
[
|
| [3] |
师荣光, 武文豪, 汪常乐, 等. 绿色发展视角下乡村生态环境规划的几点思考[J]. 农业资源与环境学报, 2023, 40(5): 989-996.
[
|
| [4] |
白凌婷, 徐嘉辉, 谢小军. 乡村振兴背景下农村生态环境污染治理的不足与对策[J]. 农业经济, 2023(8): 34-37.
[
|
| [5] |
|
| [6] |
郑艳洁, 秦烨, 康耀武. 中国乡村韧性评价与空间分异研究[J]. 价格理论与实践, 2023(5): 159-163.
[
|
| [7] |
和佳慧, 吴映梅, 余丽娇, 等. 西部地区乡村韧性的时空演变及驱动因子探测[J]. 地域研究与开发, 2023, 42(1): 144-148, 160.
[
|
| [8] |
祝文婷, 韦燕飞, 李文辉, 等. “三生”视角下的西江流域(广西段)乡村韧性时空分异特征[J]. 水土保持研究, 2023, 30(4): 438-446.
[
|
| [9] |
王彩丽, 闫绪娴. 中国乡村韧性时空分异及障碍因子诊断[J]. 经济问题, 2022(10): 91-97.
[
|
| [10] |
郭佳, 翟国方, 葛懿夫. 乡村人居环境综合韧性指数构建及实证研究——以江苏省为例[J]. 上海城市规划, 2023(2): 15-22.
[
|
| [11] |
田健, 眭长清, 曾穗平, 等. 山地乡村人居环境系统韧性的空间分异机制与优化策略——以西藏昌都为例[J]. 上海城市规划, 2023(2): 29-37.
[
|
| [12] |
程莉, 黄兰稀, 严月岑, 等. 长江经济带乡村生态韧性测度及影响因素研究[J]. 中国农业资源与区划, 2024, 45(5): 11-23.
[
|
| [13] |
王鑫. 乡村生态韧性治理的水平测度与融合发展[J]. 统计与决策, 2023, 39(20): 45-50.
[
|
| [14] |
曲霞, 文晓巍. 乡村振兴背景下韧性乡村的影响因素与示范带耦合分析[J]. 学术研究, 2022(12): 90-95.
[
|
| [15] |
王成, 吴昕玥. 重庆市乡村生产空间系统韧性扰动因素的空间效应及作用关系[J]. 资源科学, 2022, 44(8): 1604-1614.
[
|
| [16] |
黄河东. 基于PSR模型和改进TOPSIS法的中国城市群生态质量比较研究[J]. 生态经济, 2016, 32(6): 164-167, 200.
[
|
| [17] |
彭建, 吴健生, 潘雅婧, 等. 基于PSR模型的区域生态持续性评价概念框架[J]. 地理科学进展, 2012, 31(7): 933-940.
[
|
| [18] |
徐磊, 张盼盼, 张贵军, 等. 基于结构和功能的河北省县域乡村地域系统韧性及协调特征研究[J]. 地理与地理信息科学, 2023, 39(5): 98-106, 130.
[
|
| [19] |
霍松涛. 中国乡村经济韧性测度及时空演变特征研究[J]. 云南财经大学学报, 2023, 39(6): 1-17.
[
|
| [20] |
胡霄, 李红波, 李智, 等. 河北省县域乡村韧性测度及时空演变[J]. 地理与地理信息科学, 2021, 37(3): 89-96.
[
|
| [21] |
周建军, 谭莹, 胡洪涛. 环境规制对中国生猪养殖生产布局与产业转移的影响分析[J]. 农业现代化研究, 2018, 39(3): 440-450.
[
|
| [22] |
朱战国, 朱书凝, 周琳, 等. 高质量发展新格局下中国生猪产业可持续发展水平评价[J]. 农业经济问题, 2023(4): 105-122.
[
|
| [23] |
高延雷, 张正岩, 王志刚. 基于熵权TOPSIS方法的粮食安全评价: 从粮食主产区切入[J]. 农林经济管理学报, 2019, 18(2): 135-142.
[
|
| [24] |
|
| [25] |
夏文浩, 王铭扬, 姜磊. 新疆农业碳排放强度时空变化趋势与收敛分析[J]. 干旱区地理, 2023, 46(7): 1145-1154.
[
|
| [26] |
杜娅明, 白永平, 梁建设, 等. 黄河流域旅游业碳排放效率综合测度及影响因素研究[J]. 干旱区地理, 2023, 46(12): 2074-2085.
[
|
| [27] |
|
/
| 〈 |
|
〉 |