



Spatio-temporal pattern of urban-rural income gap in the Yellow River Basin and its response to urbanization
Received date: 2024-01-22
Revised date: 2024-02-25
Online published: 2026-03-11
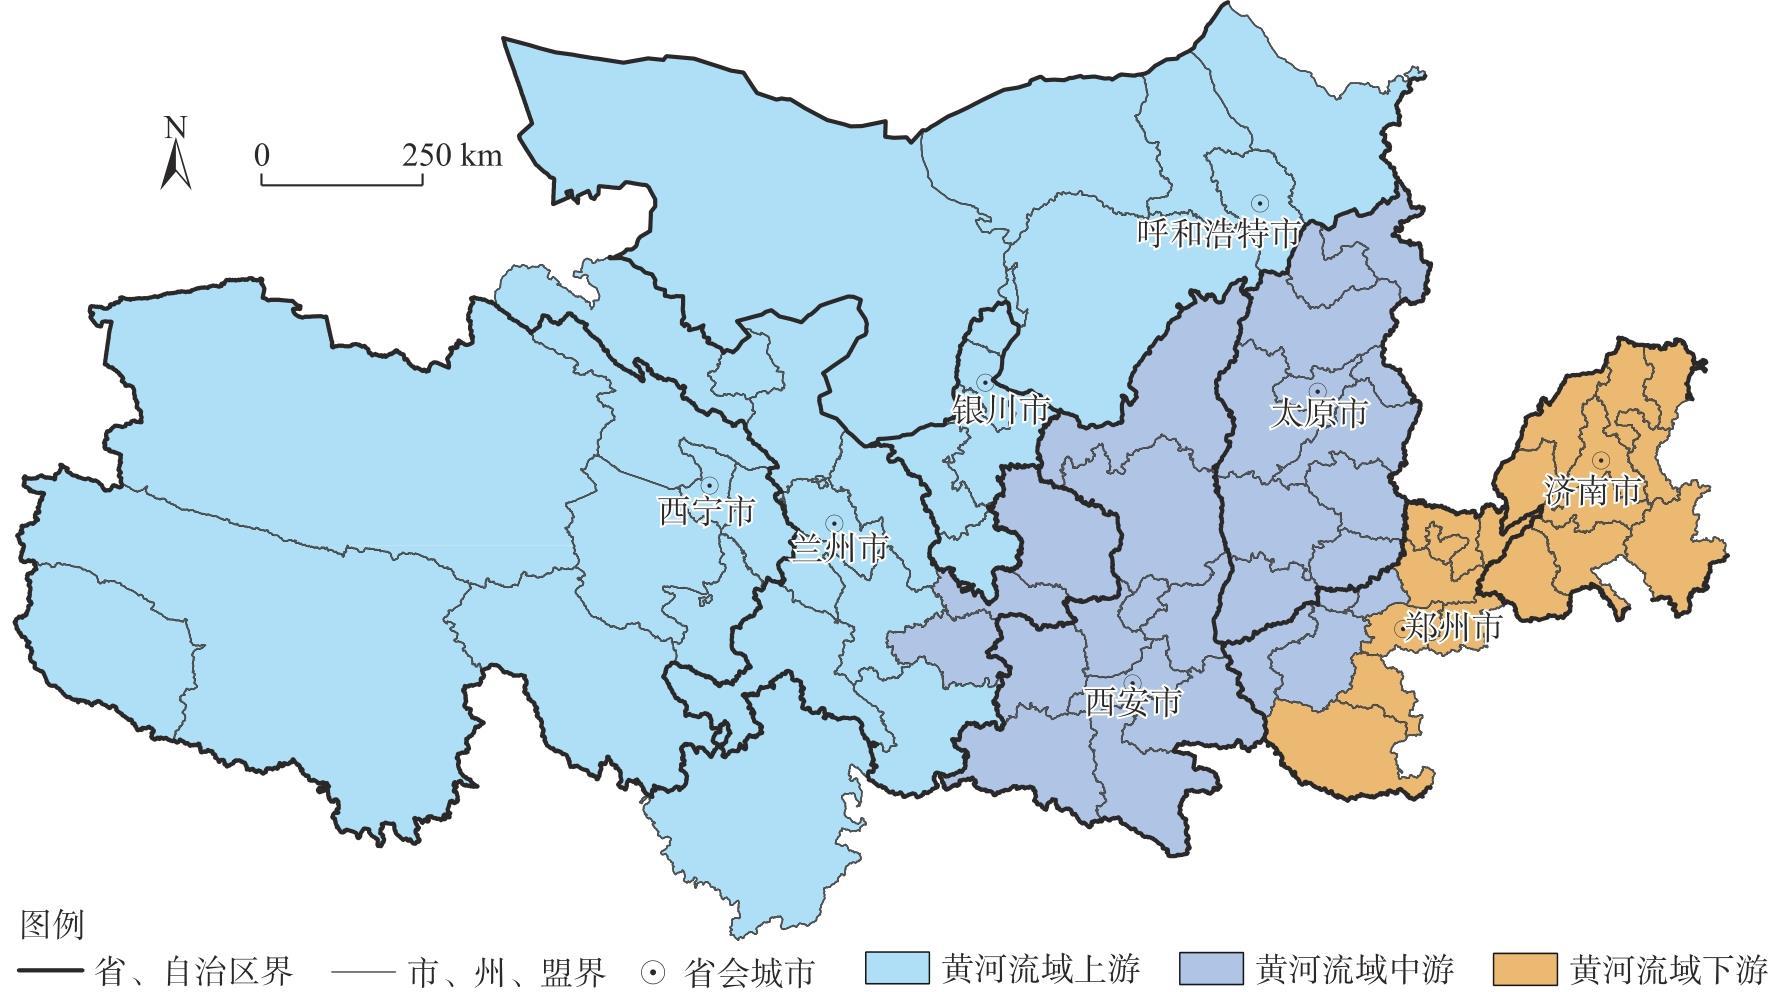
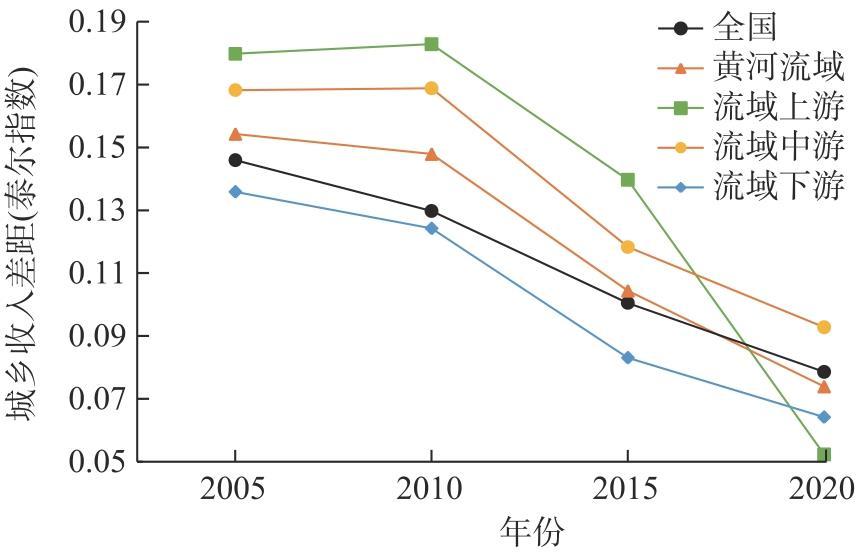
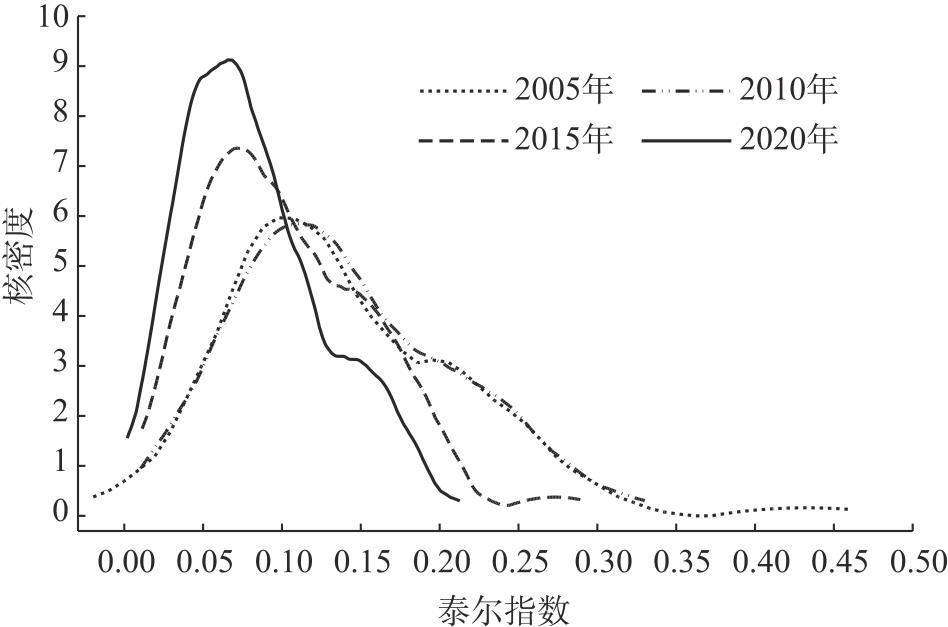
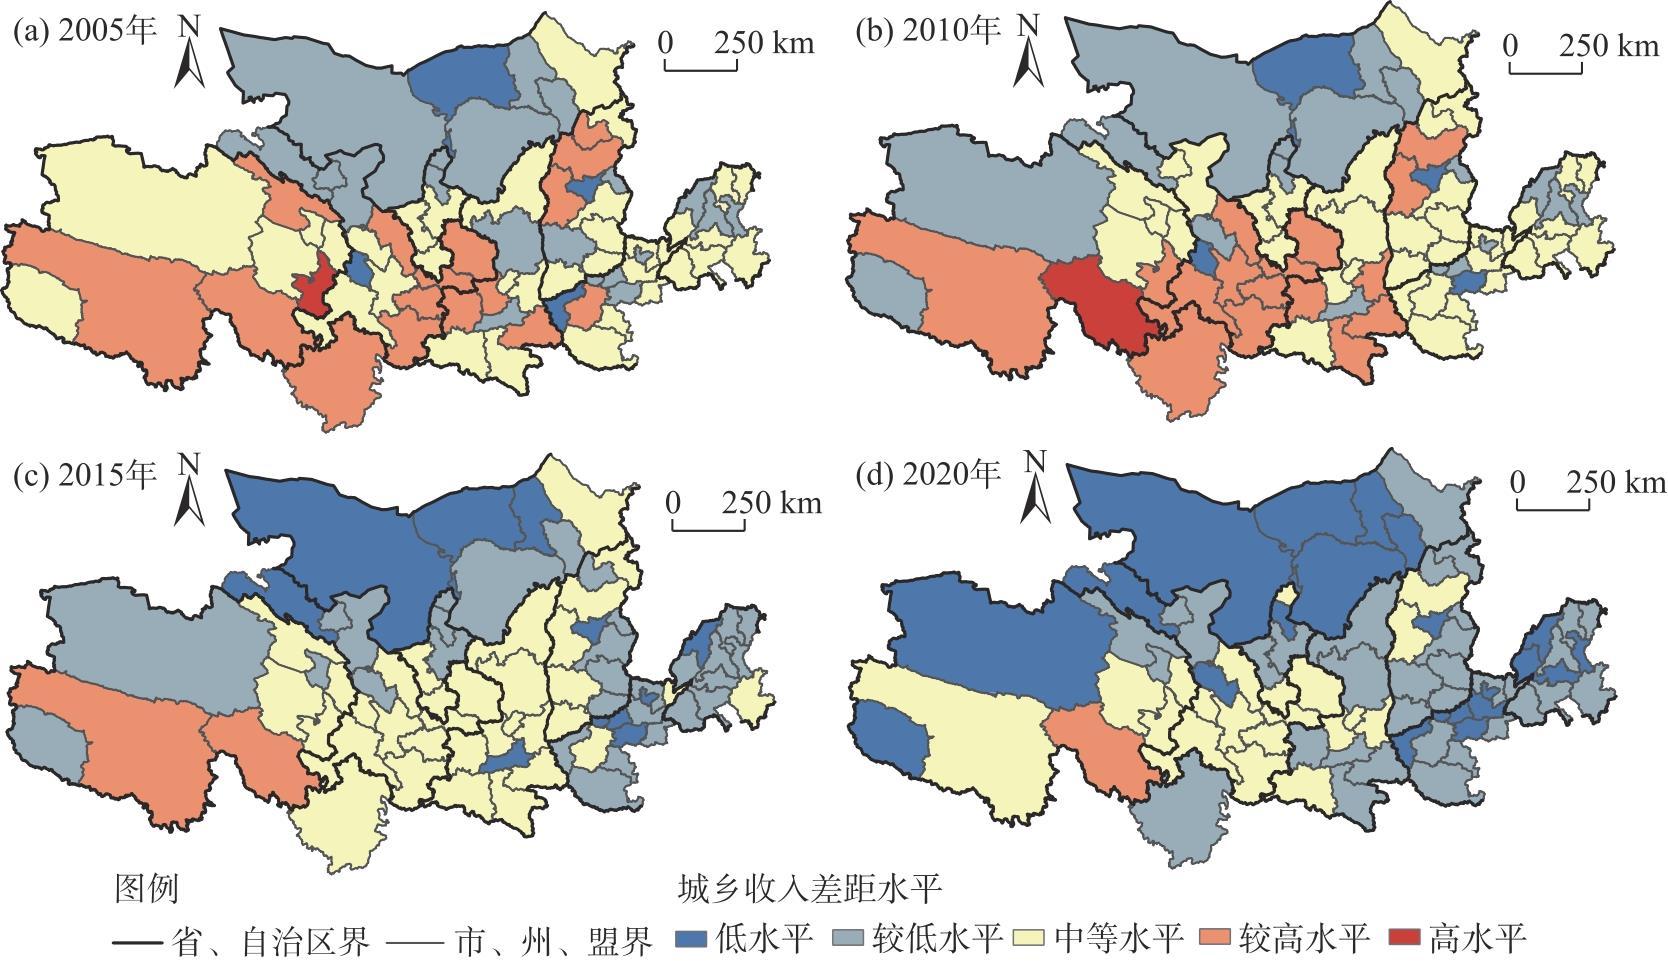
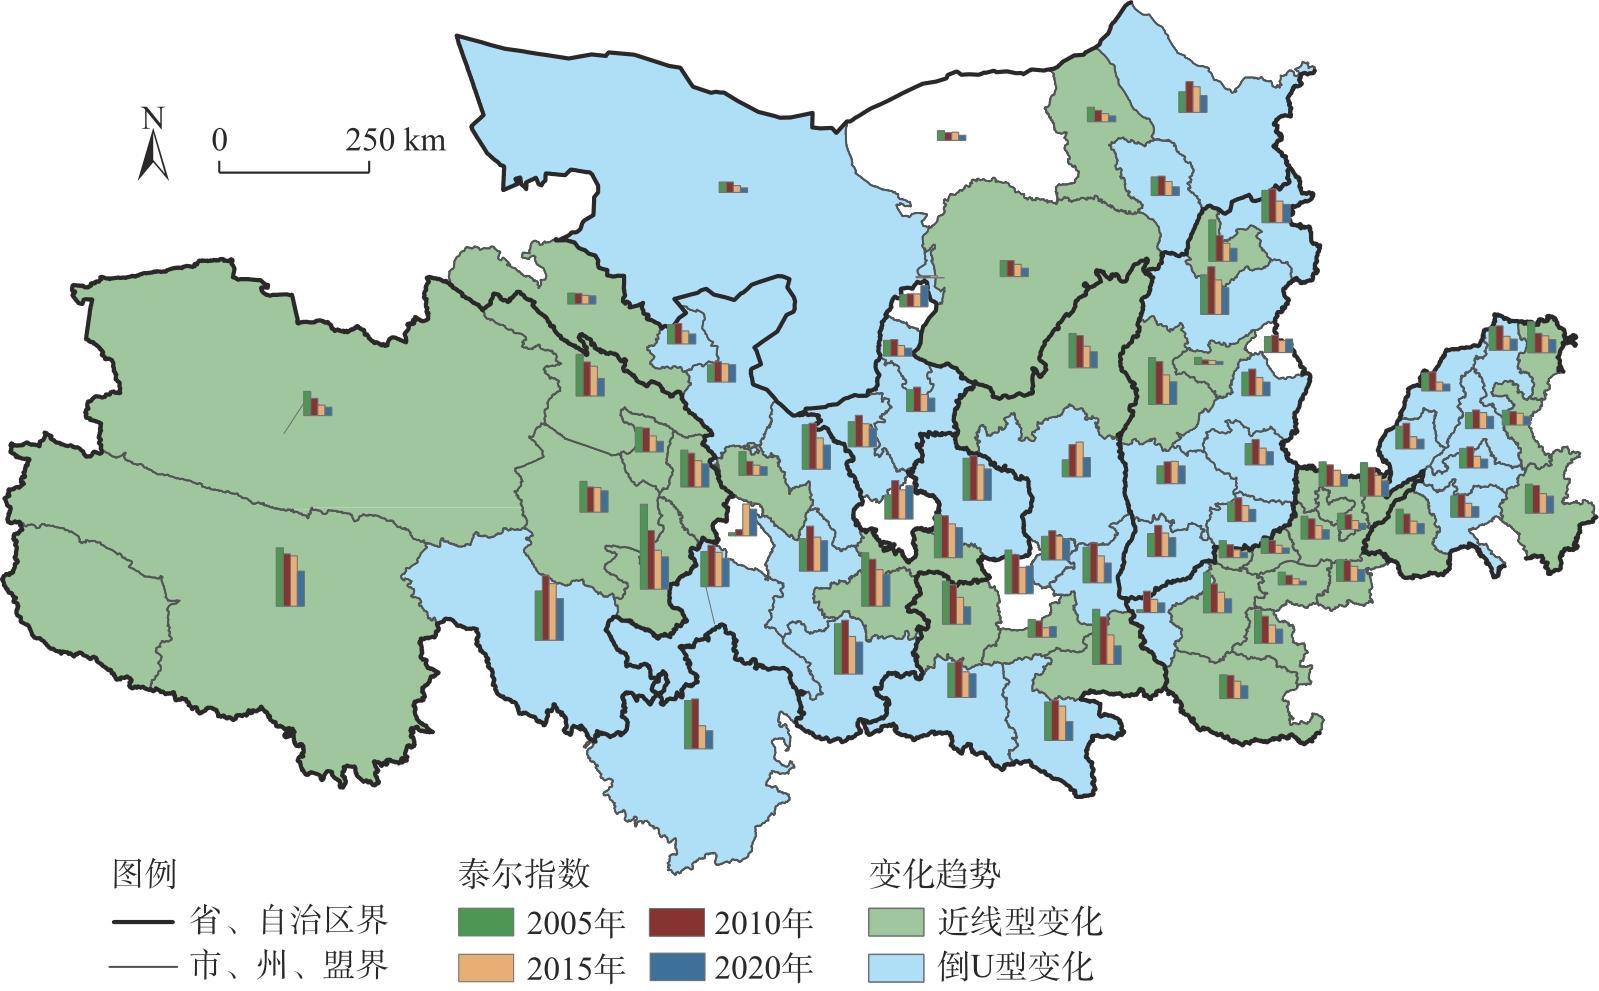
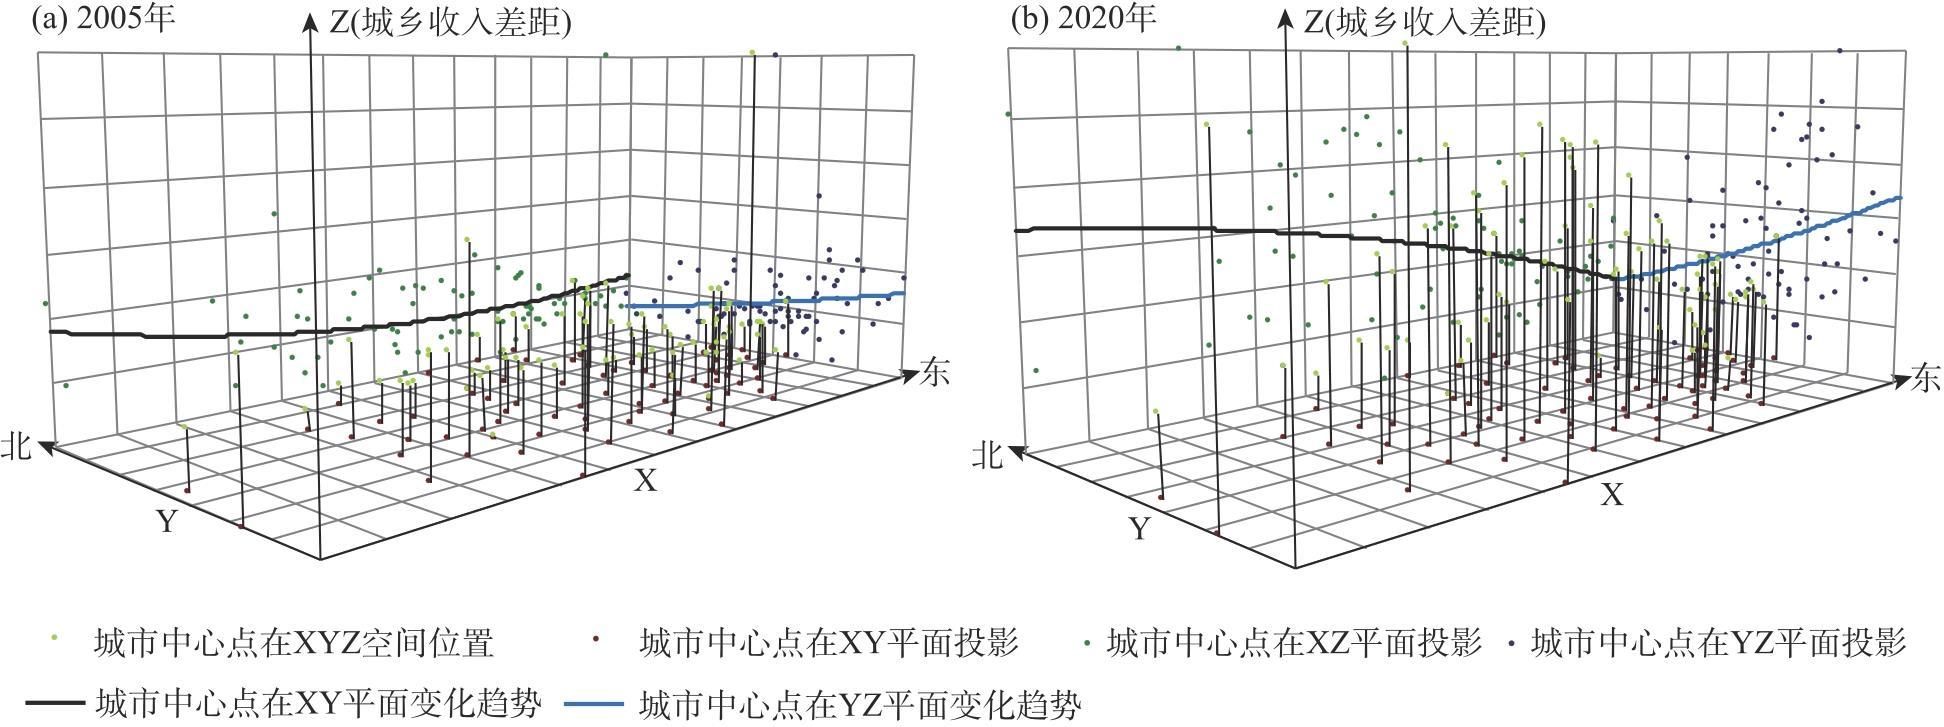
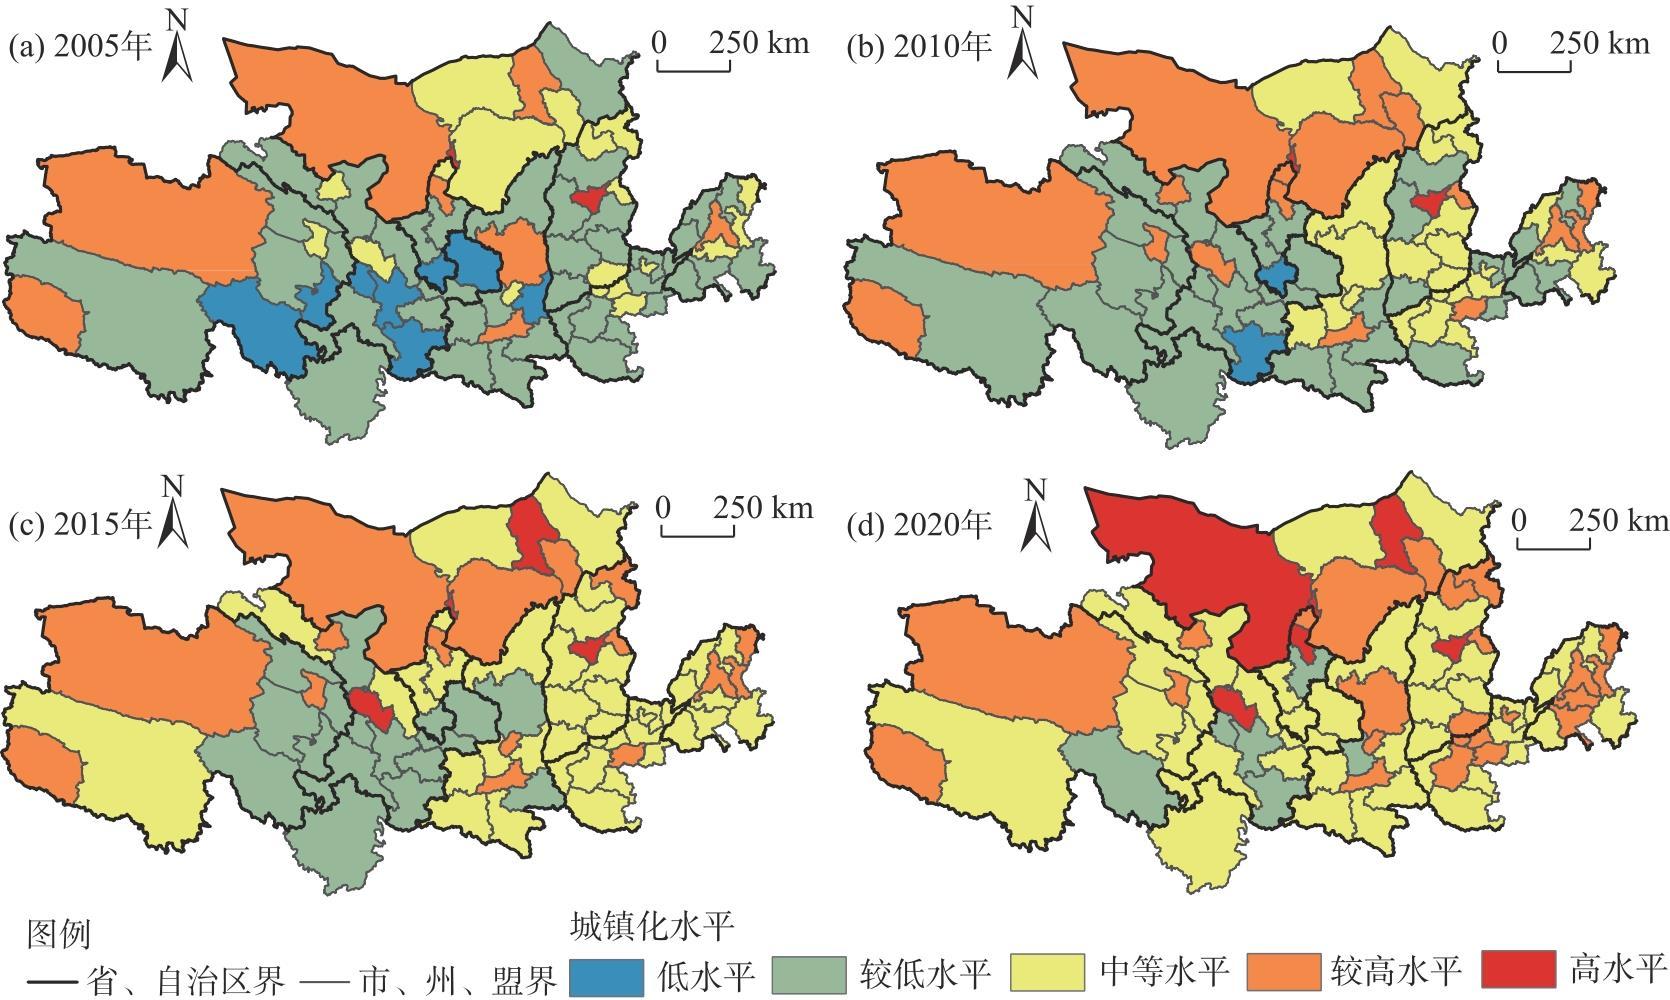
Interpreting the spatiotemporal evolution characteristics of the urban-rural income gap and the urbanization level in the Yellow River Basin and exploring their relationship are of great significance for addressing the imbalance in urban-rural and regional development, narrowing the urban-rural income gap, and promoting integrated urban-rural development. This paper took 76 prefectures and cities in the Yellow River Basin as research objects and employed the Theil index, kernel density estimation, spatial econometric model, GIS, and mathematical analysis methods to analyze the spatiotemporal evolution characteristics of the urban-rural income gap and urbanization level from 2005 to 2020. It revealed the extent of the former’s response to the latter and examined other influencing factors of the urban-rural income gap. The results indicated the following. (1) From 2005 to 2020, the urban-rural income gap in the Yellow River Basin showed a narrowing trend, that in different zones exhibited a stair-step increase trend of “lower reaches<middle reaches<upper reaches”, and that between regions showed a narrowing and converging trend. Looking at different regions, 35 prefectures and cities, including Aba, Ankang, and Linfen, showed an “inverted U-shaped” trend in the urban-rural income gap, whereas 35 prefectures and cities, including Anyang, Baoji, and Baotou, showed a nearly linear trend in the urban-rural income gap. In terms of spatial distribution, the urban-rural income gap in the Yellow River Basin showed an upward trend from north to south and tended to decrease from west to east. (2) From 2005 to 2020, the urbanization level in the Yellow River Basin transformed from being mainly at a low level to being mainly at a medium to high level, with a significant increase in urbanization level. (3) The impact of urbanization level on the urban-rural income gap in the Yellow River Basin exhibited a nonlinear “inverted U-shaped” feature. After the urbanization level exceeded a certain threshold, its impact on the urban-rural income gap changed from positive promotion to negative inhibition. The impact of urbanization level on the urban-rural income gap exhibited spatial heterogeneity. In the upstream and middle reaches of the Yellow River Basin, the impact of urbanization level on the urban-rural income gap showed an “inverted U-shaped” feature, whereas the impact of urbanization level on the urban-rural income gap exhibited a negative linear feature in the downstream area. There was a spatial spillover effect of urbanization level in adjacent areas, and both the local urbanization level and the urbanization level in adjacent areas had significant nonlinear inverted “U-shaped” relationships with the local urban-rural income gap. These research results can provide reference and guidance for narrowing the urban-rural income gap in the Yellow River Basin and promoting urban-rural integration.
Key words: urban-rural income; urbanization; spatial lag model; Yellow River Basin
Haijin SHI , Xinzheng ZHAO , Xiangxiang LI , Yuzhong HUANG , Xing YU , Bochen XIANGLI . Spatio-temporal pattern of urban-rural income gap in the Yellow River Basin and its response to urbanization[J]. Arid Land Geography, 2024 , 47(10) : 1781 -1793 . DOI: 10.12118/j.issn.1000-6060.2024.050
表1 2005—2020年莫兰指数值Tab. 1 Moran index values from 2005 to 2020 |
| 年份 | 莫兰指数 | 莫兰指数均值 | 莫兰指数标准差 | Z统计量 | P值 |
|---|---|---|---|---|---|
| 2005 | 0.024 | -0.013 | 0.015 | 2.260 | 0.024 |
| 2010 | 0.052 | -0.013 | 0.015 | 4.214 | 0.000 |
| 2015 | 0.086 | -0.013 | 0.016 | 6.321 | 0.000 |
| 2020 | 0.070 | -0.013 | 0.015 | 5.604 | 0.000 |
表2 空间模型选择Tab. 2 Spatial model selection |
| 模型种类 | 显著性检验 |
|---|---|
| LM-lag | 8.702*** |
| Robust LM-lag | 8.886*** |
| LM-error | 0.022 |
| Robust LM-error | 0.186 |
| Hausman | 79.260*** |
| LR_ind | 23.130 |
| LR_time | 446.180*** |
注:*、**、***分别表示P<0.10、P<0.05、P<0.01。下同。 |
表3 模型回归结果Tab. 3 Model regression results |
| 变量 | OLS模型1 | SLM模型2 | SLM模型3 |
|---|---|---|---|
| (lnui)2 | -1.1745*** (0.1177) | -1.1448*** (0.1149) | -1.1138*** (0.1166) |
| lnui | -3.2045*** (0.2339) | -2.9685*** (0.2459) | -3.0231*** (0.2223) |
| lnesin | -0.5754** (0.2671) | 0.3741 (0.2747) | |
| lnfaipi | -0.0909*** (0.0303) | -0.0991*** (0.0306) | |
| lnpbea | 0.0779 (0.0513) | -0.1271** (0.0608) | |
| lnhmpa | -0.1453*** (0.0287) | -0.1090*** (0.0323) | |
| AIC | 370.7102 | 359.3769 | |
| BIC | 396.7294 | 389.1132 | |
| R-sq | 0.59 | 0.58 |
注:(lnui)2、lnui、lnesin、lnfaipi、lnpbea、lnhmpa分别为城镇化水平二次项、城镇化水平、产业结构、第一产业固定资产投资份额、农林水事务公共预算支出的份额、公路里程;AIC为赤池信息准则;BIC为贝叶斯信息准则;R-sq为模型拟合度。括号内数值为统计标准误差。下同。 |
表4 2005—2020年黄河流域城镇化水平对城乡收入差距异质性检验Tab. 4 Examining heterogeneity of urbanization levels on urban-rural income gap in the Yellow River Basin from 2005 to 2020 |
| 变量 | 黄河流域上游 | 黄河流域中游 | 黄河流域下游 |
|---|---|---|---|
| (lnui)2 | -1.1411*** (0.1710) | -0.9182*** (0.2726) | -0.3988 (0.3507) |
| lnui | -3.0147*** (0.3880) | -2.2709*** (0.5491) | -1.0993* (0.6349) |
| lnesin | 0.0932 (0.4016) | -1.4921** (0.7290) | 1.0006* (0.5938) |
| lnfaipi | -0.0593 (0.0640) | -0.1025** (0.0476) | -0.0494 (0.0342) |
| lnpbea | -0.1846** (0.0918) | -0.1218 (0.1081) | -0.3446** (0.1501) |
| lnhmpa | -0.1470*** (0.0538) | -0.3776*** (0.1094) | -0.1206 (0.1361) |
表5 空间溢出效应结果Tab. 5 Spatial spillover effect results |
| 变量 | 直接效应 | 间接效应 | 总效应 | |||||
|---|---|---|---|---|---|---|---|---|
| 系数 | Z值 | 系数 | Z值 | 系数 | Z值 | |||
| (lnui)2 | -1.1375*** | -9.90 | -0.4821*** | -3.29 | -1.6196*** | -7.10 | ||
| lnui | -2.8861*** | -11.97 | -1.2198*** | -3.44 | -4.1059*** | -8.19 | ||
| lnesin | 0.3580 | 1.33 | 0.1499 | 1.20 | 0.5079 | 1.31 | ||
| lnfaipi | -0.1058*** | -3.31 | -0.0444** | -2.48 | -0.1503 | -3.21 | ||
| lnpbea | -0.1132* | -1.72 | -0.0465 | -1.49 | -0.1597* | -1.69 | ||
| lnhmpa | -0.0975*** | -3.34 | -0.0404*** | -2.60 | -0.1379*** | -3.36 | ||
| [1] |
金晓斌, 叶超, 岳文泽, 等. 新时代中国城乡融合发展: 挑战与路径[J]. 自然资源学报, 2024, 39(1): 1-28.
[
|
| [2] |
刘彦随. 中国新时代城乡融合与乡村振兴[J]. 地理学报, 2018, 73(4): 637-650.
[
|
| [3] |
陈明星, 隋昱文, 郭莎莎. 中国新型城镇化在“十九大”后发展的新态势[J]. 地理研究, 2019, 38(1): 181-192.
[
|
| [4] |
王云, 马丽, 刘毅. 城镇化研究进展与趋势: 基于CiteSpace和HistCite的图谱量化分析[J]. 地理科学进展, 2018, 37(2): 239-254.
[
|
| [5] |
李靖, 廖和平, 刘愿理, 等. 四川省新型城镇化与城乡收入差距时空演化及关联性分析[J]. 地理科学进展, 2023, 42(4): 657-669.
[
|
| [6] |
李裕瑞, 王婧, 刘彦随, 等. 中国“四化”协调发展的区域格局及其影响因素[J]. 地理学报, 2014, 69(2): 199-212.
[
|
| [7] |
周少甫, 亓寿伟, 卢忠宝. 地区差异、城市化与城乡收入差距[J]. 中国人口·资源与环境, 2010, 20(8): 115-120.
[
|
| [8] |
王明康, 刘彦平. 旅游产业集聚、城镇化与城乡收入差距——基于省级面板数据的实证研究[J]. 华中农业大学学报(社会科学版), 2019(6): 78-88.
[
|
| [9] |
|
| [10] |
洪丽, 尹康. 中国城镇化与城乡收入差距的“倒U型”拐点测度——基于东、中、西部地区省际面板数据的实证研究[J]. 统计与信息论坛, 2015, 30(9): 12-21.
[
|
| [11] |
|
| [12] |
闫东升, 孙伟, 冯月. 城乡收入差距时空演变与驱动因素的空间计量研究——以长江三角洲为例[J]. 长江流域资源与环境, 2021, 30(5): 1040-1054.
[
|
| [13] |
殷颂葵. 西北地区城乡收入差距的时空分异及影响因素[J]. 中国农业资源与区划, 2022, 43(1): 197-205.
[
|
| [14] |
付占辉, 梅林, 刘艳军, 等. 东北三省城乡收入差距空间格局及其分异机制研究[J]. 地理科学, 2019, 39(9): 1473-1483.
[
|
| [15] |
夏赞才, 龚艳青, 罗文斌. 中国旅游经济增长与城乡收入差距的变异关系[J]. 资源科学, 2016, 38(4): 599-608.
[
|
| [16] |
李实, 朱梦冰. 中国经济转型40年中居民收入差距的变动[J]. 管理世界, 2018, 34(12): 19-28.
[
|
| [17] |
欧阳金琼, 朱晓玲, 王雅鹏. 城镇化影响城乡收入差距的时空差异分析[J]. 统计与决策, 2015(4): 108-111.
[
|
| [18] |
张改素, 王发曾, 康珈瑜, 等. 长江经济带县域城乡收入差距的空间格局及其影响因素[J]. 经济地理, 2017, 37(4): 42-51.
[
|
| [19] |
武小龙, 刘祖云. 中国城乡收入差距影响因素研究——基于2002—2011年省级Panel Data的分析[J]. 当代经济科学, 2014, 36(1): 46-54.
[
|
| [20] |
任嘉敏, 郭付友, 赵宏波, 等. 黄河流域资源型城市工业绿色转型绩效评价及时空异质性特征[J]. 中国人口·资源与环境, 2023, 33(6): 151-160.
[
|
| [21] |
江岳坤, 石鹏娟. 中国市域城乡收入差距时空演化及影响因素[J]. 干旱区地理, 2024, 47(1): 147-157.
[
|
| [22] |
张琦, 曹蔚宁, 延书宁. 旅游发展对城乡收入差距影响的空间异质性——基于多尺度地理加权回归模型(MGWR)[J]. 中国地质大学学报(社会科学版), 2022, 22(5): 112-123.
[
|
| [23] |
张耀军, 柴多多. 人口城镇化与城乡收入差距耦合关系研究[J]. 人口研究, 2018, 42(6): 61-73.
[
|
| [24] |
聂高辉, 宋璐. 城镇化、基础设施投资与城乡收入差距——基于省级面板数据的实证分析[J]. 华东经济管理, 2020, 34(2): 86-93.
[
|
| [25] |
余菊, 刘新. 城市化、社会保障支出与城乡收入差距——来自中国省级面板数据的经验证据[J]. 经济地理, 2014, 34(3): 79-84.
[
|
| [26] |
卢冲, 刘媛, 江培元. 产业结构、农村居民收入结构与城乡收入差距[J]. 中国人口·资源与环境, 2014, 24(增刊1): 147-150.
[
|
| [27] |
陈斌开, 张鹏飞, 杨汝岱. 政府教育投入、人力资本投资与中国城乡收入差距[J]. 管理世界, 2010(1): 36-43.
[
|
| [28] |
张贺, 白钦先. 数字普惠金融减小了城乡收入差距吗?——基于中国省级数据的面板门槛回归分析[J]. 经济问题探索, 2018(10): 122-129.
[
|
| [29] |
袁冬梅, 魏后凯, 杨焕. 对外开放、贸易商品结构与中国城乡收入差距——基于省际面板数据的实证分析[J]. 中国软科学, 2011(6): 47-56.
[
|
| [30] |
孔艳芳. 城镇化是否缩小了中国城乡收入差距: 基于直接影响与空间溢出效应的经验论证[J]. 山东财经大学学报, 2019, 31(4): 87-98.
[
|
| [31] |
|
| [32] |
刘赛红, 朱建. 金融发展、城镇化与城乡居民收入差距关系实证[J]. 经济地理, 2017, 37(8): 46-52.
[
|
| [33] |
李丹, 裴育. 城乡公共服务差距对城乡收入差距的影响研究[J]. 财经研究, 2019, 45(4): 111-123.
[
|
| [34] |
张车伟, 赵文. 进一步缩小收入差距的挑战与对策[J]. 社会政策研究, 2017(1): 29-42.
[
|
| [35] |
王子敏. 我国城市化与城乡收入差距关系再检验[J]. 经济地理, 2011, 31(8): 1289-1293.
[
|
| [36] |
王森. 城镇化对城乡收入差距影响的实证研究[J]. 统计与决策, 2018, 34(23): 110-113.
[
|
| [37] |
徐家鹏, 张丹. 城镇化转型与中国城乡收入差距的收敛[J]. 地域研究与开发, 2019, 38(1): 17-21.
[
|
| [38] |
王奕淇, 李国平. 基于SD模型的黄河流域生态环境与社会经济发展可持续性模拟[J]. 干旱区地理, 2022, 45(3): 901-911.
[
|
| [39] |
王嘉嘉, 张轲. 生态保护视角下的黄河流域高质量发展非均衡性及演进趋势分析[J]. 干旱区地理, 2024, 47(4): 695-706.
[
|
| [40] |
林万龙, 米晶. 县域包容性增长测度及其对乡村振兴的启示[J]. 自然资源学报, 2023, 38(8): 2117-2134.
[
|
| [41] |
王凯, 刘美伦, 甘畅, 等. 武陵山片区旅游产业集聚与城乡收入差距空间错位及其影响因素[J]. 干旱区资源与环境, 2023, 37(11): 172-181.
[
|
| [42] |
王兆峰, 张先甜. 黄河流域旅游经济系统韧性的时空差异特征及其影响因素[J]. 地理与地理信息科学, 2023, 39(3): 112-121.
[
|
| [43] |
|
| [44] |
姚璐, 王书华. 黄河流域金融集聚对绿色经济效率影响的空间溢出效应研究——兼论环境规制的调节作用[J]. 地理科学, 2023, 43(10): 1783-1792.
[
|
/
| 〈 |
|
〉 |