
Temporal and spatial changes of glaciers and glacier lakes and its response to climate change in Poiqu Basin during 1990—2020
Received date: 2023-09-21
Revised date: 2024-01-02
Online published: 2024-06-20
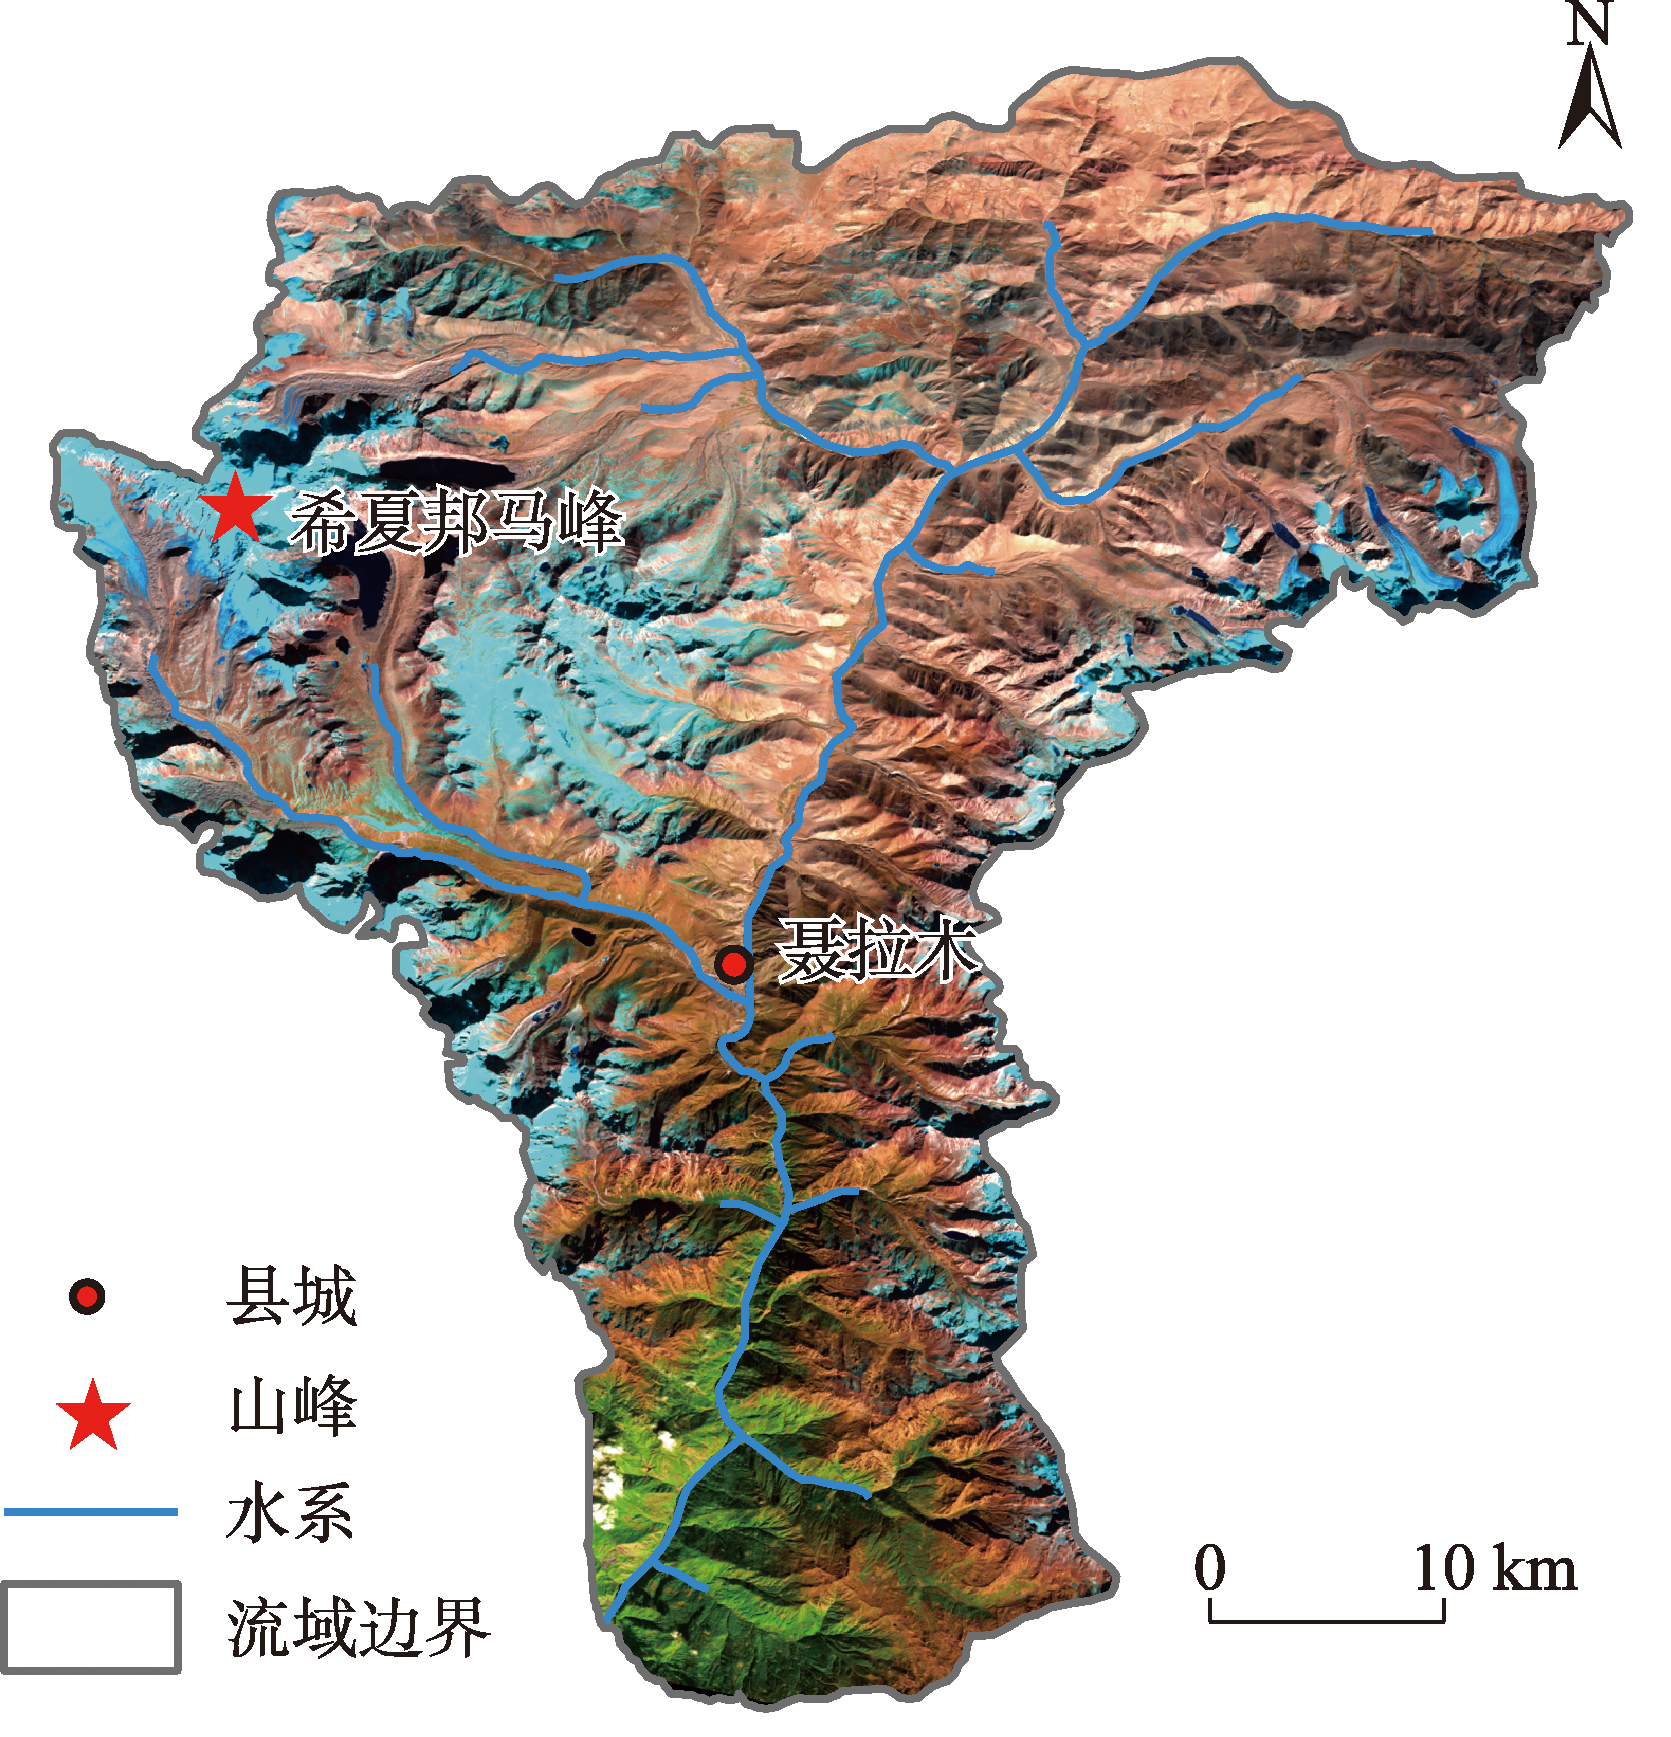
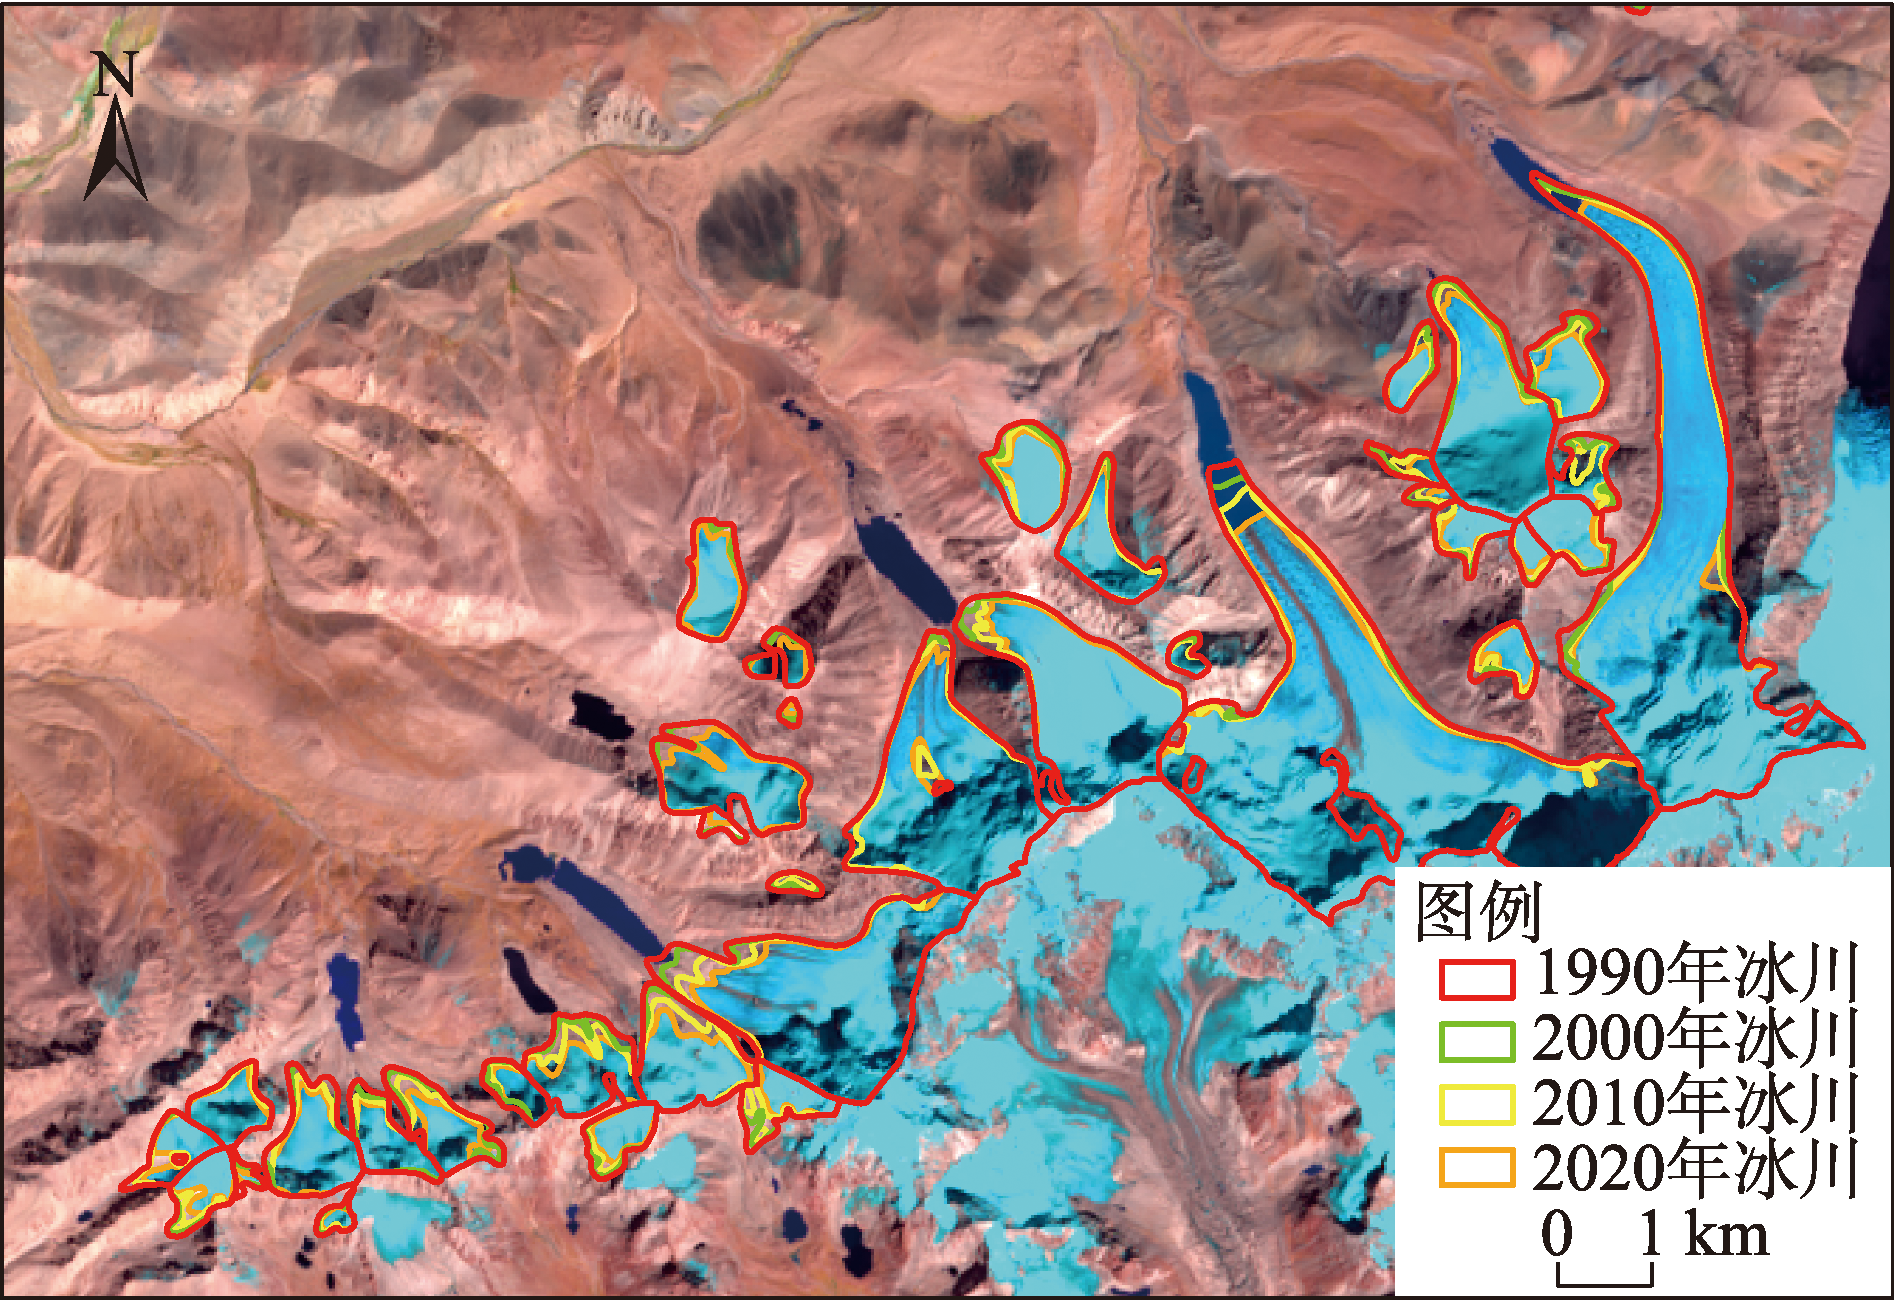
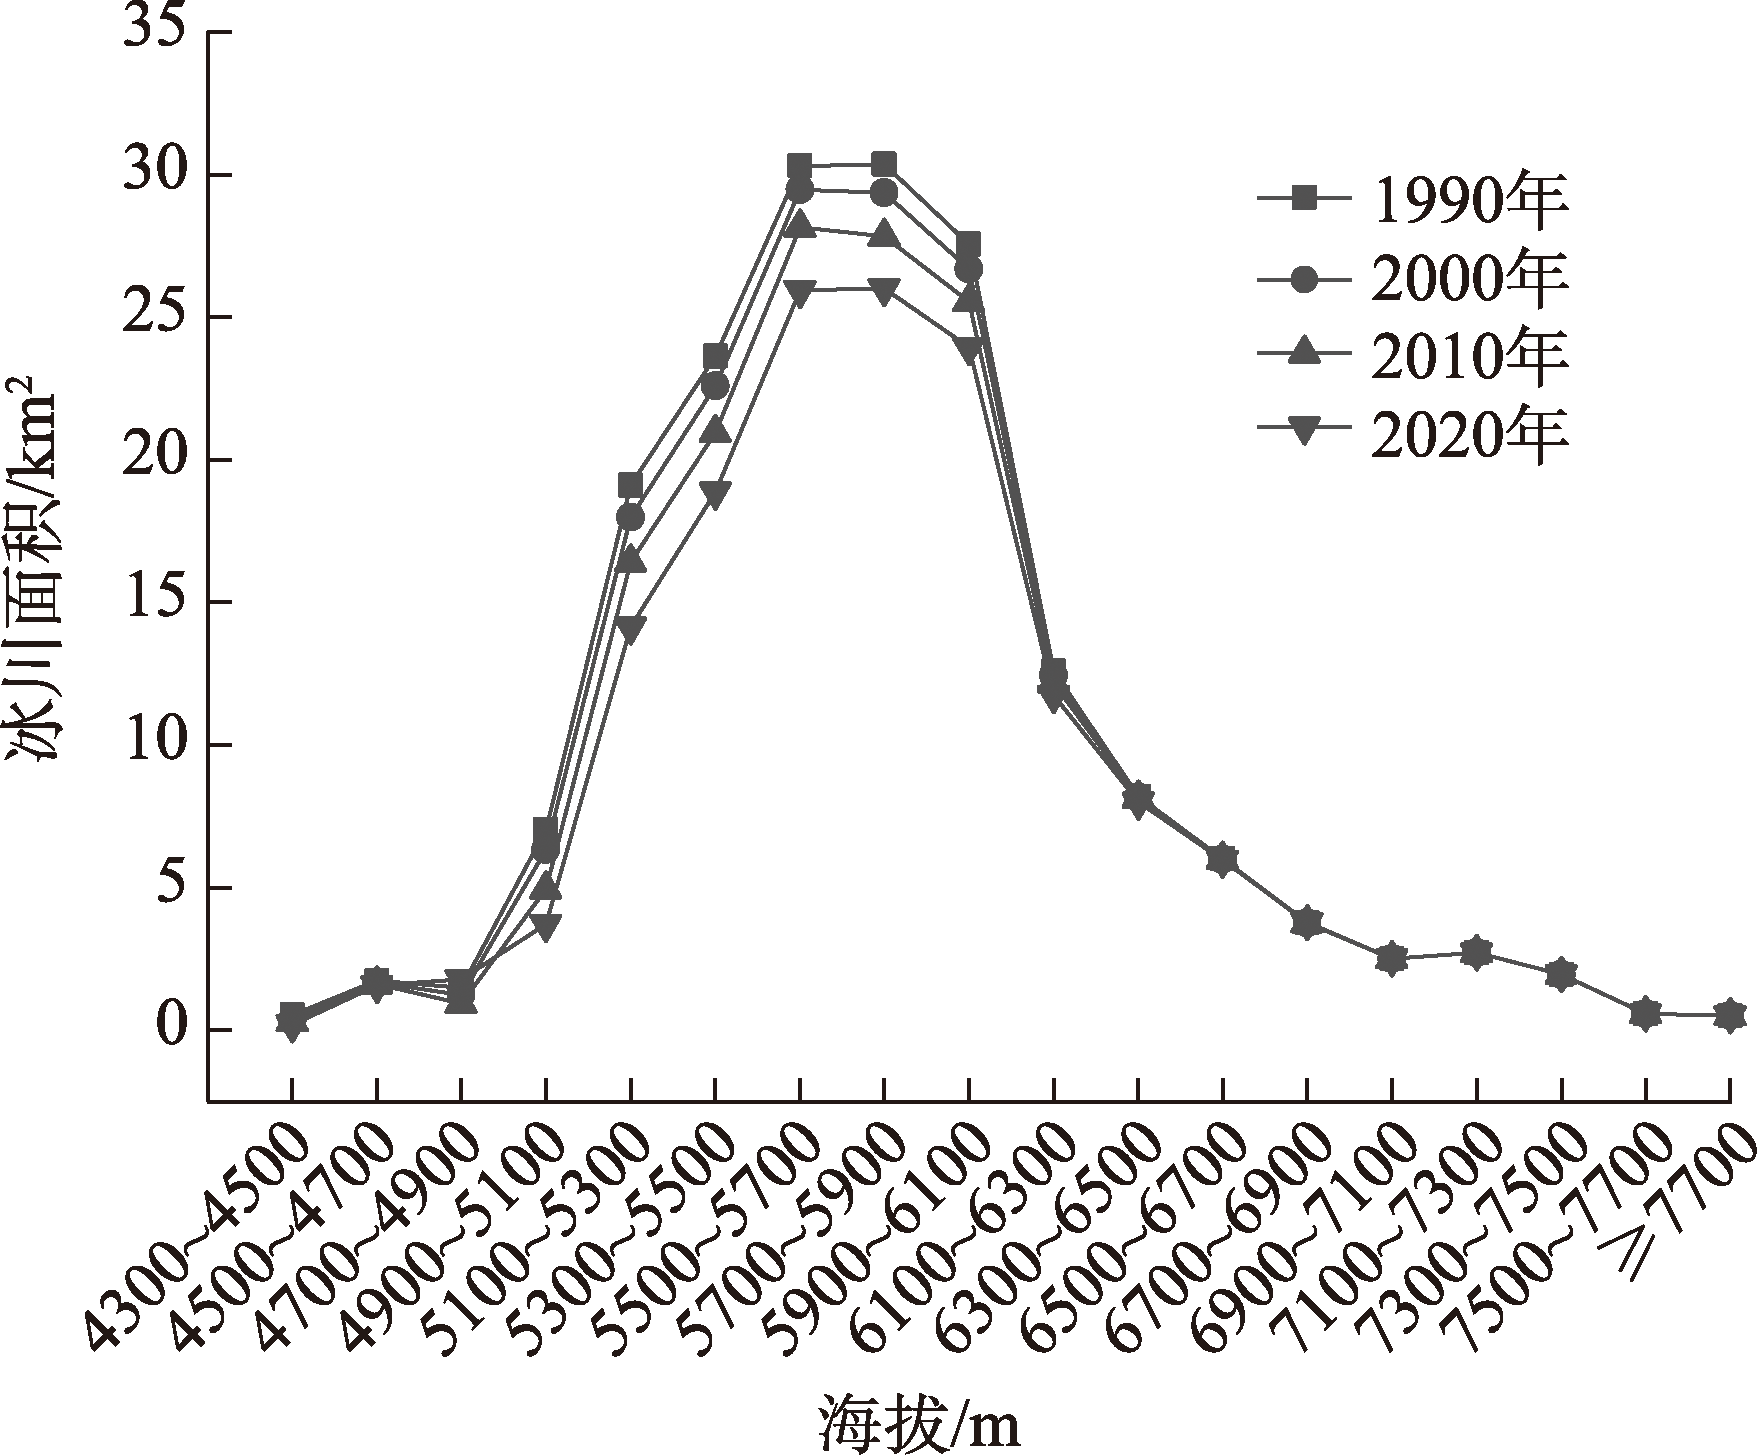
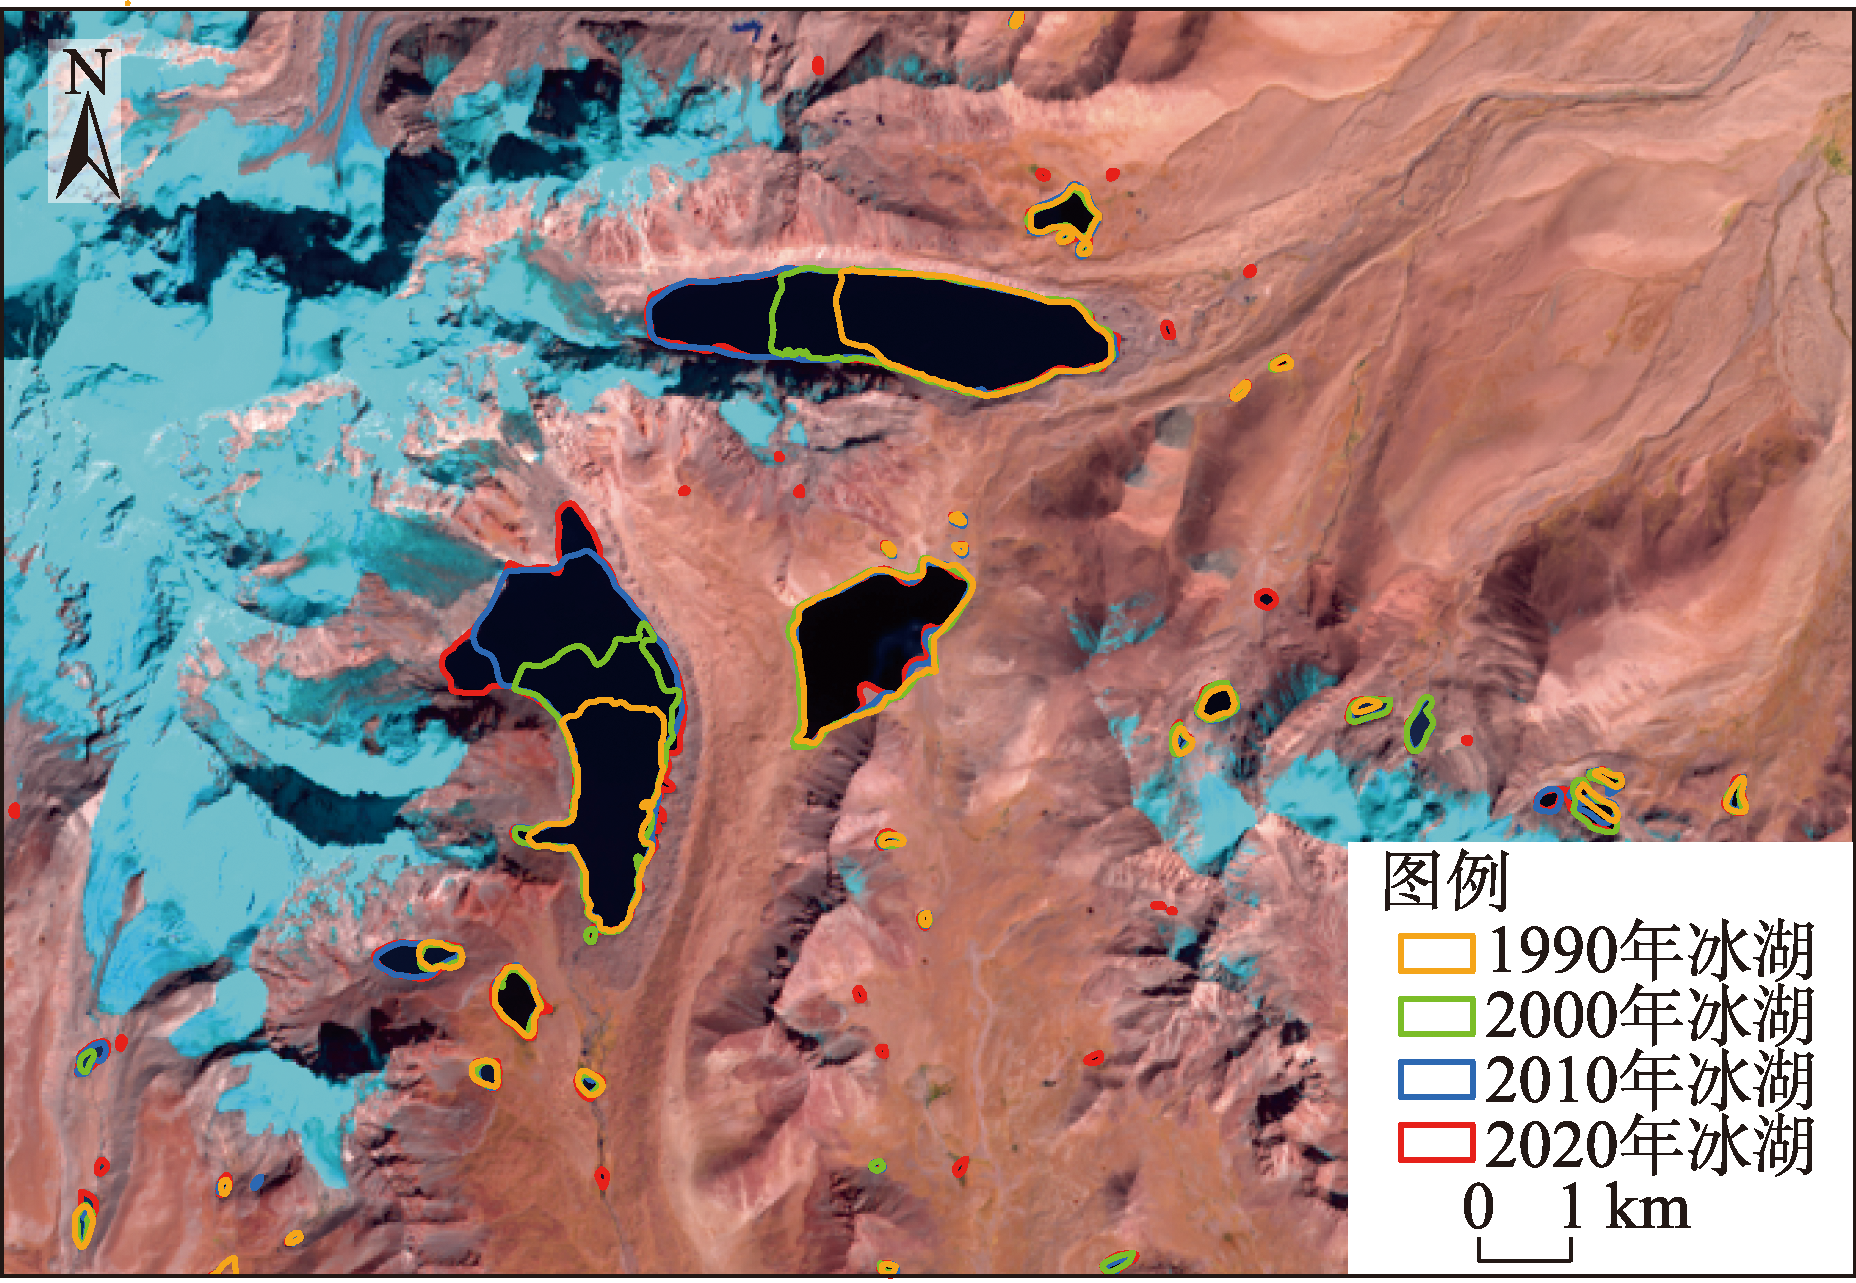
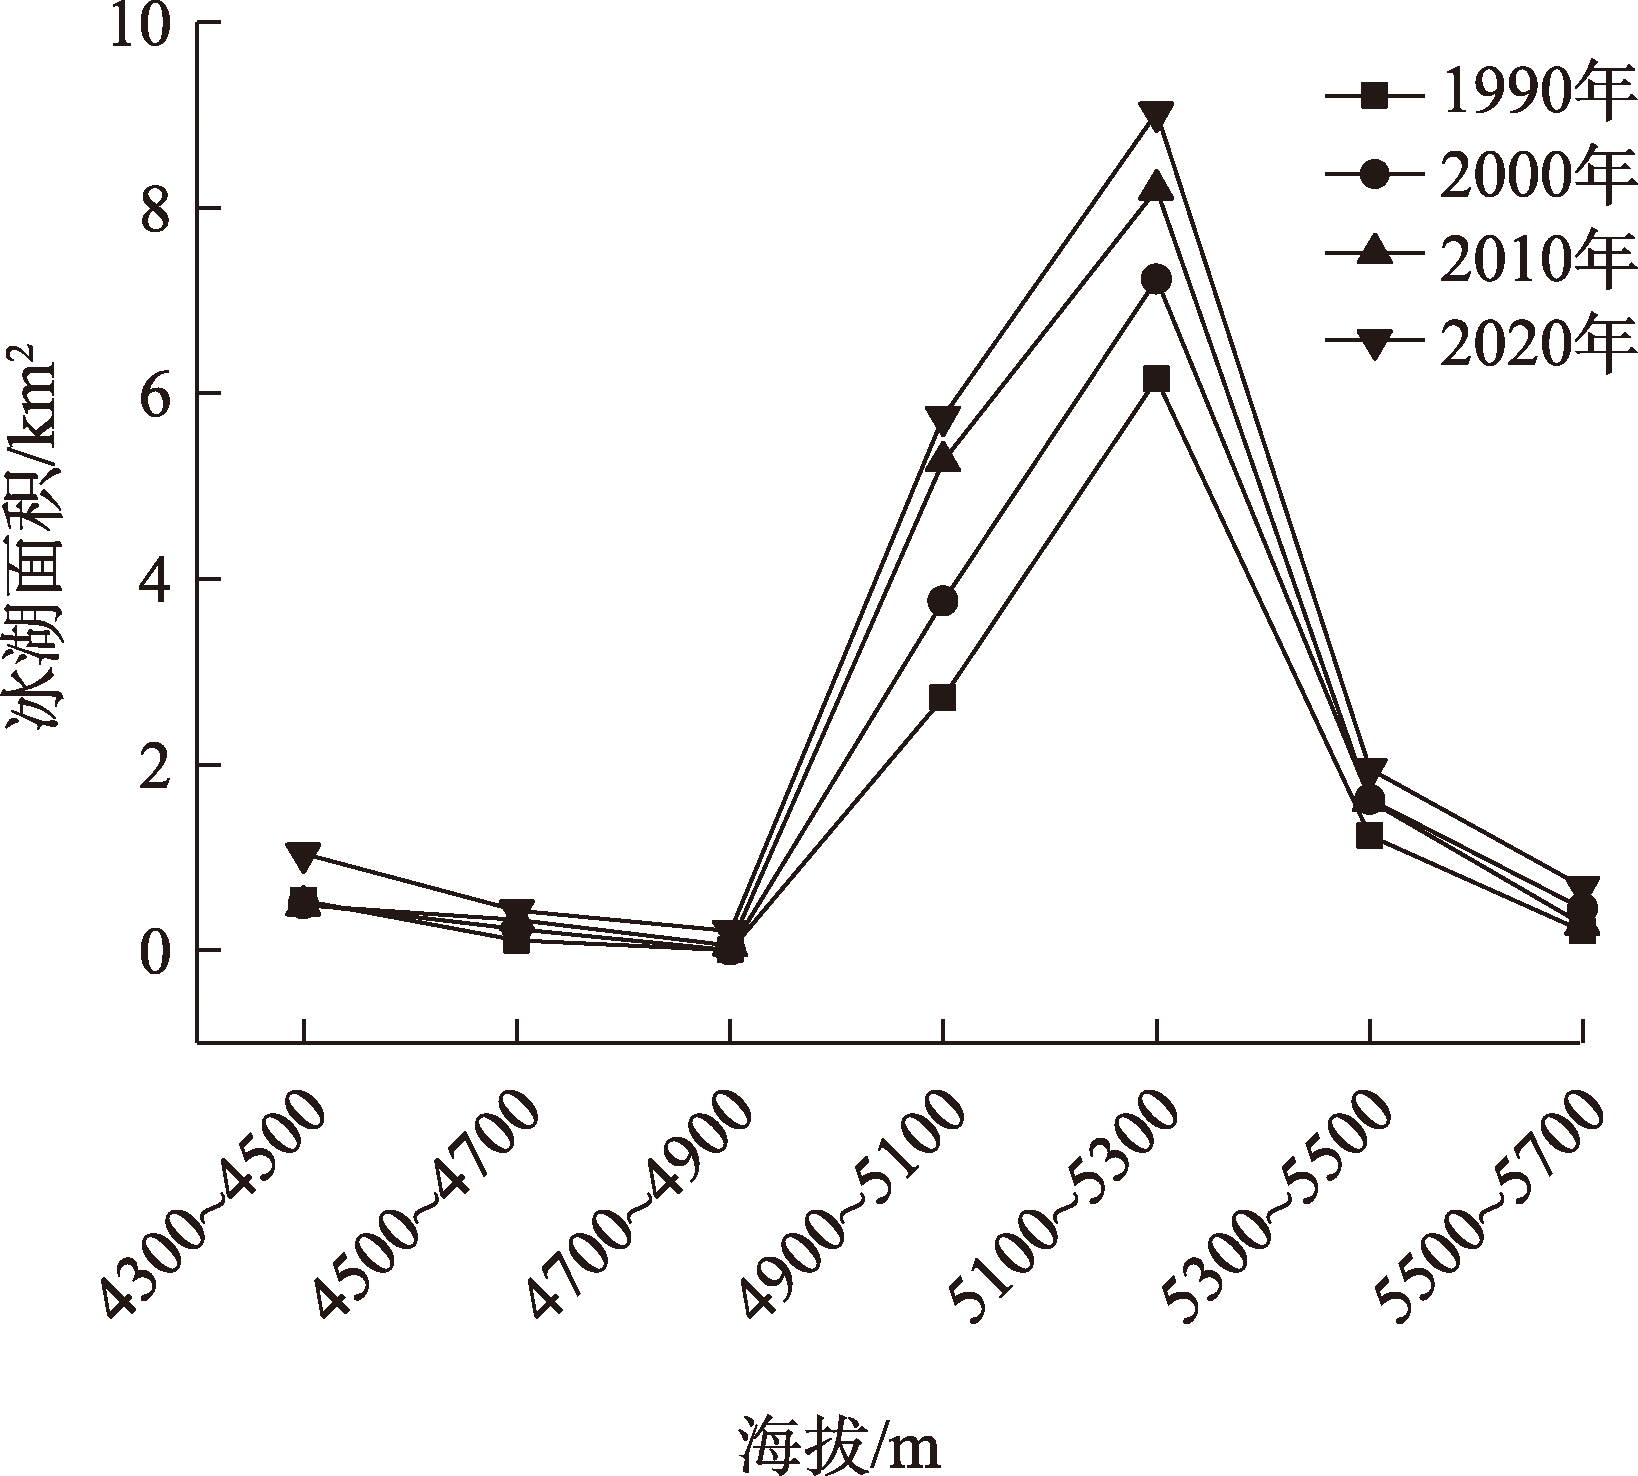
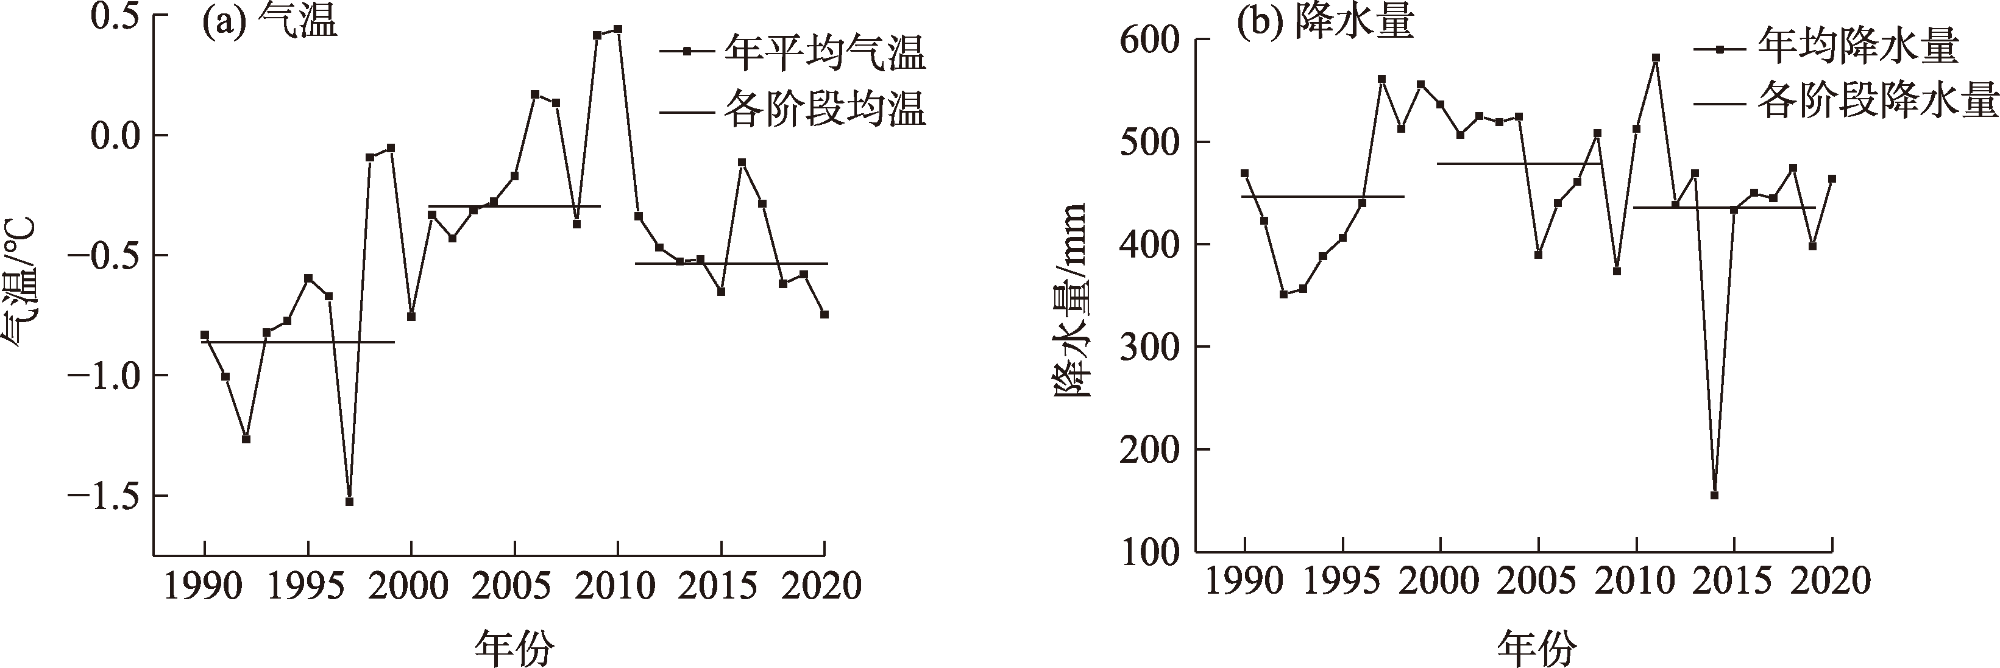
Utilizing Landsat TM/ETM+/OLI imagery and digital elevation model (DEM) data, this study extracted the boundaries of glaciers and glacial lakes in Poiqu Basin, Xigaze City, Xizang Autonomous Region, China from 1990 to 2020 through the ratio threshold method and visual interpretation. The distribution and variation of glaciers and glacial lakes over three decades were analyzed, alongside the exploration of their co-evolution and response to climate change within the basin. The findings revealed: (1) A notable acceleration in glacier shrinkage within the Poiqu Basin over the last decade, with glaciers primarily situated between 5500 m and 6100 m. While the count of large-scale glaciers (≥10 km2) remained constant, small-scale glaciers (≤0.5 km2) exhibited an upward trend. (2) Both the number and area of glacial lakes witnessed a significant increase, with an expansion rate of 74.24%. Predominantly located between 4900 m and 5300 m, the expansion was more pronounced in larger glacial lakes (≥0.07 km2), whereas smaller lakes (≤0.03 km2) also saw a marked rise in numbers. (3) Glacial lakes connected to their parent glaciers emerged as the most significant type contributing to glacial lake expansion, registering a 72.08% increase. (4) The past 30 years have experienced a gradual temperature rise and a minor decline in precipitation. These climatic shifts, particularly the temperature increase and precipitation decrease, have been crucial in glacier retreat, while meltwater from glaciers has facilitated the expansion of glacial lakes. Through examining the distribution, changes, and interrelation of glaciers and glacial lakes in Poiqu Basin, this study aims to provide valuable data support for understanding glacier area dynamics and aiding in the prediction and mitigation of glacial lake outburst floods.
Key words: Poiqu Basin; glacier retreat; glacier lake expansion; climatic response
Xiaoli WANG , Lingxiang ZHOU , Xiudong WANG , Ying HE . Temporal and spatial changes of glaciers and glacier lakes and its response to climate change in Poiqu Basin during 1990—2020[J]. Arid Land Geography, 2024 , 47(5) : 810 -819 . DOI: 10.12118/j.issn.1000-6060.2023.519
表1 波曲流域冰川冰湖解译影像信息Tab. 1 Information of glaciers and glacier lakes images in Poiqu Basin |
| 传感器 | 行号/列号 | 分辨率/m | 云量/% |
|---|---|---|---|
| Landsat4-5/TM | 141/40 | 30 | 1.00 |
| Landsat7/ETM+ | 141/40 | 30 | 9.17 |
| Landsat4-5/TM | 141/40 | 30 | 13.81 |
| Landsat8/OLI | 141/40 | 30 | 4.28 |
| Landsat4-5/TM | 141/40 | 30 | 1.21 |
| Landsat7/ETM+ | 141/40 | 30 | 0.89 |
| Landsat7/ETM+ | 141/40 | 30 | 28.89 |
| Landsat8/OLI | 141/40 | 30 | 4.28 |
表2 1990—2020年波曲流域冰川分布面积及变化特征Tab. 2 Distribution area and variation characteristics of glaciers in Poiqu Basin during 1990—2020 |
| 年份 | 面积/km2 | 退缩量/km2 | 面积变化/% | 年均面积变化率/%·a-1 |
|---|---|---|---|---|
| 1990 | 198.95±14.58 | - | - | - |
| 2000 | 192.13±14.50 | -6.82±0.08 | -3.43±0.04 | -0.34±0.004 |
| 2010 | 181.89±14.27 | -10.24±0.23 | -5.33±0.11 | -0.53±0.011 |
| 2020 | 168.28±13.72 | -13.61±0.55 | -7.48±0.30 | -0.75±0.030 |
表3 1990—2020年波曲流域不同规模冰川条数与面积统计Tab. 3 Statistics on the number and area of glaciers of different sizes in Poiqu Basin during 1990—2020 |
| 冰川规模/km2 | 1990年 | 2000年 | 2010年 | 2020年 | |||||||
|---|---|---|---|---|---|---|---|---|---|---|---|
| 冰川条数 | 冰川面积/km2 | 冰川条数 | 冰川面积/km2 | 冰川条数 | 冰川面积/km2 | 冰川条数 | 冰川面积/km2 | ||||
| ≤0.1 | 24 | 1.65 | 27 | 1.75 | 34 | 2.06 | 56 | 2.67 | |||
| 0.1~0.5 | 69 | 18.34 | 71 | 18.37 | 69 | 16.31 | 65 | 15.81 | |||
| 0.5~1 | 28 | 19.76 | 26 | 18.43 | 26 | 17.33 | 21 | 14.26 | |||
| 1~2 | 11 | 24.71 | 16 | 22.65 | 16 | 21.89 | 13 | 16.09 | |||
| 2~5 | 17 | 38.28 | 11 | 36.93 | 11 | 37.96 | 12 | 41.11 | |||
| 5~10 | 5 | 33.59 | 5 | 32.85 | 4 | 26.67 | 3 | 20.69 | |||
| 10~20 | 1 | 15.34 | 1 | 14.88 | 1 | 14.06 | 1 | 13.22 | |||
| ≥20 | 2 | 47.28 | 2 | 46.28 | 2 | 45.61 | 2 | 44.44 | |||
| 总计 | 157 | 198.96 | 159 | 192.14 | 163 | 181.89 | 173 | 168.28 | |||
表4 1990—2020年波曲流域冰湖分布面积及变化特征Tab. 4 Distribution area and variation characteristics of glacier lakes in Poiqu Basin during 1990—2020 |
| 年份 | 面积/km2 | 变化量/km2 | 面积变化/% | 年均面积变化率/%·a-1 |
|---|---|---|---|---|
| 1990 | 11.17±2.79 | - | - | - |
| 2000 | 14.12±3.43 | 2.95±0.64 | 26.43±5.72 | 2.64±0.57 |
| 2010 | 16.57±3.79 | 2.45±0.36 | 17.38±2.54 | 1.74±0.25 |
| 2020 | 19.46±4.95 | 2.89±1.16 | 17.41±7.00 | 1.74±0.70 |
表5 1990—2020年波曲流域不同规模冰湖条数与面积统计Tab. 5 Statistics on the number and area of glacier lakes of different sizes in Poiqu Basin during 1990—2020 |
| 冰湖规模/km2 | 1990年 | 2000年 | 2010年 | 2020年 | |||||||
|---|---|---|---|---|---|---|---|---|---|---|---|
| 冰湖条数 | 冰湖面积/km2 | 冰湖条数 | 冰湖面积/km2 | 冰湖条数 | 冰湖面积/km2 | 冰湖条数 | 冰湖面积/km2 | ||||
| ≤0.10 | 13 | 0.08 | 20 | 0.13 | 23 | 0.15 | 21 | 0.14 | |||
| 0.01~0.02 | 12 | 0.15 | 11 | 0.17 | 20 | 0.28 | 26 | 0.35 | |||
| 0.02~0.03 | 6 | 0.16 | 5 | 0.12 | 11 | 0.27 | 12 | 0.31 | |||
| 0.03~0.04 | 2 | 0.07 | 7 | 0.25 | 7 | 0.25 | 8 | 0.28 | |||
| 0.04~0.05 | 4 | 0.19 | 4 | 0.17 | 1 | 0.04 | 6 | 0.27 | |||
| 0.05~0.06 | 0 | 0.00 | 1 | 0.05 | 3 | 0.16 | 2 | 0.12 | |||
| 0.06~0.07 | 3 | 0.19 | 0 | 0.00 | 1 | 0.07 | 2 | 0.14 | |||
| 0.07~0.40 | 11 | 1.75 | 16 | 2.69 | 13 | 2.08 | 19 | 3.41 | |||
| ≥0.40 | 6 | 8.58 | 6 | 10.54 | 7 | 13.27 | 8 | 14.44 | |||
| 总计 | 57 | 11.17 | 70 | 14.12 | 86 | 16.57 | 104 | 19.46 | |||
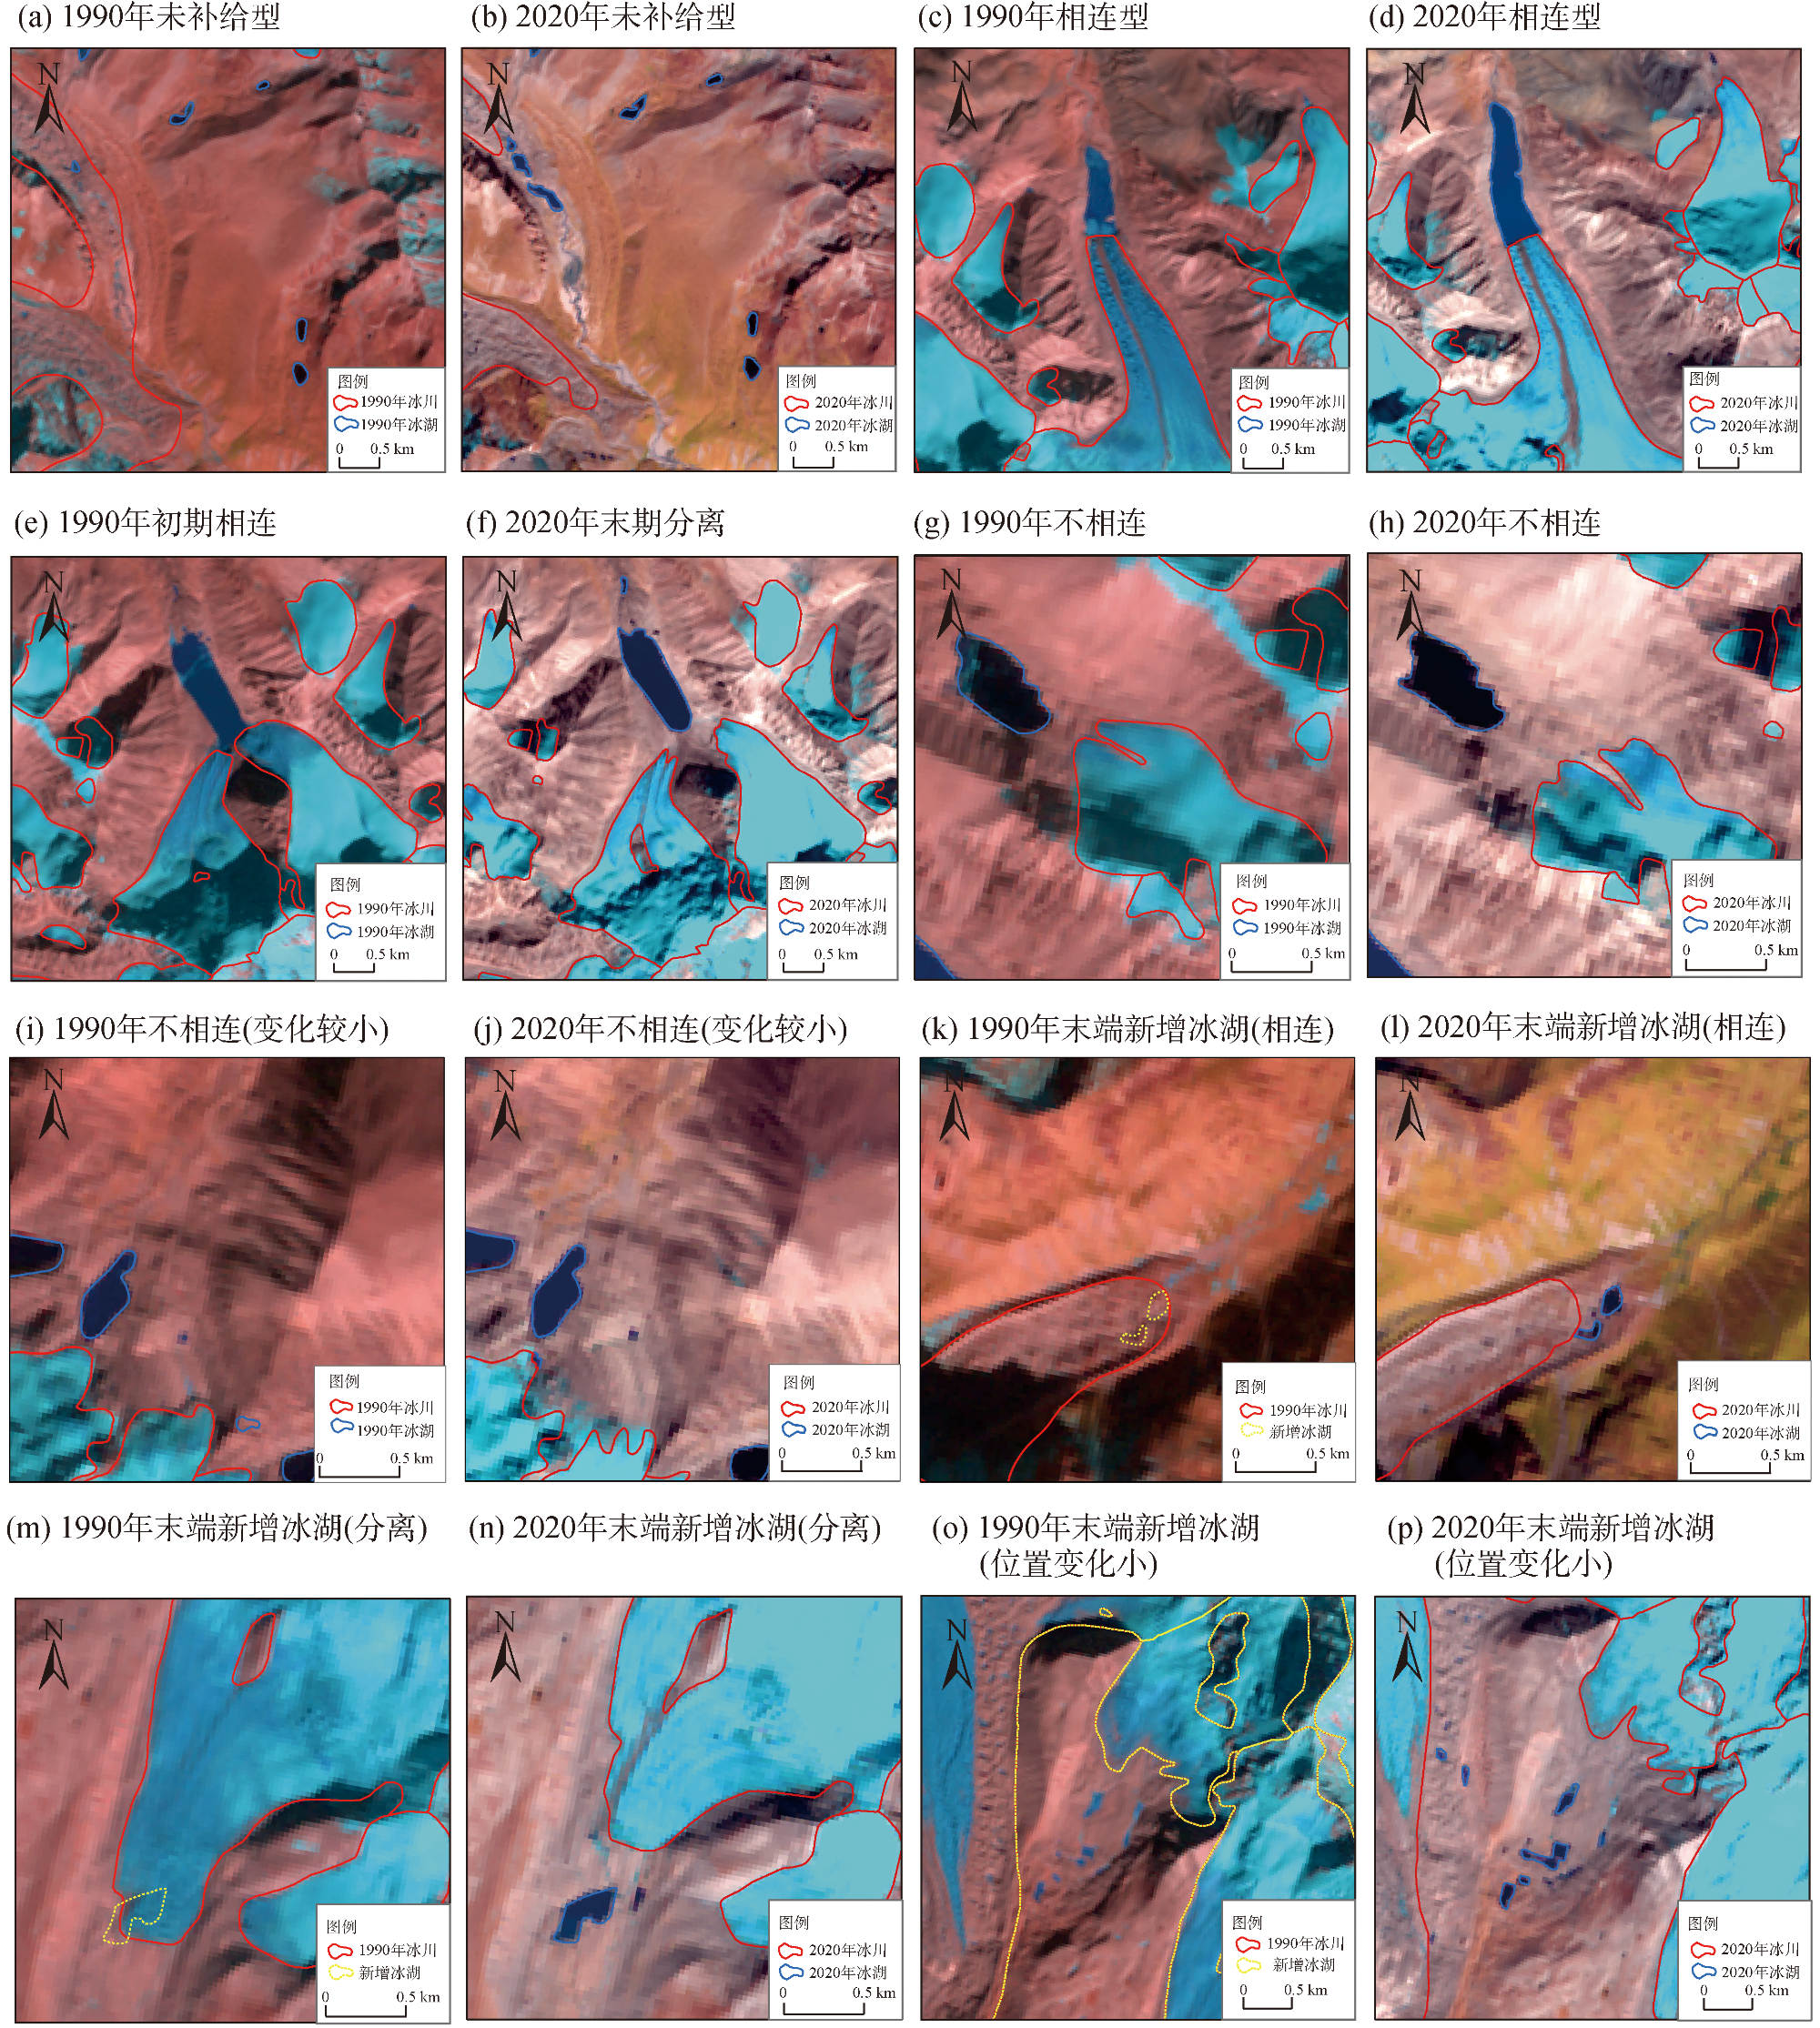
表6 1990—2020年波曲流域面积扩张冰湖的类型Tab. 6 Types of glacier lakes with expanding area in Poiqu Basin during 1990—2020 |
| 类型 | 名称 | 2020年 | 1990—2020年 | ||||||
|---|---|---|---|---|---|---|---|---|---|
| 冰湖 数量 | 冰湖数量 比例/% | 冰湖 面积/km2 | 湖-冰 距离/m | 母冰川 进退/m | 冰湖面积 增量/km2 | 冰湖面积 增率/% | |||
| a | 未补给型 | 47 | 45.19 | 4.75 | - | - | 3.54 | 293.20 | |
| b | 相连型 | 4 | 3.86 | 10.67 | - | -729.25 | 5.47 | 105.16 | |
| c | 初期相连,末期分离 | 6 | 5.77 | 0.75 | 1417.50 | -196.50 | 0.57 | 318.59 | |
| d | 不相连 | 21 | 20.19 | 1.62 | 680.24 | -184.57 | -2.27 | -58.33 | |
| e | 不相连(变化小) | 6 | 5.77 | 0.64 | 372.67 | -156.83 | 0.19 | 41.91 | |
| f | 末端新增冰湖(相连) | 1 | 0.96 | 0.49 | - | -255.00 | 0.47 | 1653.13 | |
| g | 末端新增冰湖(分离) | 16 | 15.38 | 0.39 | 289.94 | -160.06 | 0.26 | 204.05 | |
| h | 末端新增冰湖(位置变化小) | 3 | 2.88 | 0.15 | 249.67 | -62.67 | 0.15 | - | |
| 总计 | 104 | 100.00 | 19.47 | - | - | 8.38 | - | ||
| [1] |
|
| [2] |
|
| [3] |
|
| [4] |
张正勇, 何新林, 刘琳, 等. 中国天山冰川生态服务功能及价值评估[J]. 地理学报, 2018, 73(5): 856-867.
[
|
| [5] |
|
| [6] |
|
| [7] |
|
| [8] |
|
| [9] |
李林, 边巴次仁, 赵炜, 等. 西藏喜马拉雅山脉中段冰湖变化与溃决特征分析: 以桑旺错和什磨错为例[J]. 冰川冻土, 2019, 41(5): 1036-1043.
[
|
| [10] |
|
| [11] |
|
| [12] |
|
| [13] |
徐道明, 冯清华. 西藏喜马拉雅山区危险冰湖及其溃决特征[J]. 地理学报, 1989, 44(3): 343-351, 385-352.
[
|
| [14] |
李震, 陈宁生, 张建平, 等. 波曲流域冰湖及其溃决灾害链特征分析[J]. 水文地质工程地质, 2014, 41(4): 143-152.
[
|
| [15] |
陈晓清, 崔鹏, 杨忠, 等. 近15 a喜玛拉雅山中段波曲流域冰川和冰湖变化[J]. 冰川冻土, 2005(6): 793-800.
[
|
| [16] |
|
| [17] |
|
| [18] |
|
| [19] |
|
| [20] |
汤远航, 李梦琦, 邓铃, 等. 1990—2020年朋曲流域冰川变化及其对气候变化的响应[J]. 干旱区地理, 2022, 45(1): 27-36.
[
|
| [21] |
雷鹏嗣, 王伟财, 张太刚. 1990—2020年那曲地区冰湖变化研究[J]. 北京师范大学学报(自然科学版), 2022, 58(6): 936-943.
[
|
| [22] |
李海, 杨成生, 惠文华, 等. 基于遥感技术的高山极高山区冰川冰湖变化动态监测——以西藏藏南希夏邦玛峰地区为例[J]. 中国地质灾害与防治学报, 2021, 32(5): 10-17.
[
|
| [23] |
|
| [24] |
王康, 张廷军, 牟翠翠, 等. 从第三极到北极:气候与冰冻圈变化及其影响[J]. 冰川冻土, 2020, 42(1): 104-123.
[
|
| [25] |
王琼, 王欣, 雷东钰, 等. 山地冰川演化与冰湖发育相互作用机制[J]. 冰川冻土, 2022, 44(3): 1041-1052.
[
|
| [26] |
|
| [27] |
张伟华, 德吉央宗, 顿玉多吉, 等. 1995—2021年西藏萨普冰川-冰湖时空变化特征及气候响应分析[J]. 高原科学研究, 2023, 7(2): 10-20.
[
|
/
| 〈 |
|
〉 |