
Spatiotemporal variations of vegetation in the Ili River Basin from 2000 to 2022
Received date: 2023-09-10
Revised date: 2023-12-16
Online published: 2024-06-20
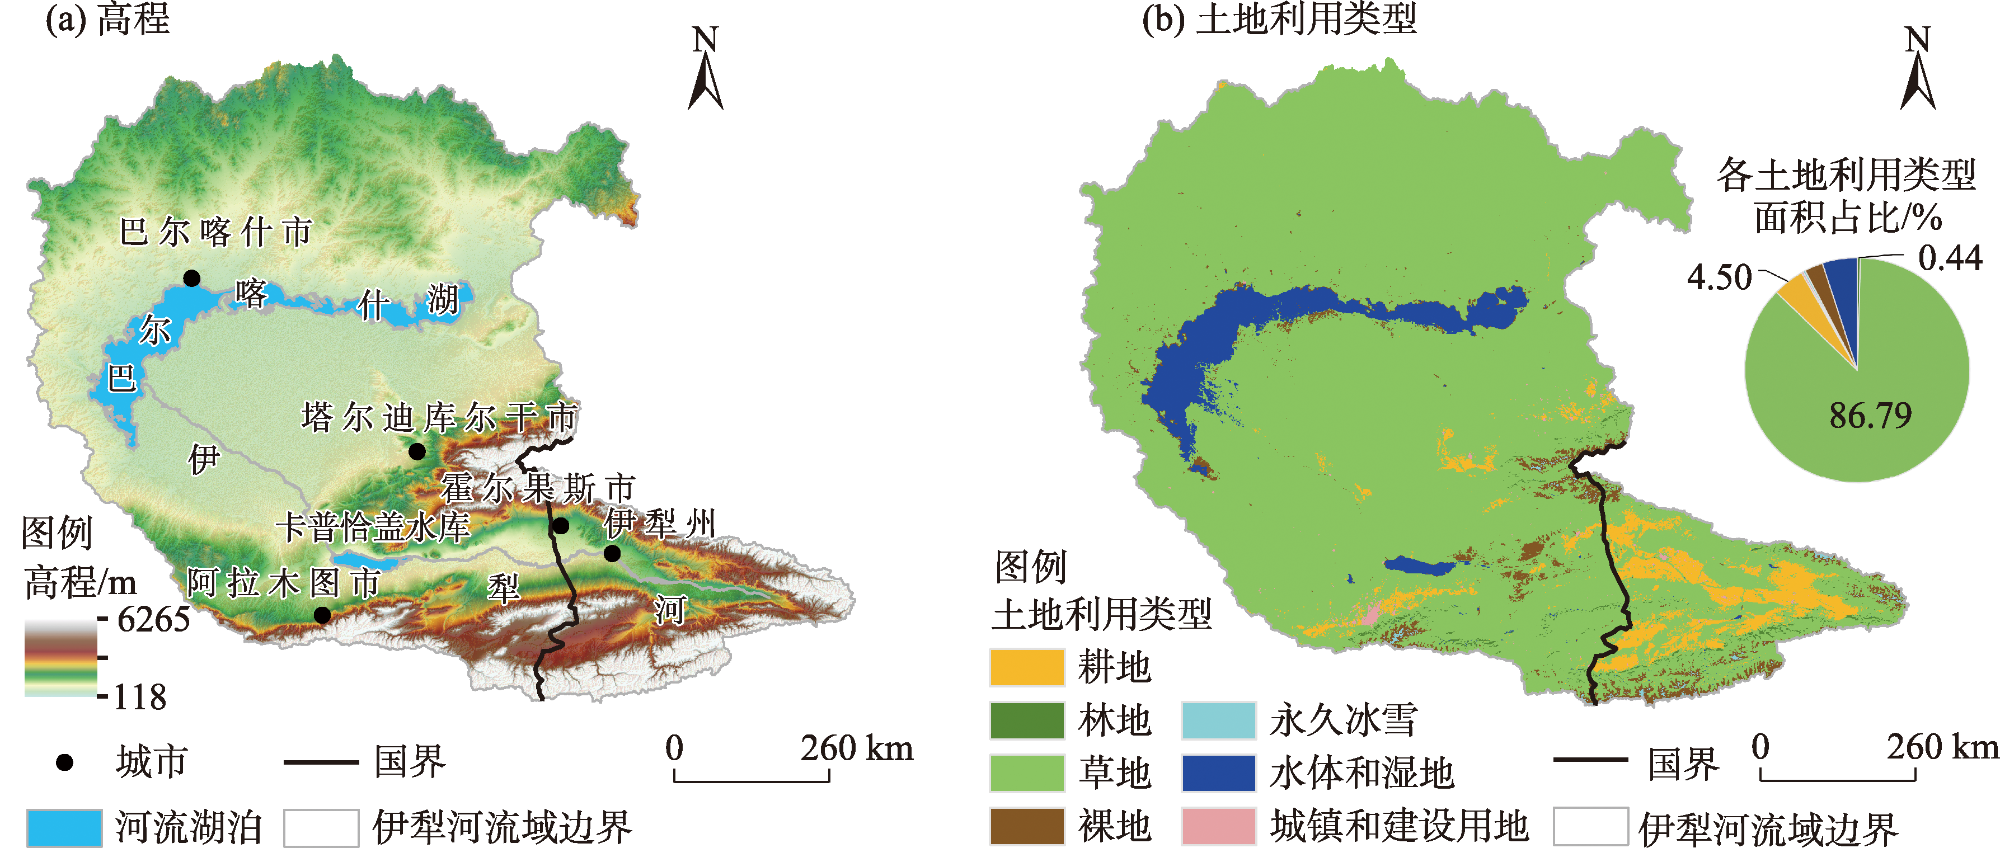
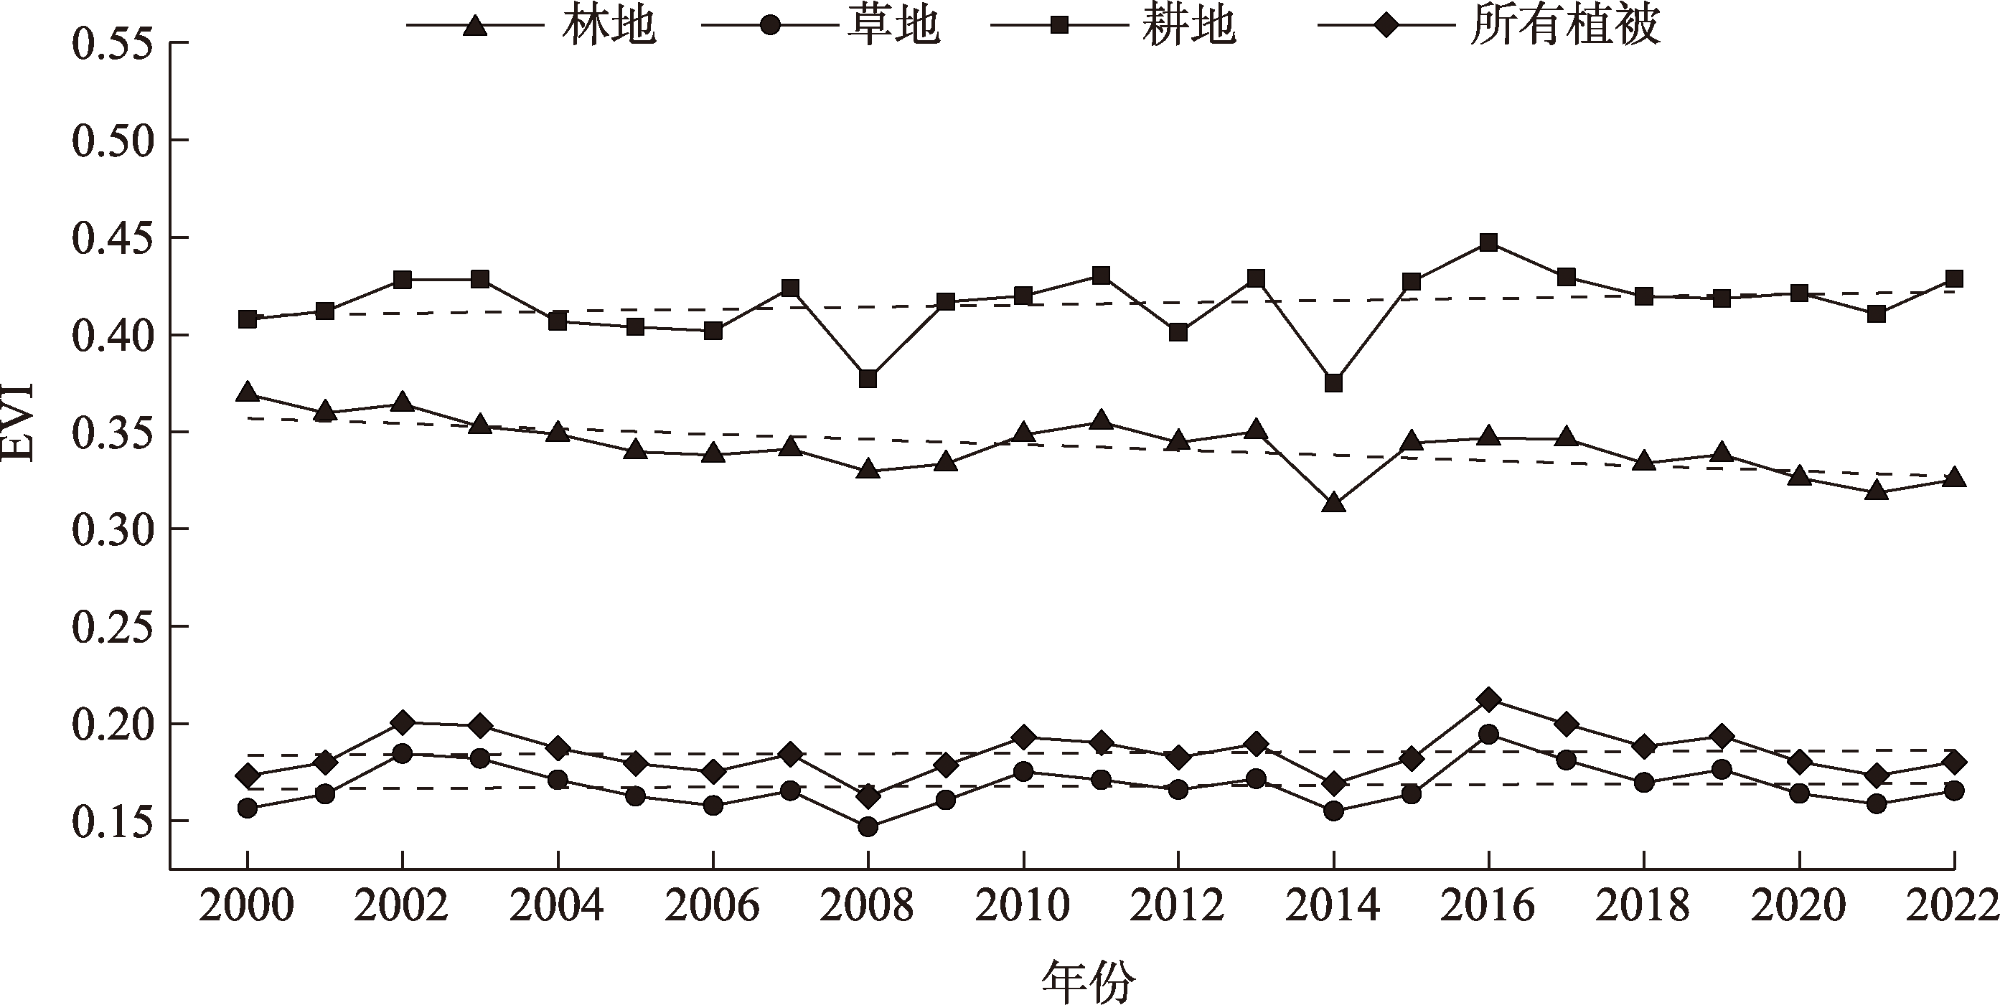
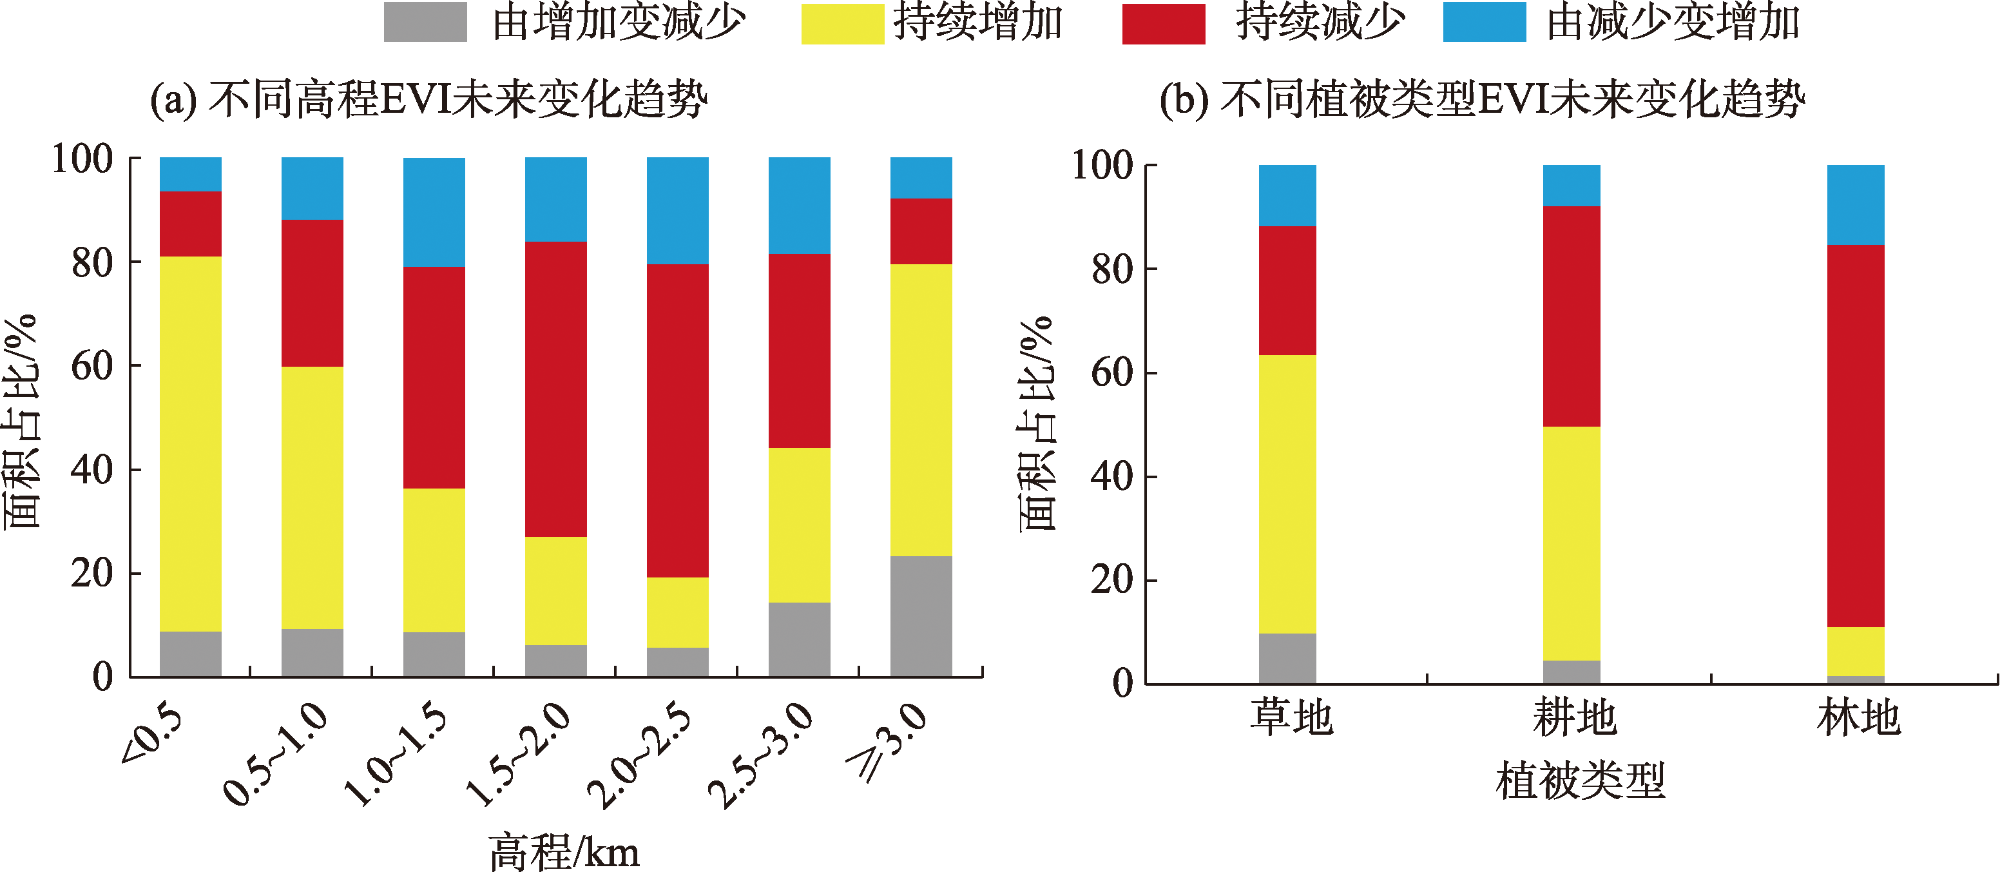
The Ili River Basin, spanning China and Kazakhstan, features a delicate ecological environment. Understanding the vegetation changes throughout the basin is essential for the region’s sustainable development. This study analyzed spatiotemporal vegetation variations in the Ili River Basin from 2000 to 2022, utilizing enhanced vegetation index data from MODIS. We examined vegetation change disparities within and outside China’s portion of the basin, among various vegetation types, and across different elevations. Our findings reveal: (1) Since 2000, vegetation conditions have generally improved across the Ili River Basin, notably in Kazakhstan, whereas a decline was observed within China. Degraded regions are predominantly at elevations between 1000 m and 3000 m. Grasslands and croplands exhibited positive trends, in contrast to forests. (2) Over the past 20 years, the Ili River Basin experienced minor vegetation fluctuations, with more pronounced variations within China. Grasslands encountered higher fluctuations compared to croplands and forests, and the 2500 m to 3000 m elevation range showed relatively stable vegetation. (3) Future projections indicate a prevailing positive trend in vegetation across the Ili River Basin, with approximately 52% of the areas expected to see ongoing improvement. Grasslands are anticipated to have higher improvement ratios than croplands and forests. Regions below 1000 m and above 3000 m in elevation are likely to experience sustained positive changes. This study’s insights into vegetation dynamics will inform ecological protection strategies in the Ili River Basin.
Key words: MODIS EVI; change trend; sustainability; the Ili River Basin
Yaqian LI , Jianhua YANG , Haobin XIA , Jianjun WU . Spatiotemporal variations of vegetation in the Ili River Basin from 2000 to 2022[J]. Arid Land Geography, 2024 , 47(5) : 741 -752 . DOI: 10.12118/j.issn.1000-6060.2023.480
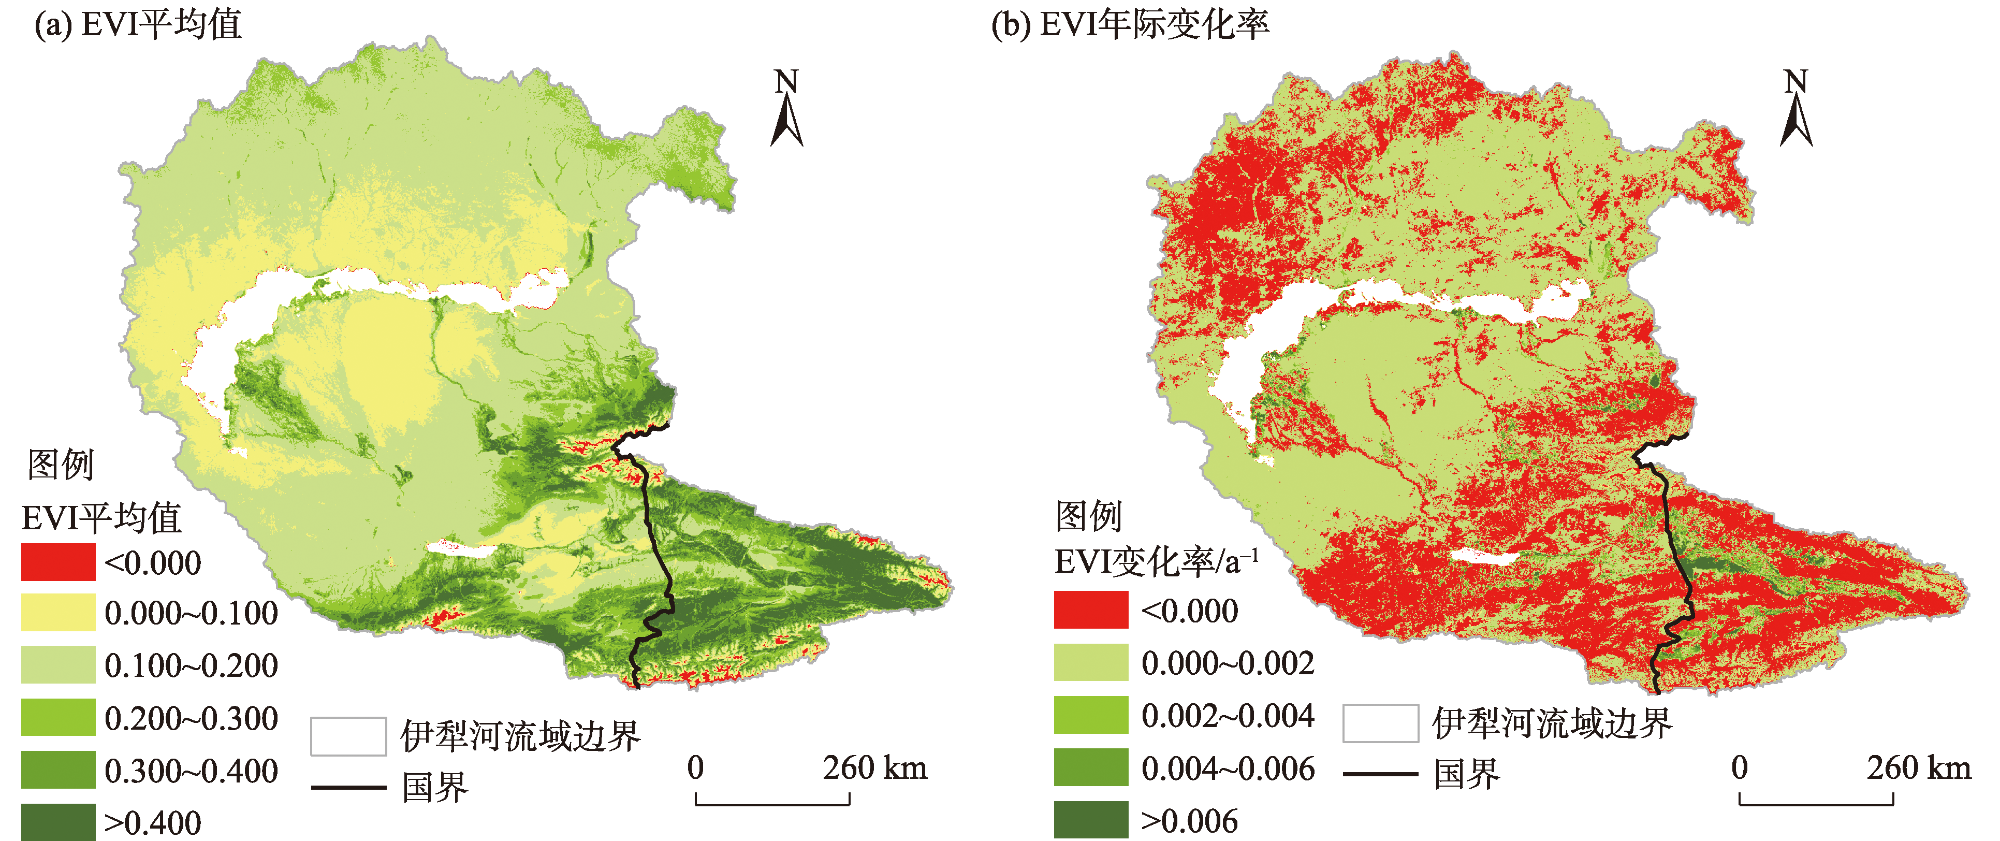
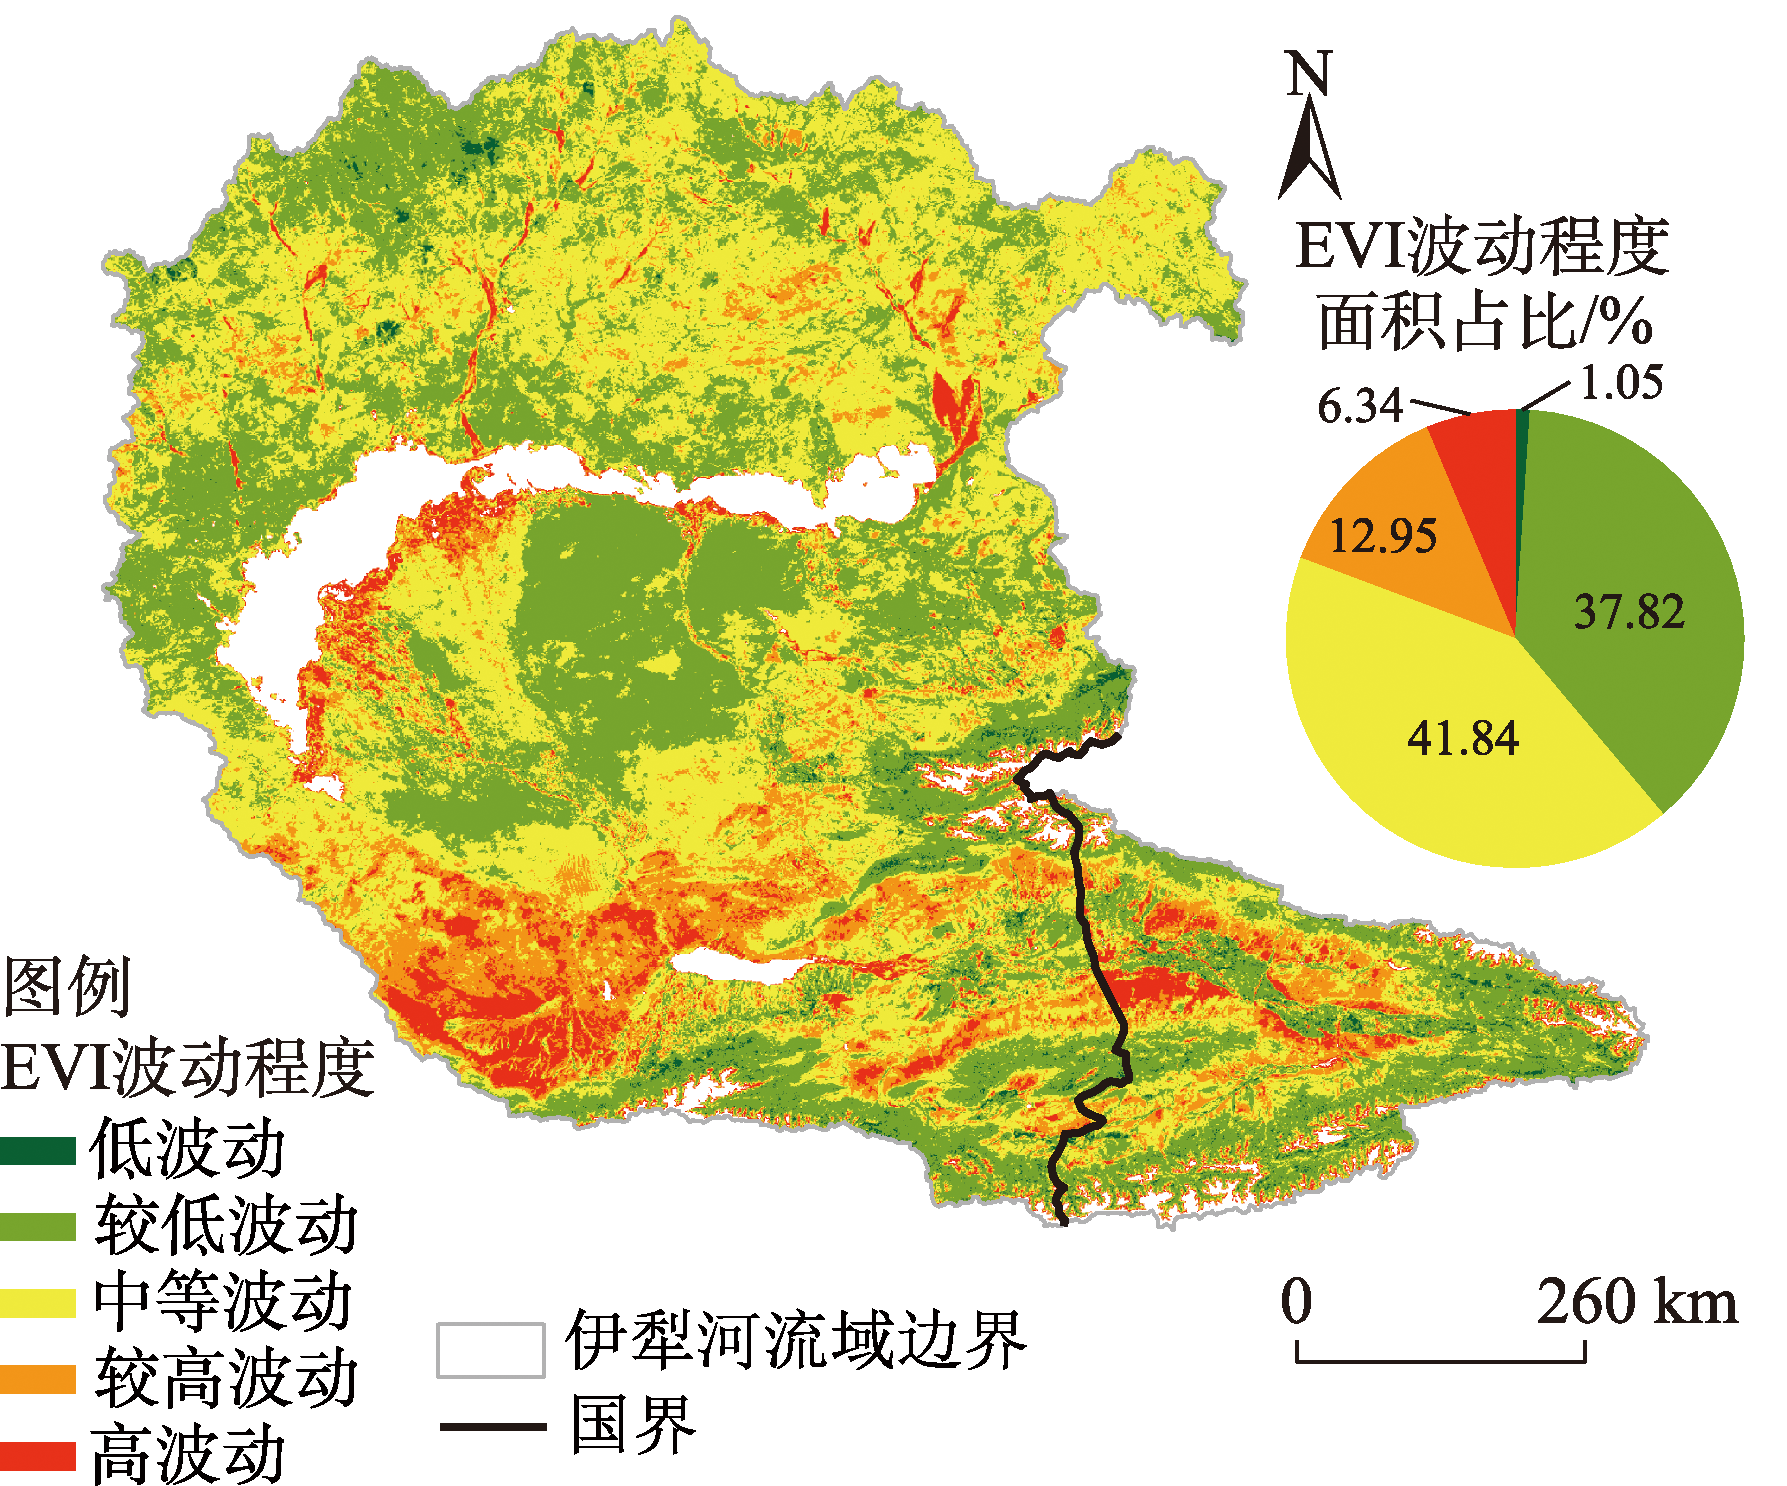
图2 伊犁河流域生长季增强型植被指数(EVI)平均值和年际变化率空间分布Fig. 2 Spatial distributions of mean values and interannual change rate of EVI during the growing seasons in the Ili River Basin |
表 1 中国境内外伊犁河流域生长季增强型植被指数(EVI)平均值面积占比Tab. 1 Area proportion of EVI mean values during the growing seasons in the Ili River Basin within and outside China |
| EVI平均值分级 | 境内面积占比/% | 境外面积占比/% |
|---|---|---|
| <0.000 | 3.43 | 0.59 |
| 0.000~0.100 | 7.46 | 24.21 |
| 0.100~0.200 | 12.13 | 53.90 |
| 0.200~0.300 | 17.06 | 11.43 |
| 0.300~0.400 | 28.26 | 6.88 |
| >0.400 | 31.66 | 2.99 |
表 2 中国境内外伊犁河流域生长季EVI年际变化率面积占比Tab. 2 Area proportion of interannual change rate of EVI during the growing seasons in the Ili River Basin within and outside China |
| EVI年际变化率/a-1 | 境内流域面积占比/% | 境外流域面积占比/% |
|---|---|---|
| <0.000 | 56.70 | 35.26 |
| 0.000~0.002 | 29.70 | 62.06 |
| 0.002~0.004 | 6.91 | 1.78 |
| 0.004~0.006 | 2.97 | 0.55 |
| >0.006 | 3.72 | 0.35 |
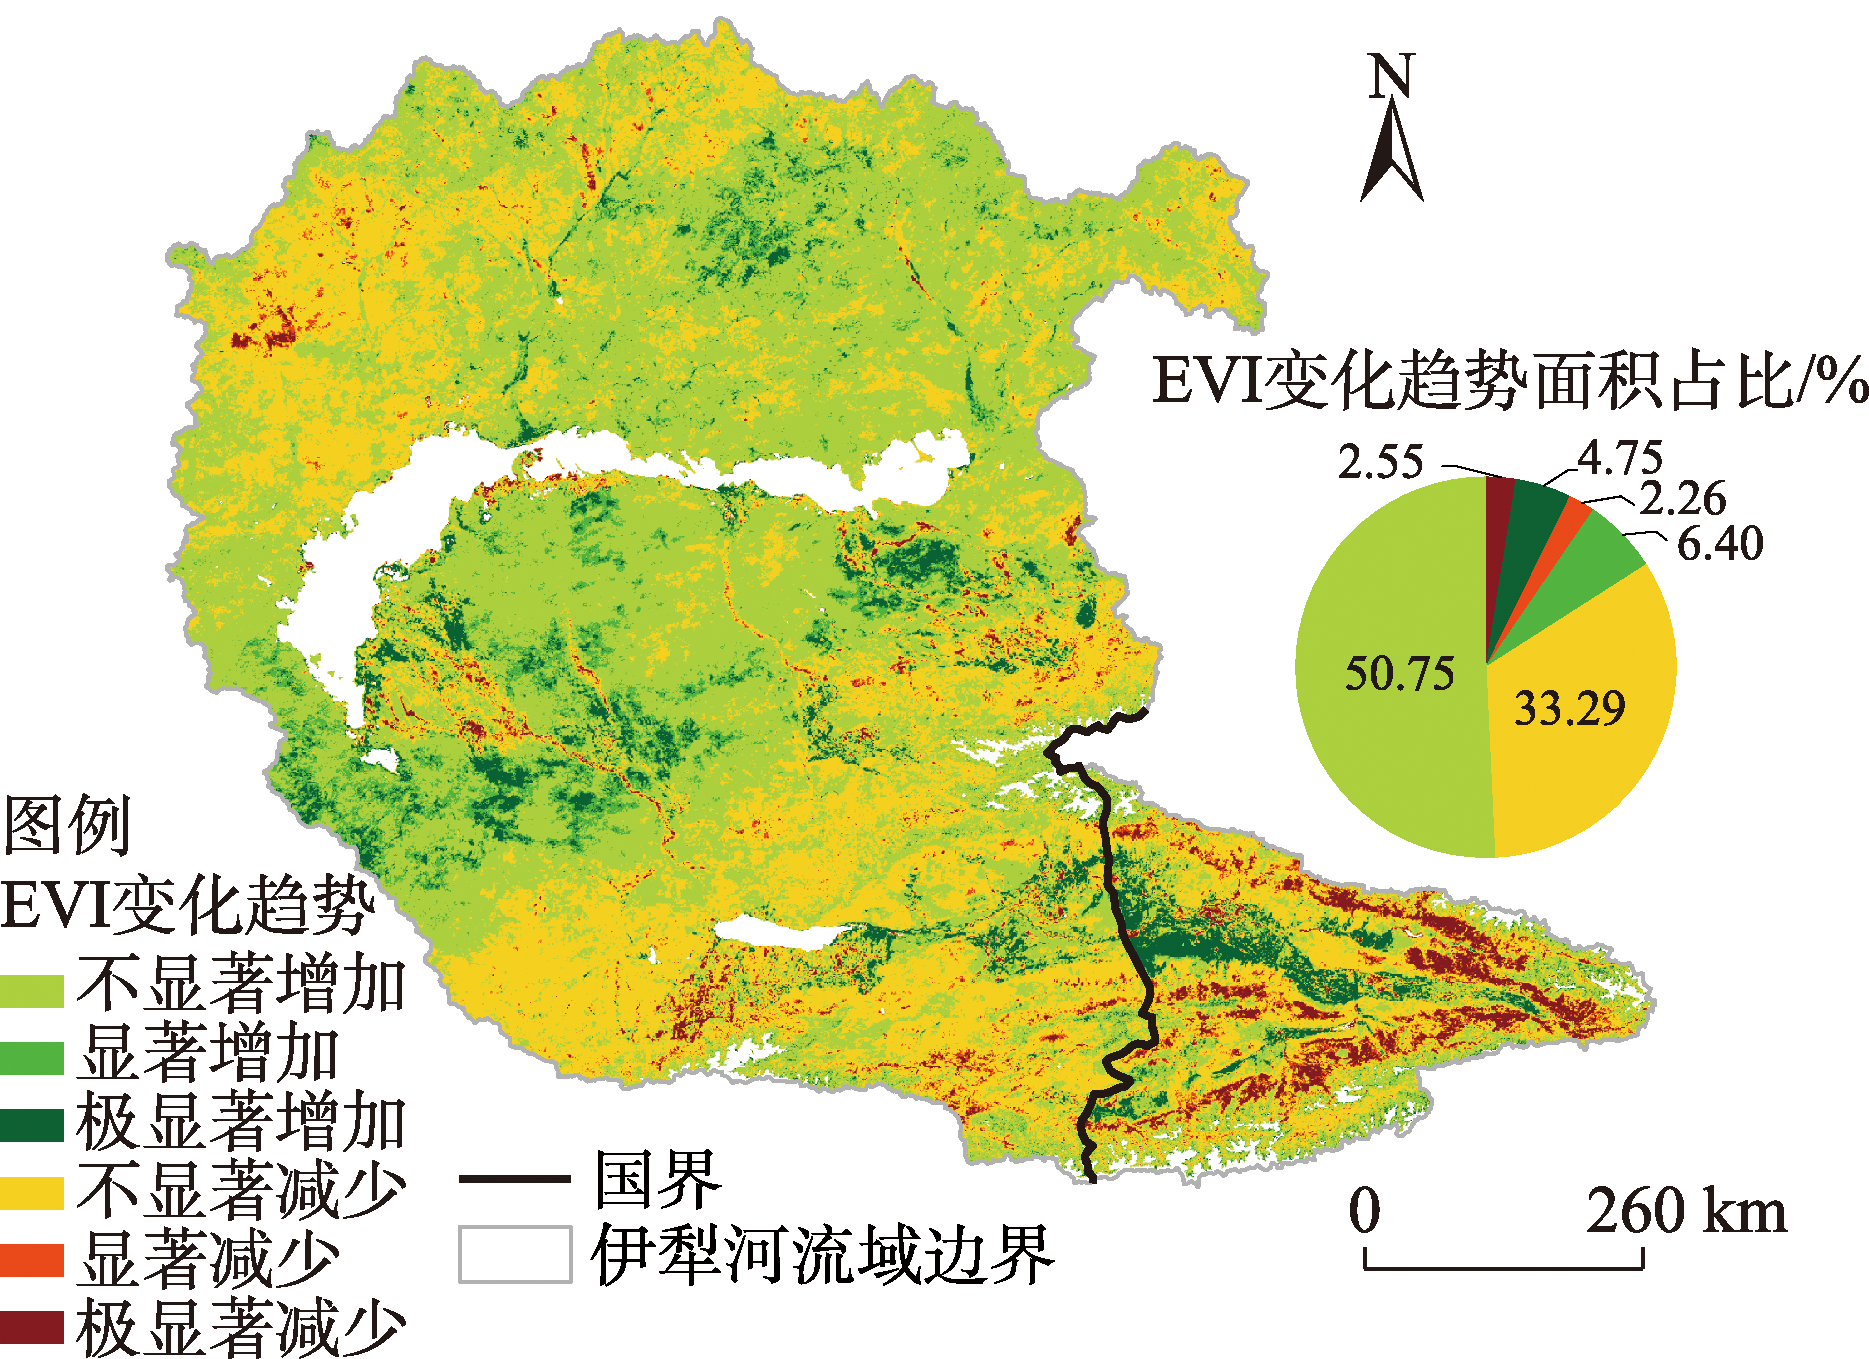
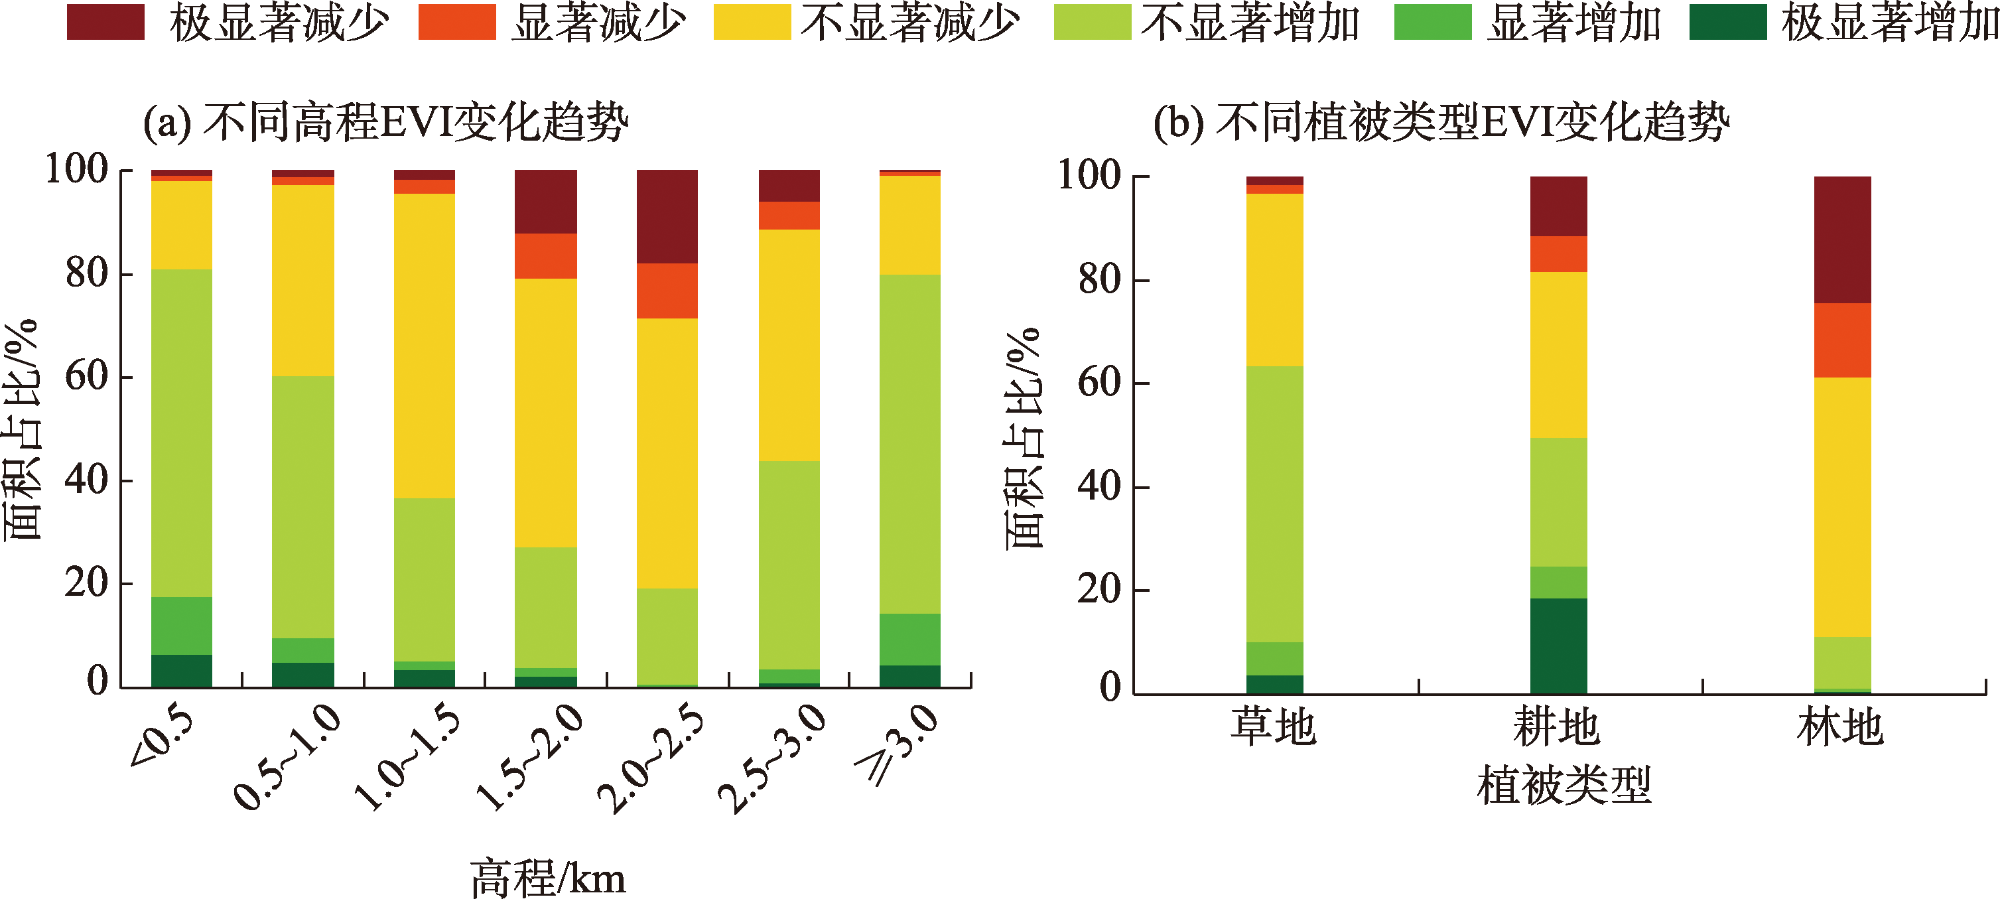
表3 中国境内外伊犁河流域生长季EVI变化趋势面积占比Tab. 3 Area proportion of EVI changing trend during the growing seasons in the Ili River Basin within and outside China |
| EVI变化趋势 | 境内面积占比/% | 境外面积占比/% |
|---|---|---|
| 极显著增加 | 10.96 | 3.80 |
| 显著增加 | 4.68 | 6.66 |
| 不显著增加 | 27.66 | 54.28 |
| 不显著减少 | 37.09 | 32.71 |
| 显著减少 | 7.28 | 1.49 |
| 极显著减少 | 12.33 | 1.06 |
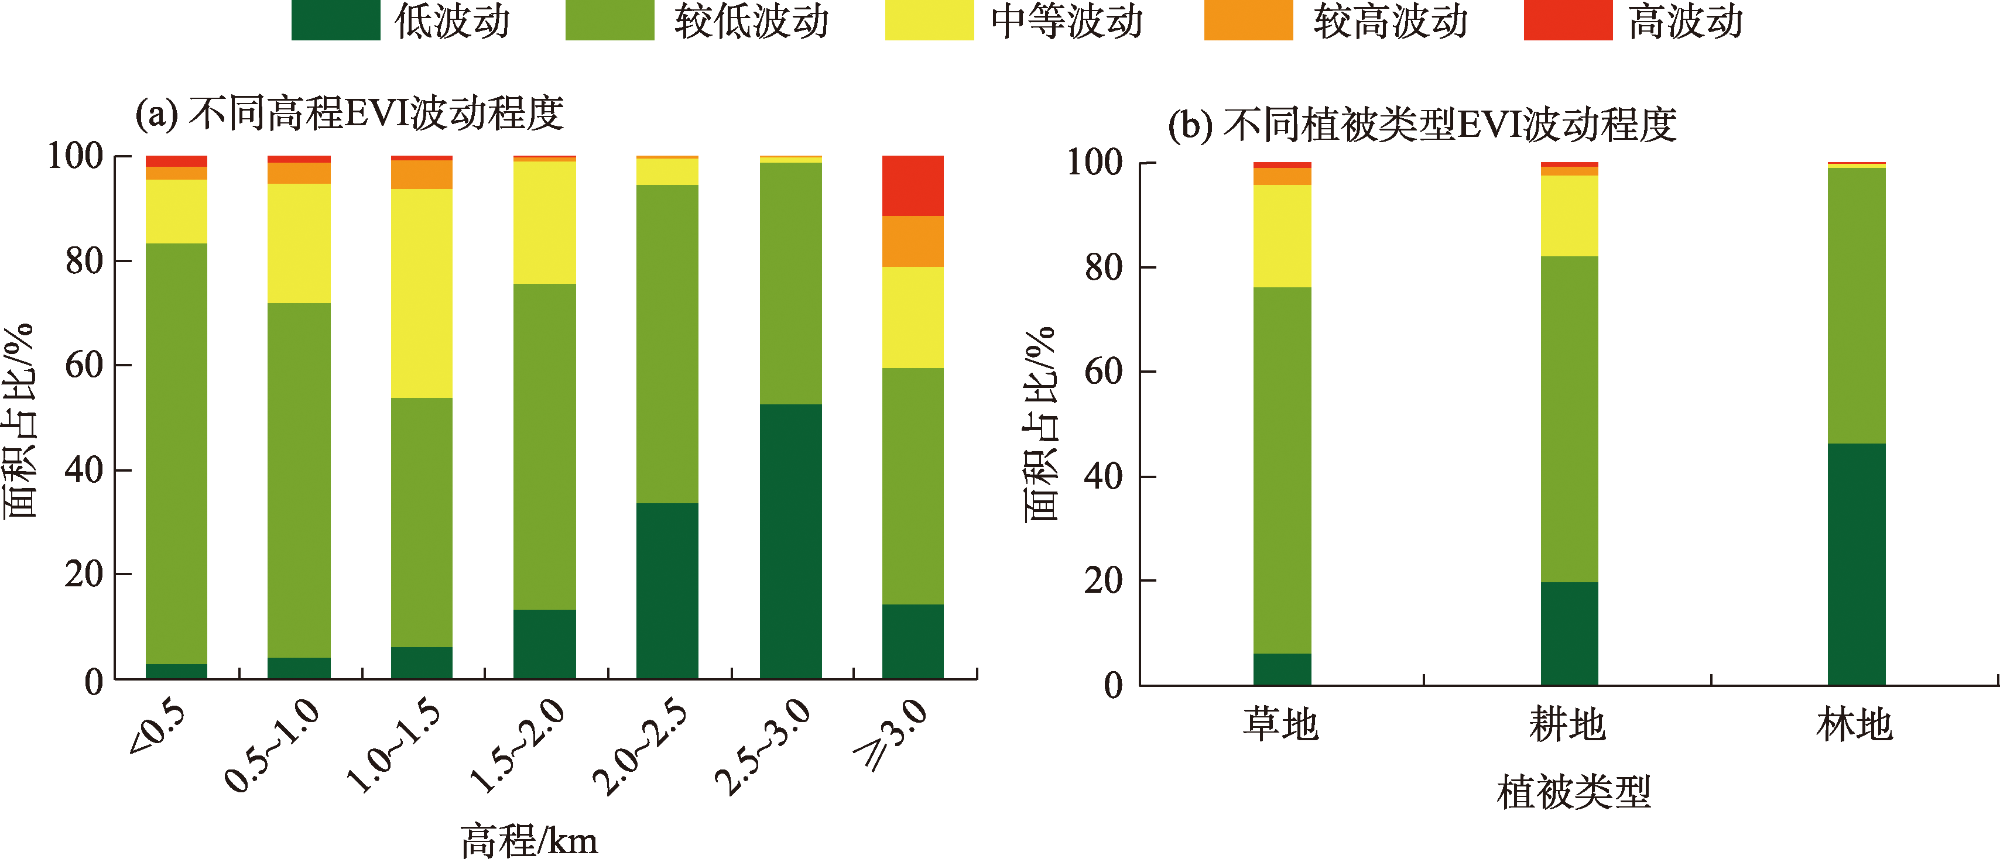
表 4 中国境内外伊犁河流域生长季EVI波动程度面积占比Tab. 4 Area proportion of EVI fluctuation during the growing seasons in the Ili River Basin within and outside China |
| EVI波动程度 | 境内面积占比/% | 境外面积占比/% |
|---|---|---|
| 低波动 | 20.02 | 5.85 |
| 较低波动 | 49.45 | 70.93 |
| 中等波动 | 21.50 | 18.75 |
| 较高波动 | 4.38 | 3.38 |
| 高波动 | 4.65 | 1.09 |
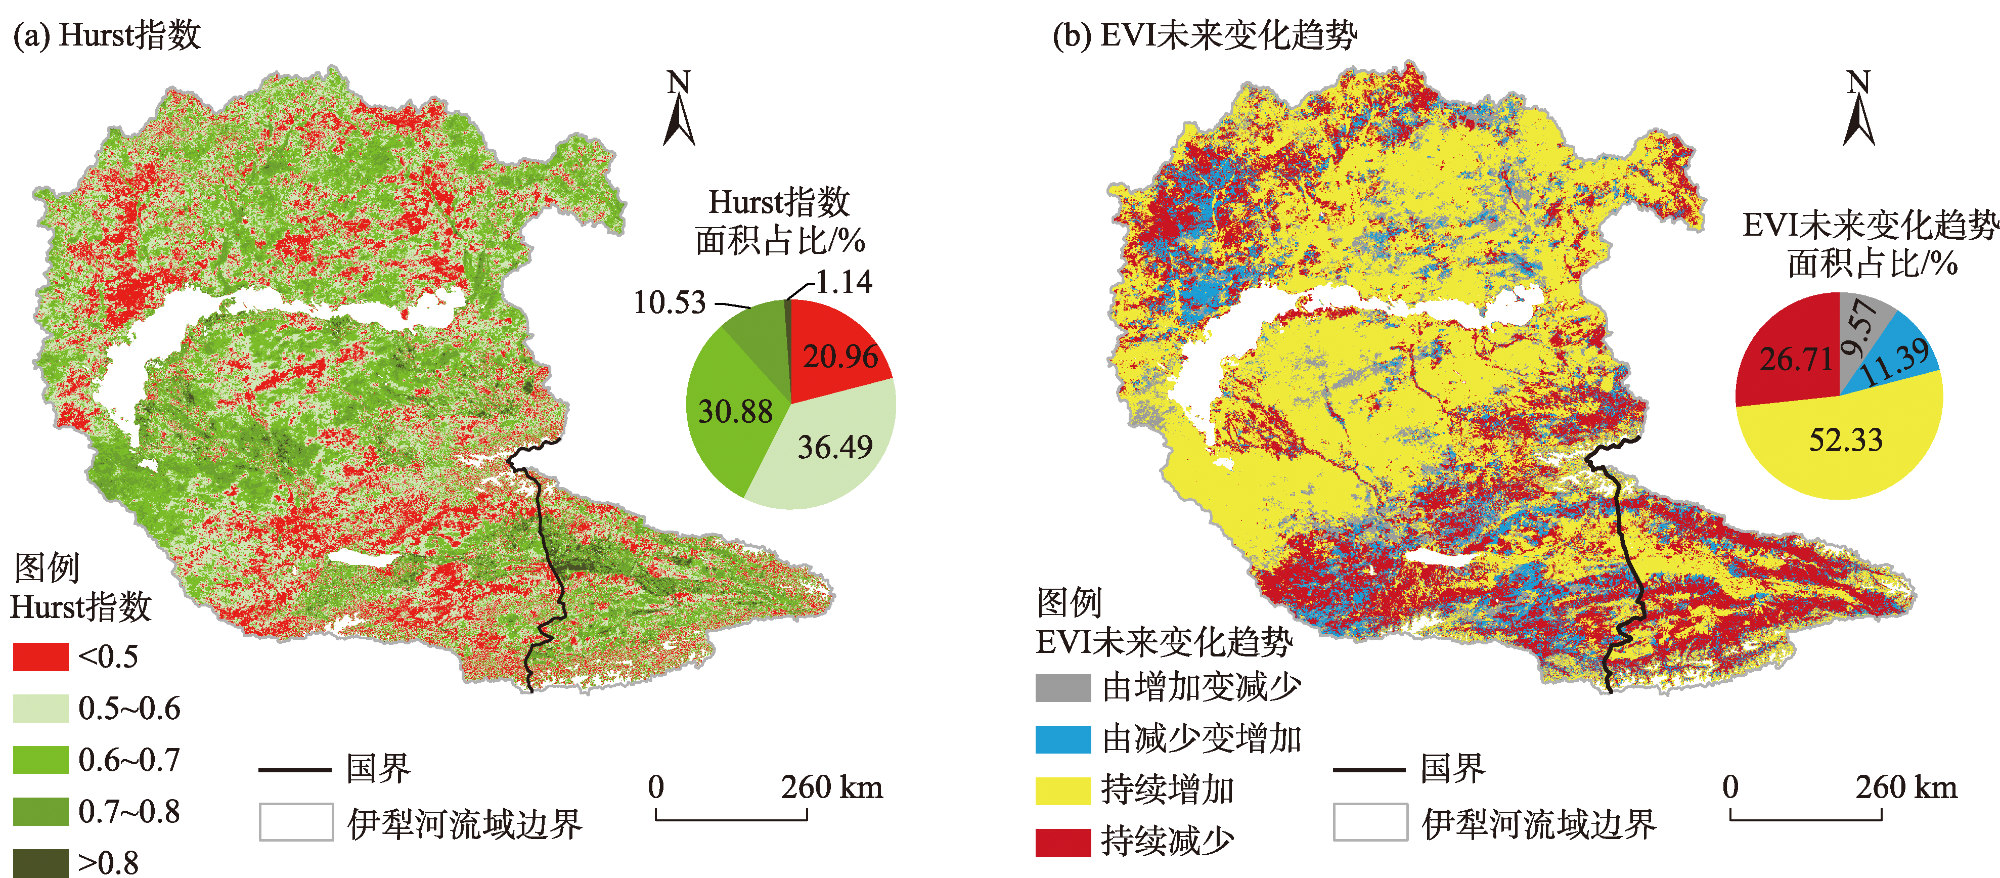
表5 中国境内外伊犁河流域EVI未来变化趋势面积占比Tab. 5 Area proportion of the future trend of EVI in the Ili River Basin within and outside China |
| EVI未来变化趋势 | 境内面积占比/% | 境外面积占比/% |
|---|---|---|
| 由增加变减少 | 7.33 | 9.92 |
| 持续减少 | 44.71 | 23.96 |
| 持续增加 | 35.97 | 54.83 |
| 由减少变增加 | 11.99 | 11.29 |
| [1] |
|
| [2] |
|
| [3] |
|
| [4] |
|
| [5] |
|
| [6] |
廖成浩, 曾艳, 姚昆, 等. 江西植被EVI时空动态监测及驱动因素分析[J]. 云南大学学报(自然科学版), 2022, 44(5): 981-989.
[
|
| [7] |
阮惠华, 许剑辉, 张菲菲. 2001—2020年粤港澳大湾区植被和地表温度时空变化研究[J]. 生态环境学报, 2022, 31(8): 1510-1520.
[
|
| [8] |
|
| [9] |
|
| [10] |
|
| [11] |
孙国军, 李卫红, 朱成刚, 等. 2000—2015年伊犁河谷植被覆盖时空变化特征[J]. 干旱区地理, 2020, 43(6): 1551-1558.
[
|
| [12] |
王倩, 杨太保, 杨雪梅. 伊犁河流域归一化植被指数的时空变化及其对气候的季节响应[J]. 兰州大学学报(自然科学版), 2016, 52(4): 466-474.
[
|
| [13] |
闫俊杰, 乔木, 周宏飞, 等. 基于MODIS/NDVI的新疆伊犁河谷植被变化[J]. 干旱区地理, 2013, 36(3): 512-519.
[
|
| [14] |
|
| [15] |
张潇, 夏自强, 郭利丹, 等. 1960—2010年巴尔喀什湖流域干湿特征分析[J]. 资源科学, 2016, 38(6): 1118-1128.
[
|
| [16] |
叶佰生, 赖祖铭, 施雅风. 气候变化对天山伊犁河上游河川径流的影响[J]. 冰川冻土, 1996, 18(1): 31-38.
[
|
| [17] |
|
| [18] |
|
| [19] |
|
| [20] |
|
| [21] |
|
| [22] |
|
| [23] |
陈淑君, 许国昌, 吕志平, 等. 中国植被覆盖度时空演变及其对气候变化和城市化的响应[J]. 干旱区地理, 2023, 46(5): 742-752.
[
|
| [24] |
|
| [25] |
|
| [26] |
梁爽, 张吴平, 毕如田, 等. 山西省植被NPP时空变化特征及其驱动力分析[J]. 广西植物, 2018, 38(8): 1005-1014.
[
|
| [27] |
赵俊红, 周华荣, 卢雅焱, 等. 2000—2015年塔里木胡杨林国家级自然保护区NPP时空动态特征及其影响因素[J]. 干旱区地理, 2020, 43(1): 190-200.
[
|
| [28] |
王常顺, 汪诗平. 植物叶片性状对气候变化的响应研究进展[J]. 植物生态学报, 2015, 39(2): 206-216.
[
|
| [29] |
王洪亮, 冯爱萍, 高彦华, 等. 伊犁河流域最大植被覆盖度的时空动态变化[J]. 环境科学与技术, 2018, 41(6): 161-167.
[
|
| [30] |
|
| [31] |
阿依丁·热西坦, 阿斯娅·曼力克, 贠静, 等. 伊犁河谷草地资源利用现状及可持续利用对策[J]. 草学, 2021(3): 78-81, 86.
[
|
| [32] |
|
| [33] |
|
| [34] |
李吉玫, 徐海量, 宋郁东, 等. 伊犁河流域水资源承载力的综合评价[J]. 干旱区资源与环境, 2007, 21(3): 39-43.
[
|
| [35] |
|
/
| 〈 |
|
〉 |