Climatology and Hydrology

Evolution and driving factors of megadrought and pluvial events in the Qilian Mountains during the past 500 years

  • Zijian REN , 1, 2 ,
  • Jianglin WANG , 1 ,
  • Henian XU 1, 2 ,
  • Chun QIN 1
Expand
  • 1. Key Laboratory of Desert and Desertification, Northwest Institute of Eco-Environment and Resources, Chinese Academy of Sciences, Lanzhou 730000, Gansu, China
  • 2. University of Chinese Academy of Sciences, Beijing 100049, China

Received date: 2023-02-21

  Revised date: 2023-04-12

  Online published: 2024-06-20

Abstract

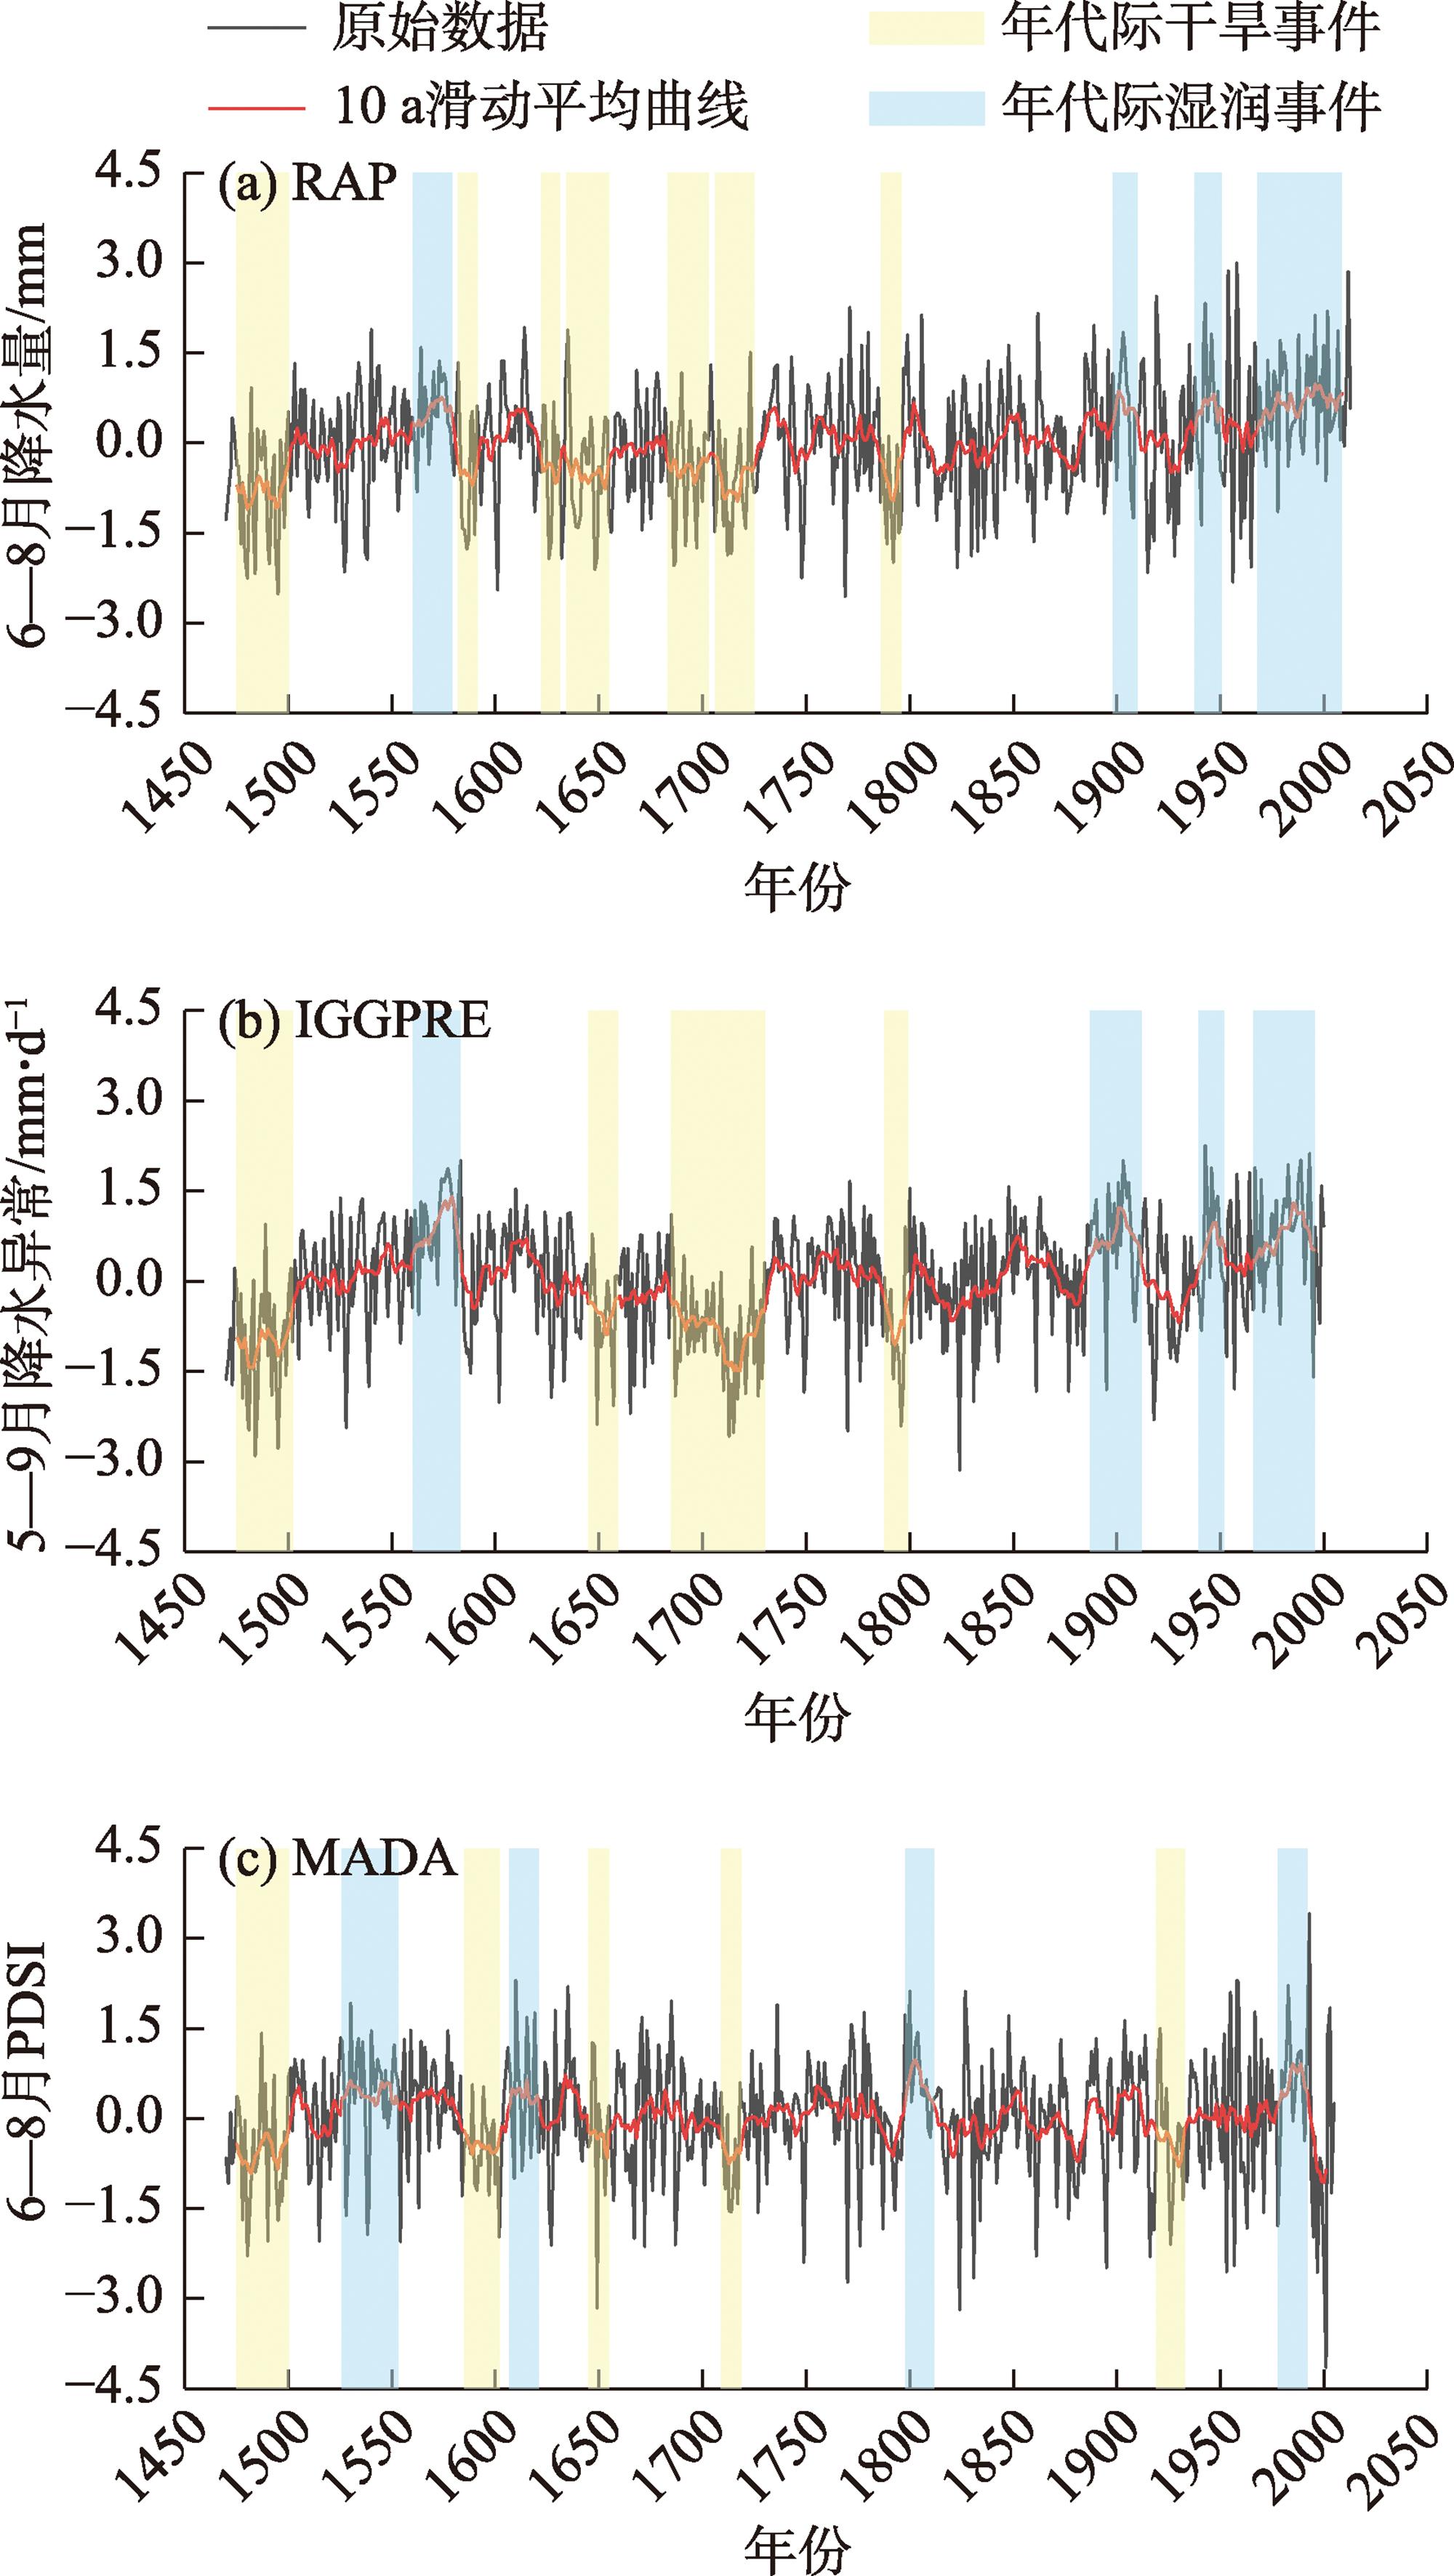
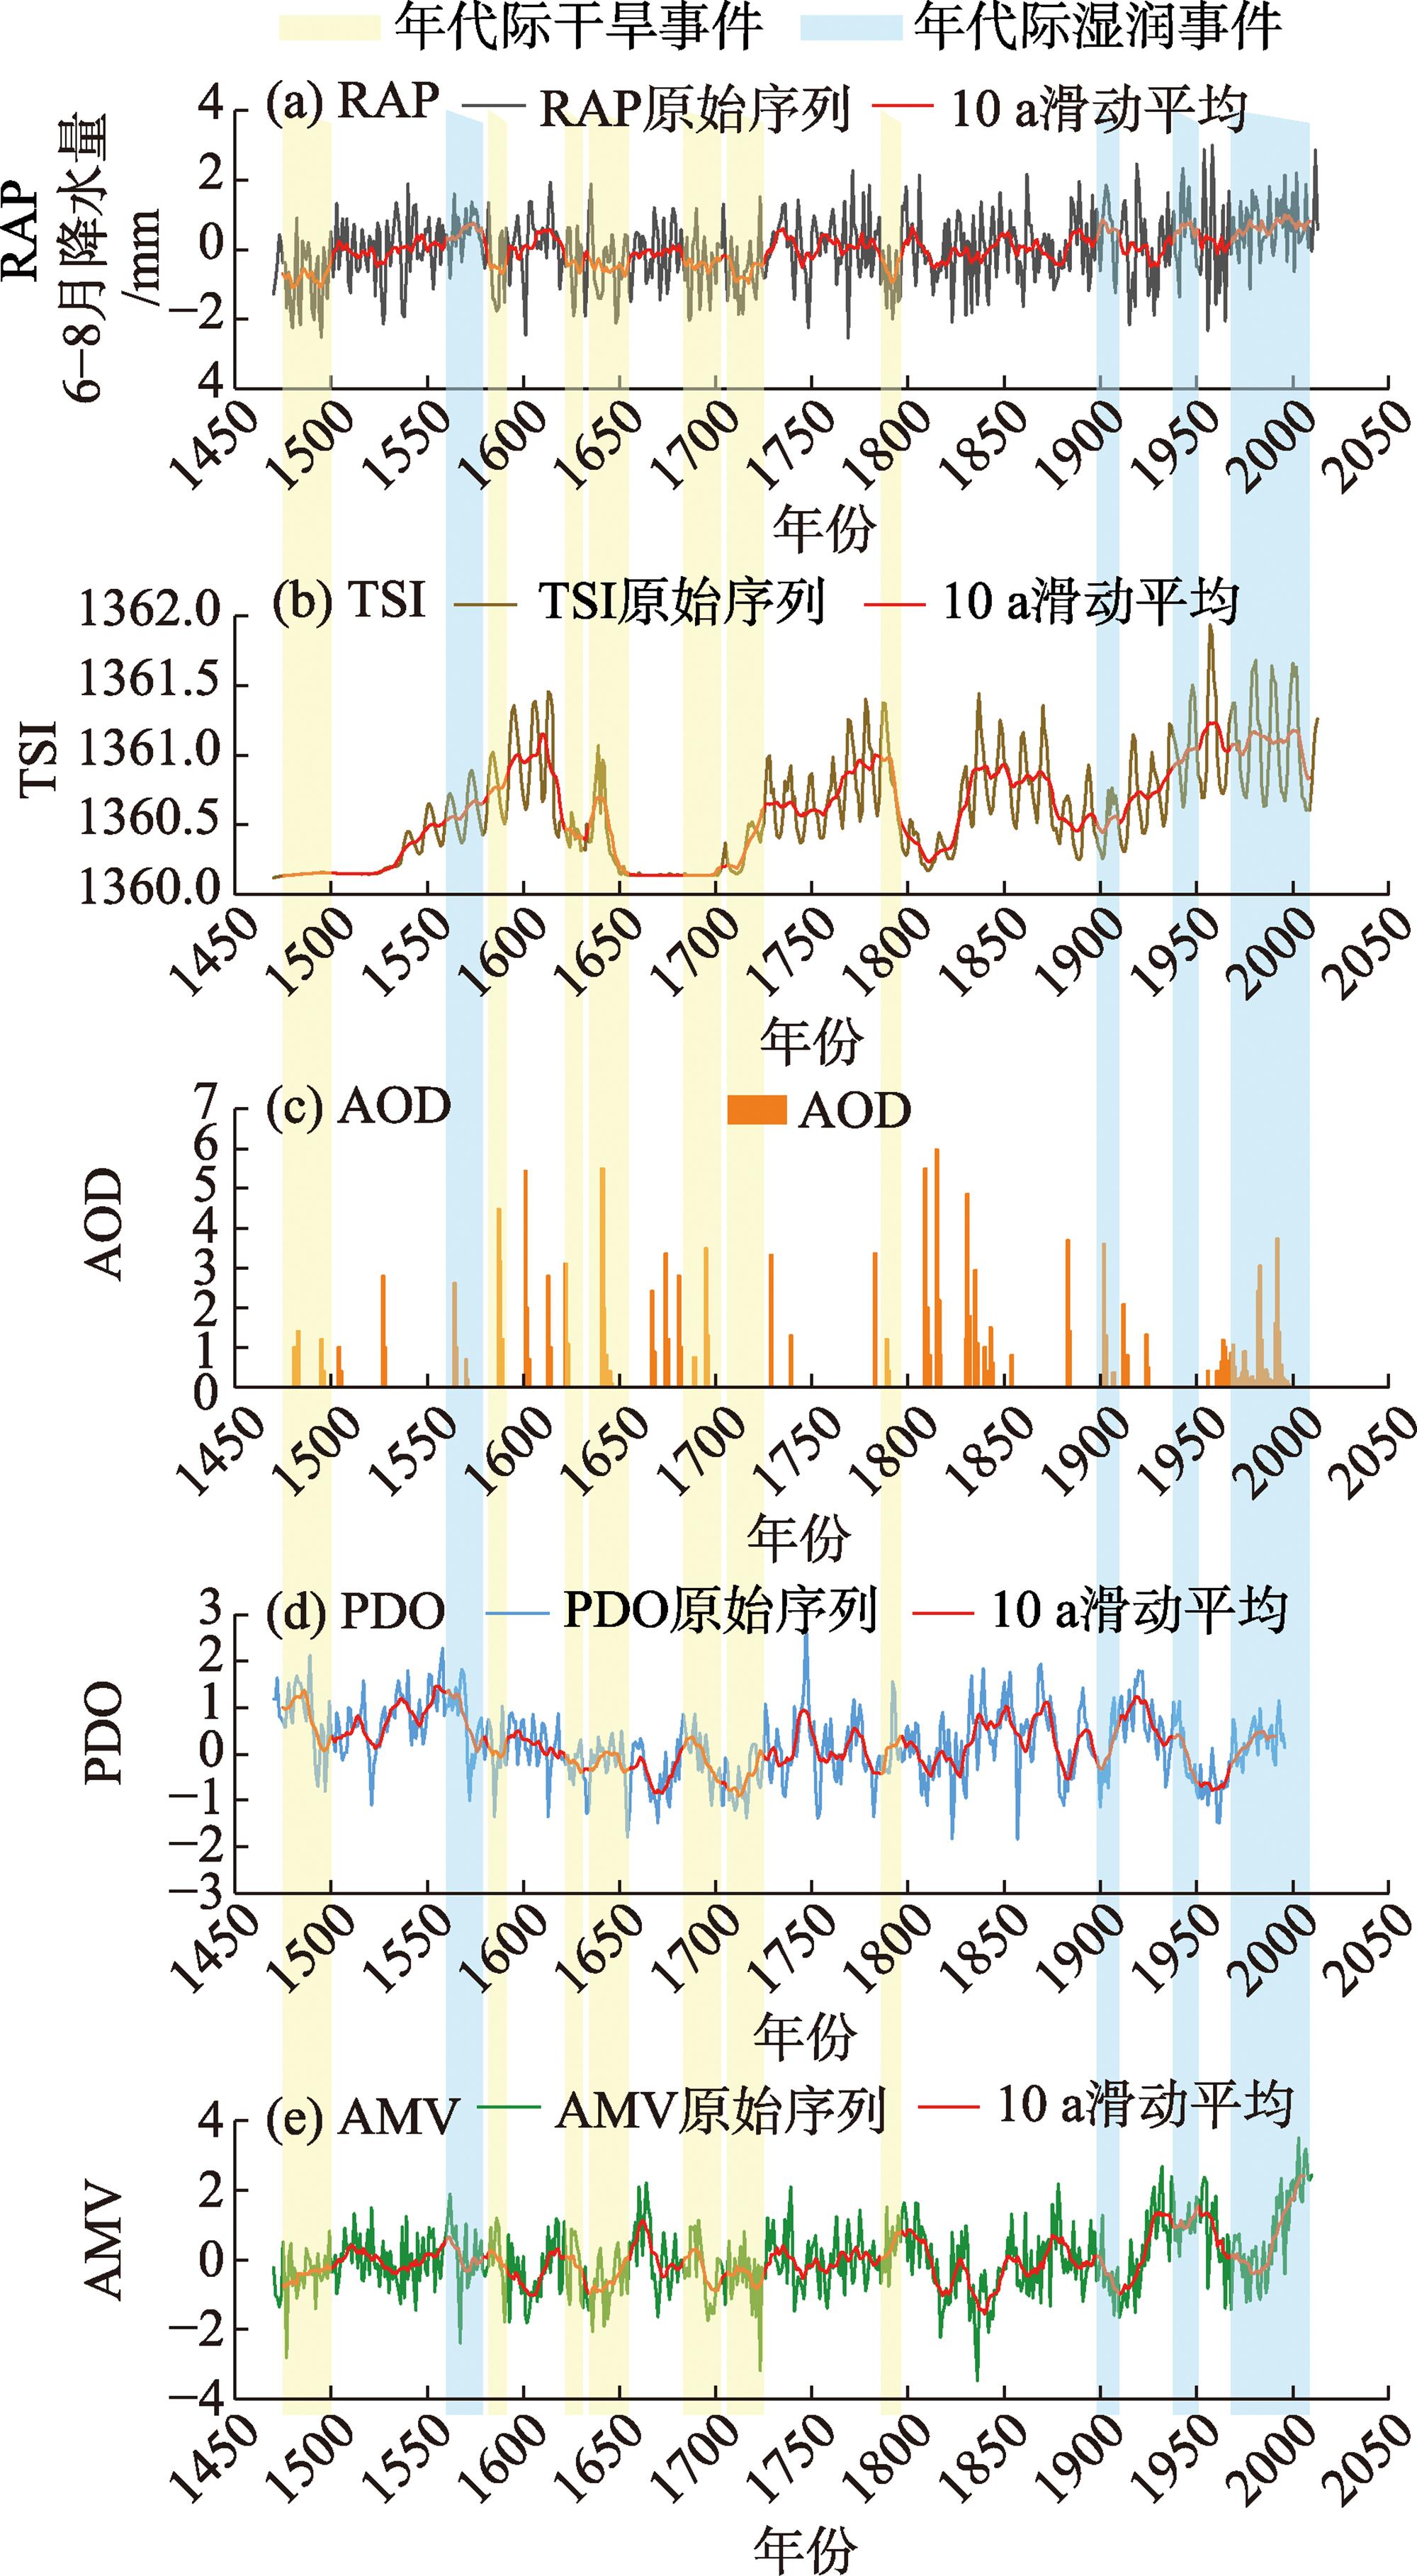
Qilian Mountains is a climate-sensitive area in the arid areas of northwest China, where extreme megadrought events considerably impact vegetation, frozen soil, and other ecological elements. This paper uses three hydroclimate reconstruction datasets to analyze the occurrence, evolution, and possible driving mechanism of megadrought and pluvial events in the Qilian Mountains over the past 500 years. The results showed that the climate in the Qilian Mountains has shown a clear wetting trend since the recent decades, and the wetness trend after 1951 has exceeded the range of natural variability in the historical period. The RAP dataset provided a good representation of the historical dry and wet conditions in the study area. Significant variations were observed in precipitation during the past seven megadrought events in the region, with the highest severity occurring during the drought period of 1786—1796. Furthermore, considerable variations were noted in the duration of the four megapluvial events, with the longest duration being a wet event that lasted for 42 years from 1968 to 2009. Megadrought and pluvial events were influenced by climate forcing and internal variability of sea surface temperatures (SST). The decadal SST modes in the Pacific and Atlantic Oceans and their phase combinations were key factors regulating the megadrought and pluvial events in the Qilian Mountains. Solar radiation exhibited an in-phase variation with the precipitation in the Qilian Mountains, while volcanic activity primarily affected megadrought events. This study highlights the importance of a long-term perspective for assessing current hydroclimate anomalies in the Qilian Mountains and including possible roles of external forcing and sea surface temperature variability in assessing the future megadrought and pluvial risks in this region.

Cite this article

Zijian REN , Jianglin WANG , Henian XU , Chun QIN . Evolution and driving factors of megadrought and pluvial events in the Qilian Mountains during the past 500 years[J]. Arid Land Geography, 2024 , 47(2) : 214 -227 . DOI: 10.12118/j.issn.1000-6060.2023.070
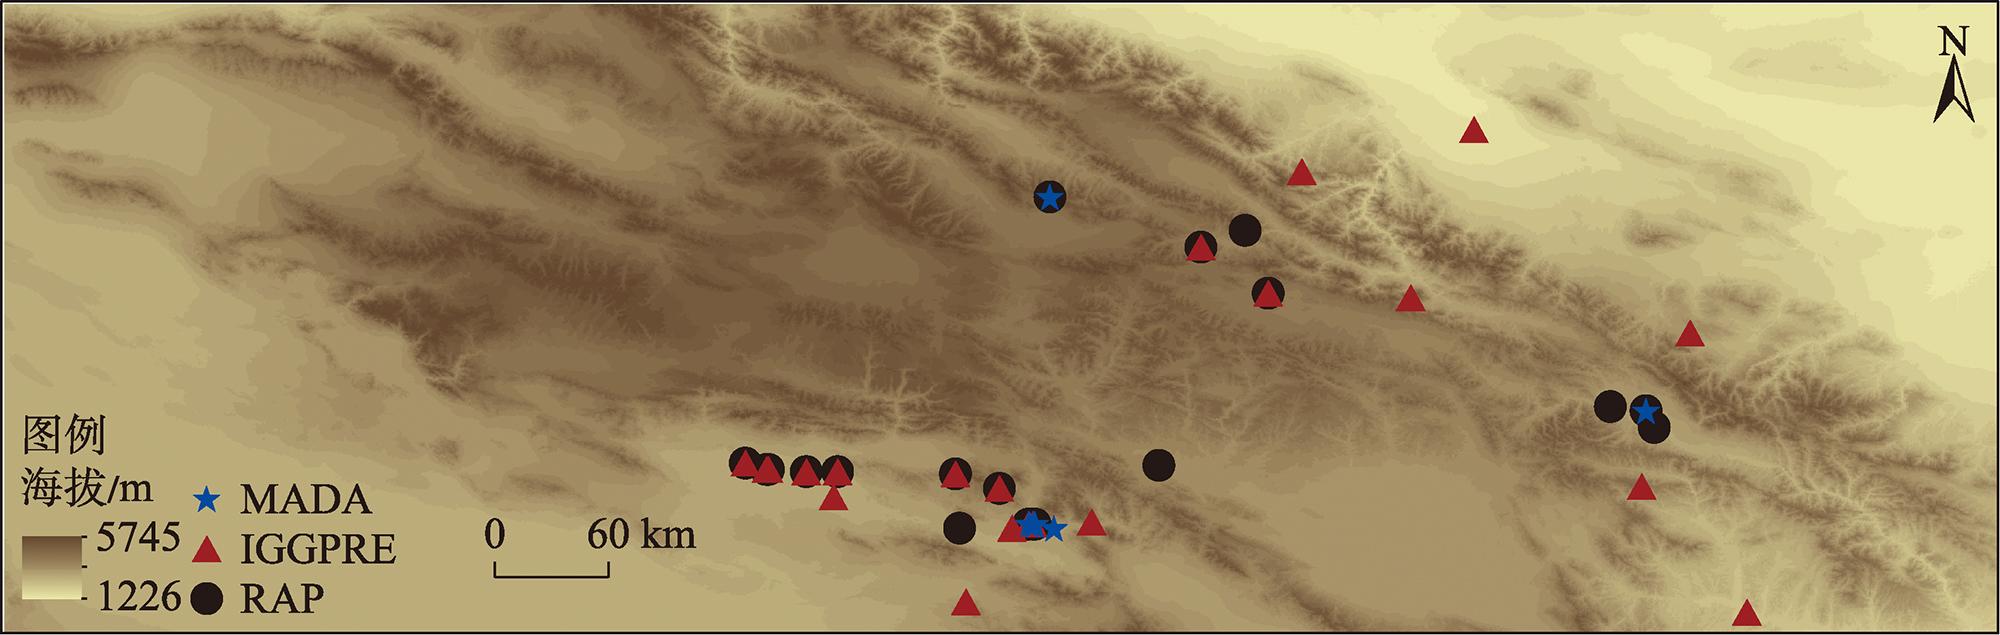
干旱是人类面临的最严重、代价最大的自然灾害之一,对环境的影响非常显著,甚至会造成经济破坏、生命损失和文明崩溃等严重后果[1-6]。一般来说,年代际特大干旱是持续10 a以上的干旱事件,其影响比短期干旱更严重[7],这类干旱事件通常会对不同地区的水资源、自然生态环境以及经济发展造成重大影响[8]。年代际干旱是北美西部地区面临的重大自然灾害之一:尤其中世纪气候异常(Medieval climate anomaly,MCA)期间,北美西部地区经历了持续数10 a的严重干旱,给当地带来了严重破坏[7];Seager等[9]的研究表明,自1997(1998)年厄尔尼诺以来,北美西南部的大部分地区一直处于干旱之中。此外,也有一些学者对中国发生的年代际干旱事件进行了相关研究:Ma等[10]认为,自20世纪80年代以来,中国北方干旱的频率明显增加,对区域水资源问题产生了重大影响;Qin等[11]发现中国北方自20世纪50年代以来经历了严重的年代际干旱,对社会经济发展产生了重大影响。
随着全球变暖,未来年代际干旱和其他极端气候事件的频率和风险也可能会增加[12-13]。因此,提高对年代际特大干旱发生机制的认识,对未来年代际干旱的预测以及社会经济的可持续发展具有重要意义。国内外许多学者认为年代际干旱受外部强迫和内部变率两方面因素驱动:Seager等[14]认为,MCA时期的外部强迫变化(例如,太阳活动增强或火山活动减弱)可能是导致北美干旱的驱动因素之一;Zhang等[15]认为东亚东部的干旱主要受北太平洋西部海温异常的影响;太平洋年代际振荡(Pacific Decadal Oscillation,PDO)对年代际干旱也起着重要作用,例如1960—1990年华北地区约70%的特大干旱都与PDO相位变化有关[15-16]
祁连山脉位于我国西北干旱半干旱地区,既是我国西部重要的生态安全屏障,也是我国政府提出的“一带一路”建设生态保护的核心[17]。随着全球变暖,极端气候事件使得祁连山面临一系列环境问题,如:永久冻土消融、植被生产力下降、水土流失等[18-20]。有研究表明,祁连山近几十年气候呈现明显的增温增湿趋势[21-23],但由于仪器数据记录不够长,很难了解祁连山的历史气候变化状况,因此需要借助各种代用资料对其进行研究。目前已有众多研究在祁连山地区建立了长时期尺度的树轮年表[24-26],其中Yang等[26]在青藏高原东北部建立了长达4500 a树轮年表,研究了当地降水变化情况及驱动因素,发现历史干旱期主要发生在小冰期(Little Ice Age,LIA,1400—1900年),并且在1940—2011年明显更湿润。Gou等[25]重建了祁连山西部5—7月的干旱指数(scPDSI)序列,也记录了该地区在小冰期发生的3次特大干旱事件(1260—1340年、1430—1540年和1640—1740年),并发现这3次特大干旱事件分别对于3个太阳活动极小期。
前人基于重建序列已对祁连山历史气候变化做了许多分析,但鲜少对祁连山地区历史年代际旱涝事件及其驱动因素进行研究[27-28];施雅风等[29-30]研究表明西北地区在20世纪中期出现暖湿化趋势,但对这一趋势的历史地位尚不明确。因此,本文基于Shi等[31]的亚洲夏季降水数据集(RAP),结合Cook等[32]的亚洲季风干旱数据集(MADA)以及Shi等[33]的中国531 a多指标降水量重建数据集(IGGPRE),揭示祁连山区过去500 a年代际干旱演化特征,从长时间背景下认识近期气候变化异常性,以了解1951年之后气候变化在历史上的定位,并对历史上年代际旱涝事件及其驱动因素进行分析。

1 研究区概况

祁连山(36°30′~39°30′N,93°30′~103°E)位于青藏高原东北部,处于青海省东北部和甘肃省西部,平均海拔4000~4500 m,是西北沙漠地区和青藏高原地区之间的过渡地带,也是亚洲夏季风和西风带之间的过渡带。该地区主要为干旱半干旱气候,年平均降水量200~500 mm,且降水主要集中在5—8月,年均温0.2~3.6 ℃[24],山区河流众多,植被分布具有明显的垂直地带性,主要树种为祁连圆柏(Sabina przewalskii)和青海云杉(Picea crassifolia)。

2 数据与方法

2.1 数据来源

2.1.1 气候重建数据集

目前,祁连山地区气候分析可供选择的数据集共有5套,其中Liu等[34]建立的亚洲近300 a多指标重建的标准化降水指数数据集,序列长度为300 a,并未覆盖本文研究时段(过去500 a),因此,未作为分析重点;而Feng等[35]重建的过去500 a亚洲暖季降水网格化重建数据集尚未能在网上公开获取,故本研究主要基于RAP、MADA、IGGPRE 3套数据集展开。
已有研究表明RAP、MADA、IGGPRE 3套数据集在祁连山地区代表性良好[36],Liu等[34]的重建结果也证明,RAP等3套数据集在祁连山地区有较强的可靠性。图1展示了3套数据集在祁连山地区附近的树轮采样点分布。
图1 3套数据集在祁连山附近树轮采样点分布

注:RAP为亚洲夏季降水数据集;MADA为亚洲季风干旱数据集;IGGPRE为中国531 a多指标降水量重建数据集。下同。

Fig. 1 Distribution of tree-ring sampling sites near the Qilian Mountains for the three datasets

表1展示了本文所使用的气候重建数据集的相关信息。RAP[31]为亚洲夏季(6—8月)降水重建数据集,由453个树轮年表及71份历史文献记录重建得来,空间分辨率为2.0°×2.0°,时间尺度为1470—2013年;MADA[32]由327个树轮年表重建得来,包含了1300—2005年亚洲夏季(6—8月)的帕默尔干旱指数(PDSI),空间分辨率为2.5°×2.5°,采用了点对点回归(PPR)的重建方法;IGGPRE[33]同样采用了PPR方法,利用372个树轮年表和107份历史文献重建了1470—2000年中国5—9月的降水异常,空间分辨率较RAP和MADA高,为0.5°×0.5°。本文仅研究1470年之后的气候,因此3套数据集分别选取1470年之后祁连山范围(36°30′~39°30′N,93°30′~103°00′E)的数据。
表1 3套气候重建数据集相关信息

Tab. 1 Information of three hydroclimate reconstruction datasets

数据集信息 RAP MADA IGGPRE
来源 Shi等[31] Cook等[32] Shi等[33]
时间 1470—2013年 1300—2005年 1470—2000年
季节 6—8月 6—8月 5—9月
分辨率 2.0°×2.0° 2.5°×2.5° 0.5°×0.5°
代用指标 453个树轮年表71条DWI 327个树轮年表 372个树轮年表107条DWI
方法 DWI的水平变换与外推,树木年轮的PPR PPR PPR
范围 9.75°~56.25°N
60.25°~144.25°E
10.00°~57.50°N
60.00°~145.00°E
18.00°~54.00°N
72.00°~136.00°E

注:RAP为亚洲夏季降水数据集;MADA为亚洲季风干旱数据集;IGGPRE为中国531 a多指标降水量重建数据集;DWI为干湿指数;PPR为点对点回归法。

2.1.2 气象数据

本文使用的气象数据为覆盖全球陆地表面的高分辨率(0.5°×0.5°)月度数据CRU TS v4.06(Climatic research unit,CRU)来源于荷兰皇家气象研究所数据共享网站(http://climexp.knmi.nl)。利用CRU降水与scPDSI分别与3套重建数据集在对应的季节尺度上进行空间相关分析,以验证本文采用的3个数据集代表祁连山地区干湿状况的可靠性(图1)。
图2可看出,3套重建数据集中,RAP与CRU降水之间的空间相关性较强(研究区内的相关系数几乎均在0.5以上),与CRU的scPDSI之间相关性相对较弱;IGGPRE与CRU的scPDSI空间相关性显著高于与CRU降水的相关性;MADA则与CRU的scPDSI空间相关性较强,而与CRU降水的空间相关性则相对较弱。总的来说,3套气候重建数据集的平均序列与CRU的scPDSI、降水数据之间的空间相关性均较好,相关系数基本都达到了0.3以上,且通过了95%显著性检验,因此本文用3套重建数据集对祁连山历史时期气候变化进行分析具有一定的可靠性。
图2 1951年以来祁连山地区3套数据集的平均序列与CRUscPDSI、CRU降水的空间相关性

注:scPDSI为干旱指数。CRU数据均采用3套数据集对应月份的数据(RAP为6—8月,IGGPRE为5—9月,MADA为6—8月)。

Fig. 2 Spatial correlation between the mean series of three datasets and CRUscPDSI and CRU precipitation in the Qilian Mountains since 1951

2.1.3 气候外强迫和海温重建

本文所考虑到的气候驱动因素包括太阳总辐照度(Total solar irradiance,TSI)、气溶胶光学厚度(Aerosol optical depth,AOD)、太平洋年代际振荡、大西洋年代际变率(Atlantic Multidecadal Variability,AMV)(表2)。TSI数据采用Lean[37]重建的850 a以来的太阳总辐照度数据集,其中1610年之前的数据来源于冰芯和树轮中提取太阳活动的宇宙成因同位素指标(10Be和14C),1610—1882年的数据由模型估计得来,1882—2016年的数据则通过太阳黑子数的直接观测得来。AOD数据使用Crowley等[38]重建的过去1000 a全球AOD数据集,该数据集是用克里特岛和格陵兰岛的格陵兰冰盖项目2(Greenland Ice Sheet Project 2-GISP2)的2个长冰芯记录建立的。PDO数据使用Macdonald等[39]重建的太平洋年代际振荡数据,该数据集是通过加利福尼亚和阿尔伯塔的2个柔枝松(Pinus flexilis)树轮年表建立的一个年度PDO数据集。AMV数据使用Wang等[40]的大西洋年代际变率数据,该数据集是通过北大西洋—北极地区、北美东部和欧洲的46个年分辨率的气候代理记录(35个树轮记录、10个冰芯记录、1个历史文献记录)建立的一个5—9月AMV指数数据集,重建方法为嵌套主成分回归法,并使用滑动窗口法进行校准和验证。
表2 气候驱动因子数据集信息

Tab. 2 Information about datasets of climate driving factors

影响因素 来源 年份 代用指标
TSI Lean[37] 850—2016年 1610年以前:冰芯和树轮记录;1610—1882年:模型估计;1610年以后:观测记录
AOD Crowley[38] 1000—1998年 克里特岛和格陵兰岛的2个冰芯记录
PDO Macdonald等[39] 993—1996年 北美的2个树轮年表
AMV Wang等[40] 800—2010年 环北大西洋地区的46个气候代用记录

注:TSI为太阳总辐照度;AOD为气溶胶光学厚度;PDO为太平洋年代际振荡;AMV为大西洋年代际变率。

2.2 研究方法

2.2.1 数据处理方法

3套气候重建数据集选取1470年之后祁连山范围(36°30′~39°30′N,93°30′~103°E)的数据,每年计算一个平均值,并对其进行标准化、10 a滑动平均处理;4个影响因素数据集同样选取1470年之后的数据,并进行标准化、10 a滑动平均处理。

2.2.2 年代际旱涝事件定义

本文对RAP、IGGPRE、MADA标准化后的数据进行10 a滑动平均处理,将其值<-0.5标准差(>0.5标准差),持续时间10 a 以上,且其中至少有1 a<-1.5标准差(>1.5标准差)的事件定义为年代际干旱(湿润)事件。这一定义与Ault等[41]和Stevenson等[42]研究中所使用的定义类似。

2.2.3 Pearson相关与滑动相关

R = i = 1 n ( x i - x - ) ( y i - y - ) i = 1 n x i - x - 2 i = 1 n y i - y - 2
R n = i = t - n + 1 t ( x i - x - i ) ( y i - y - i ) i = t - n + 1 t ( x i - x - i ) 2 × i = t - n + 1 t ( y i - y - i ) 2
式中: R n为滑动相关系数;n为滑动步长,一般取奇数;t为时间序列总长度; x i为RAP数据集第i年的降水指数; y i为MADA(IGGPRE)数据集第i年的PDSI(降水指数); x - i为RAP数据集第i年的降水指数均值; y - i为MADA(IGGPRE)数据集第i年的PDSI(降水指数)均值。通过滑动平均,序列中短于滑动长度的周期会大大削弱,显现出变化趋势。
对3套数据集进行Pearson及滑动相关分析,以此来检查3套重建数据集对祁连山过去500 a气候变化的代表性,并且为3.3节之后利用RAP数据集对祁连山年代际旱涝事件、近几十年气候变化趋势以及年代际旱涝事件的驱动因素分析提供了基础。

2.2.4 共线性检验与多元线性回归

首先利用SPSS对祁连山降水4个驱动因子之间进行共线性检验,计算其方差膨胀系数(VIF),一般认为VIF<10时,变量之间不存在共线性[44],回归方程可靠。
通过共线性诊断后,为定量描述气候驱动因子对祁连山降水变化的影响,利用多元线性回归建立了TSI、AOD、PDO、AMV影响祁连山降水的统计模型[45],公式如下:
P r   e = β 0 + β 1 X 1 + β 2 X 2 + β 3 X 3 + β 4 X 4
式中:Pre为祁连山降水10 a滑动平均指数;β0 β 1 β 2 β 3 β 4分别为回归方程的待定系数; X 1 X 2 X 3 X 4分别为TSI、AOD、PDO、AMV的10 a滑动平均指数。

3 结果与分析

3.1 祁连山地区不同数据集的气候变化特征

图3可知,祁连山地区3套数据集重建的年代际干旱事件均集中在15、17、18世纪,处于小冰期内(14世纪初—19世纪初);年代际湿润事件在3套数据集中则表现不一致:RAP和IGGPRE中,年代际湿润事件主要集中在16世纪下半叶、19世纪末及20世纪;MADA反映的年代际湿润事件则没有明显集中分布的特点。
图3 祁连山地区不同数据集降水和PDSI指数序列及10 a滑动平均序列

注:PDSI为帕默尔干旱指数。

Fig. 3 Precipitation and PDSI index time series and 10-year moving average values over the Qilian Mountains from the three hydroclimate datasets

年际尺度上,RAP数据集中近500 a最干旱的年份分别为1495、1769年和1601年,最湿润的年份分别为1954、1958年和2012年,3个极端湿润年均发生在1951年之后;由IGGPRE数据集反映出的结果可知,祁连山地区近500 a以来最干旱的年份分别为1484、1495年和1824年,最湿润的年份为1943、1989年和1993年,20世纪末极端湿润年发生的频率较高;MADA数据集中祁连山地区最干旱的年份为1649、1824年和2001年,最湿润的年份为1610、1958年和1993年,极端干湿年出现在1951年之后的频率较高。3套数据集中,祁连山地区在1951年之后极端湿润事件频发,表明与之前的气候相比,仪器记录时期以来,祁连山地区的气候湿润程度较高。

3.2 3套数据集相关性分析及干湿事件比较

表3可知,RAP与IGGPRE、MADA之间的相关性分别为0.48、0.31,且均在99%水平上显著;1951—2000年RAP与IGGPRE的相关性为0.38,略低于长时间尺度相关性,且通过了99%显著性检验,RAP与MADA之间的相关性为0.32,在95%水平上显著;进行10 a滑动平均后,RAP与IGGPRE的相关性为0.85,且通过了99%显著性检验,与MADA的相关性为0.64,也通过了99%显著性水平。通过相关性分析发现,RAP与另外两套数据集的相关性均较强,其中RAP与IGGPRE的相关性显著高于与MADA的相关性;并且10 a滑动平均处理后RAP与另外两套数据集的相关性均明显增强。
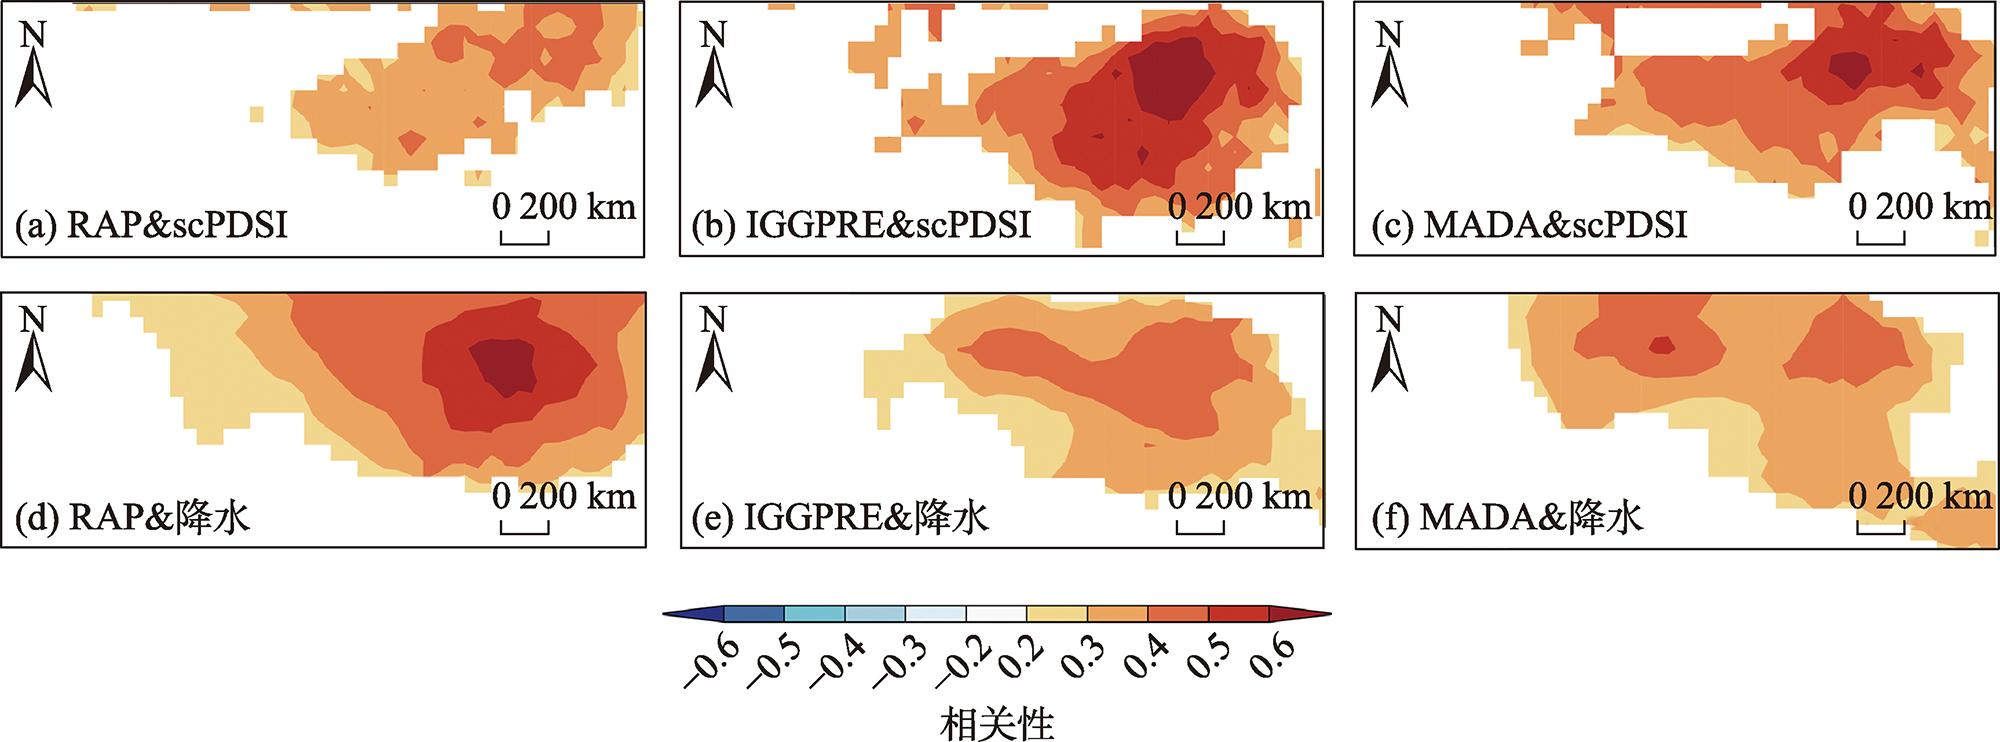
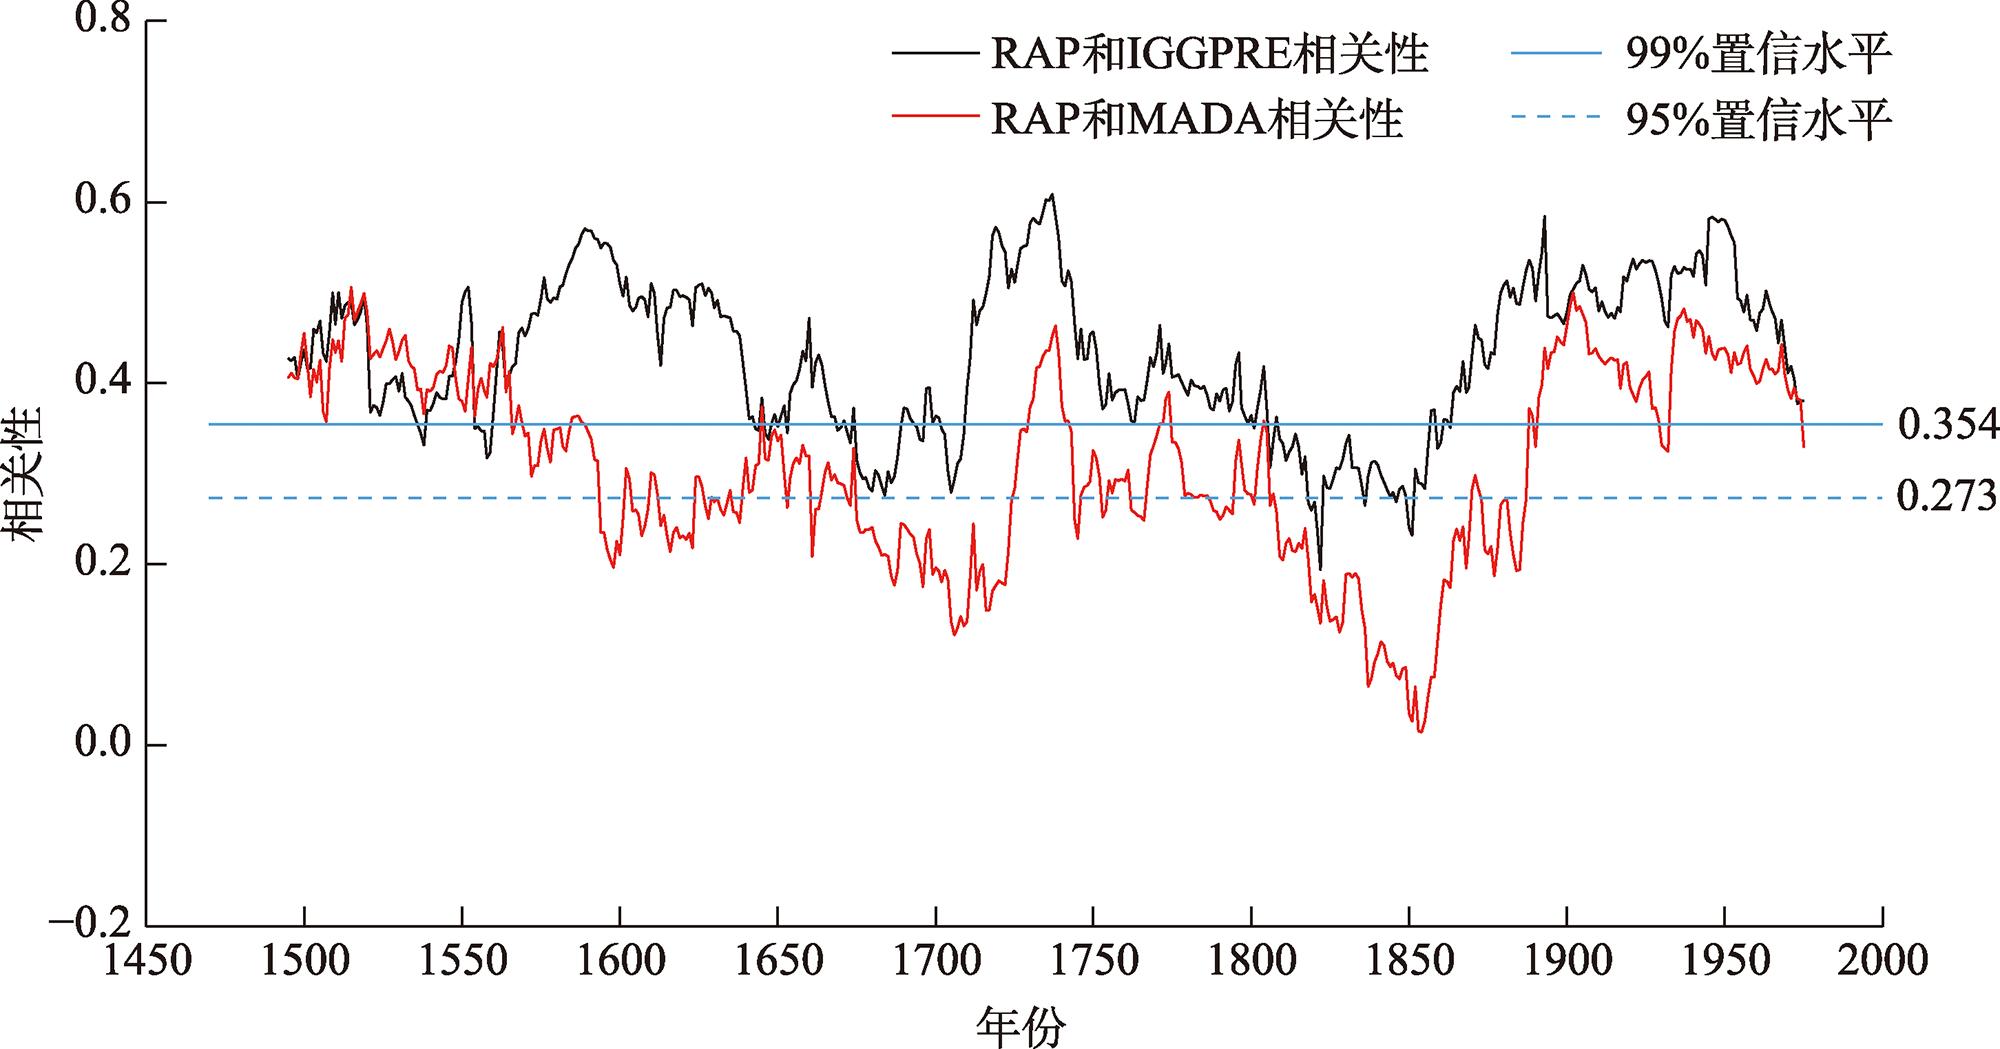
表3 RAP与IGGPRE、MADA的祁连山平均序列在年际和10 a尺度上的相关性

Tab. 3 Correlation between the mean time series of the RAP and IGGPRE, and MADA in the Qilian Mountains at interannual and decadal time scales

互相关 平滑前 平滑前1951—2000年 10 a平滑
RAP&IGGPRE 0.48** 0.38** 0.85**
RAP&MADA 0.31** 0.32* 0.64**

注:*表明通过了95%显著性检验,**表明通过了99%显著性检验。
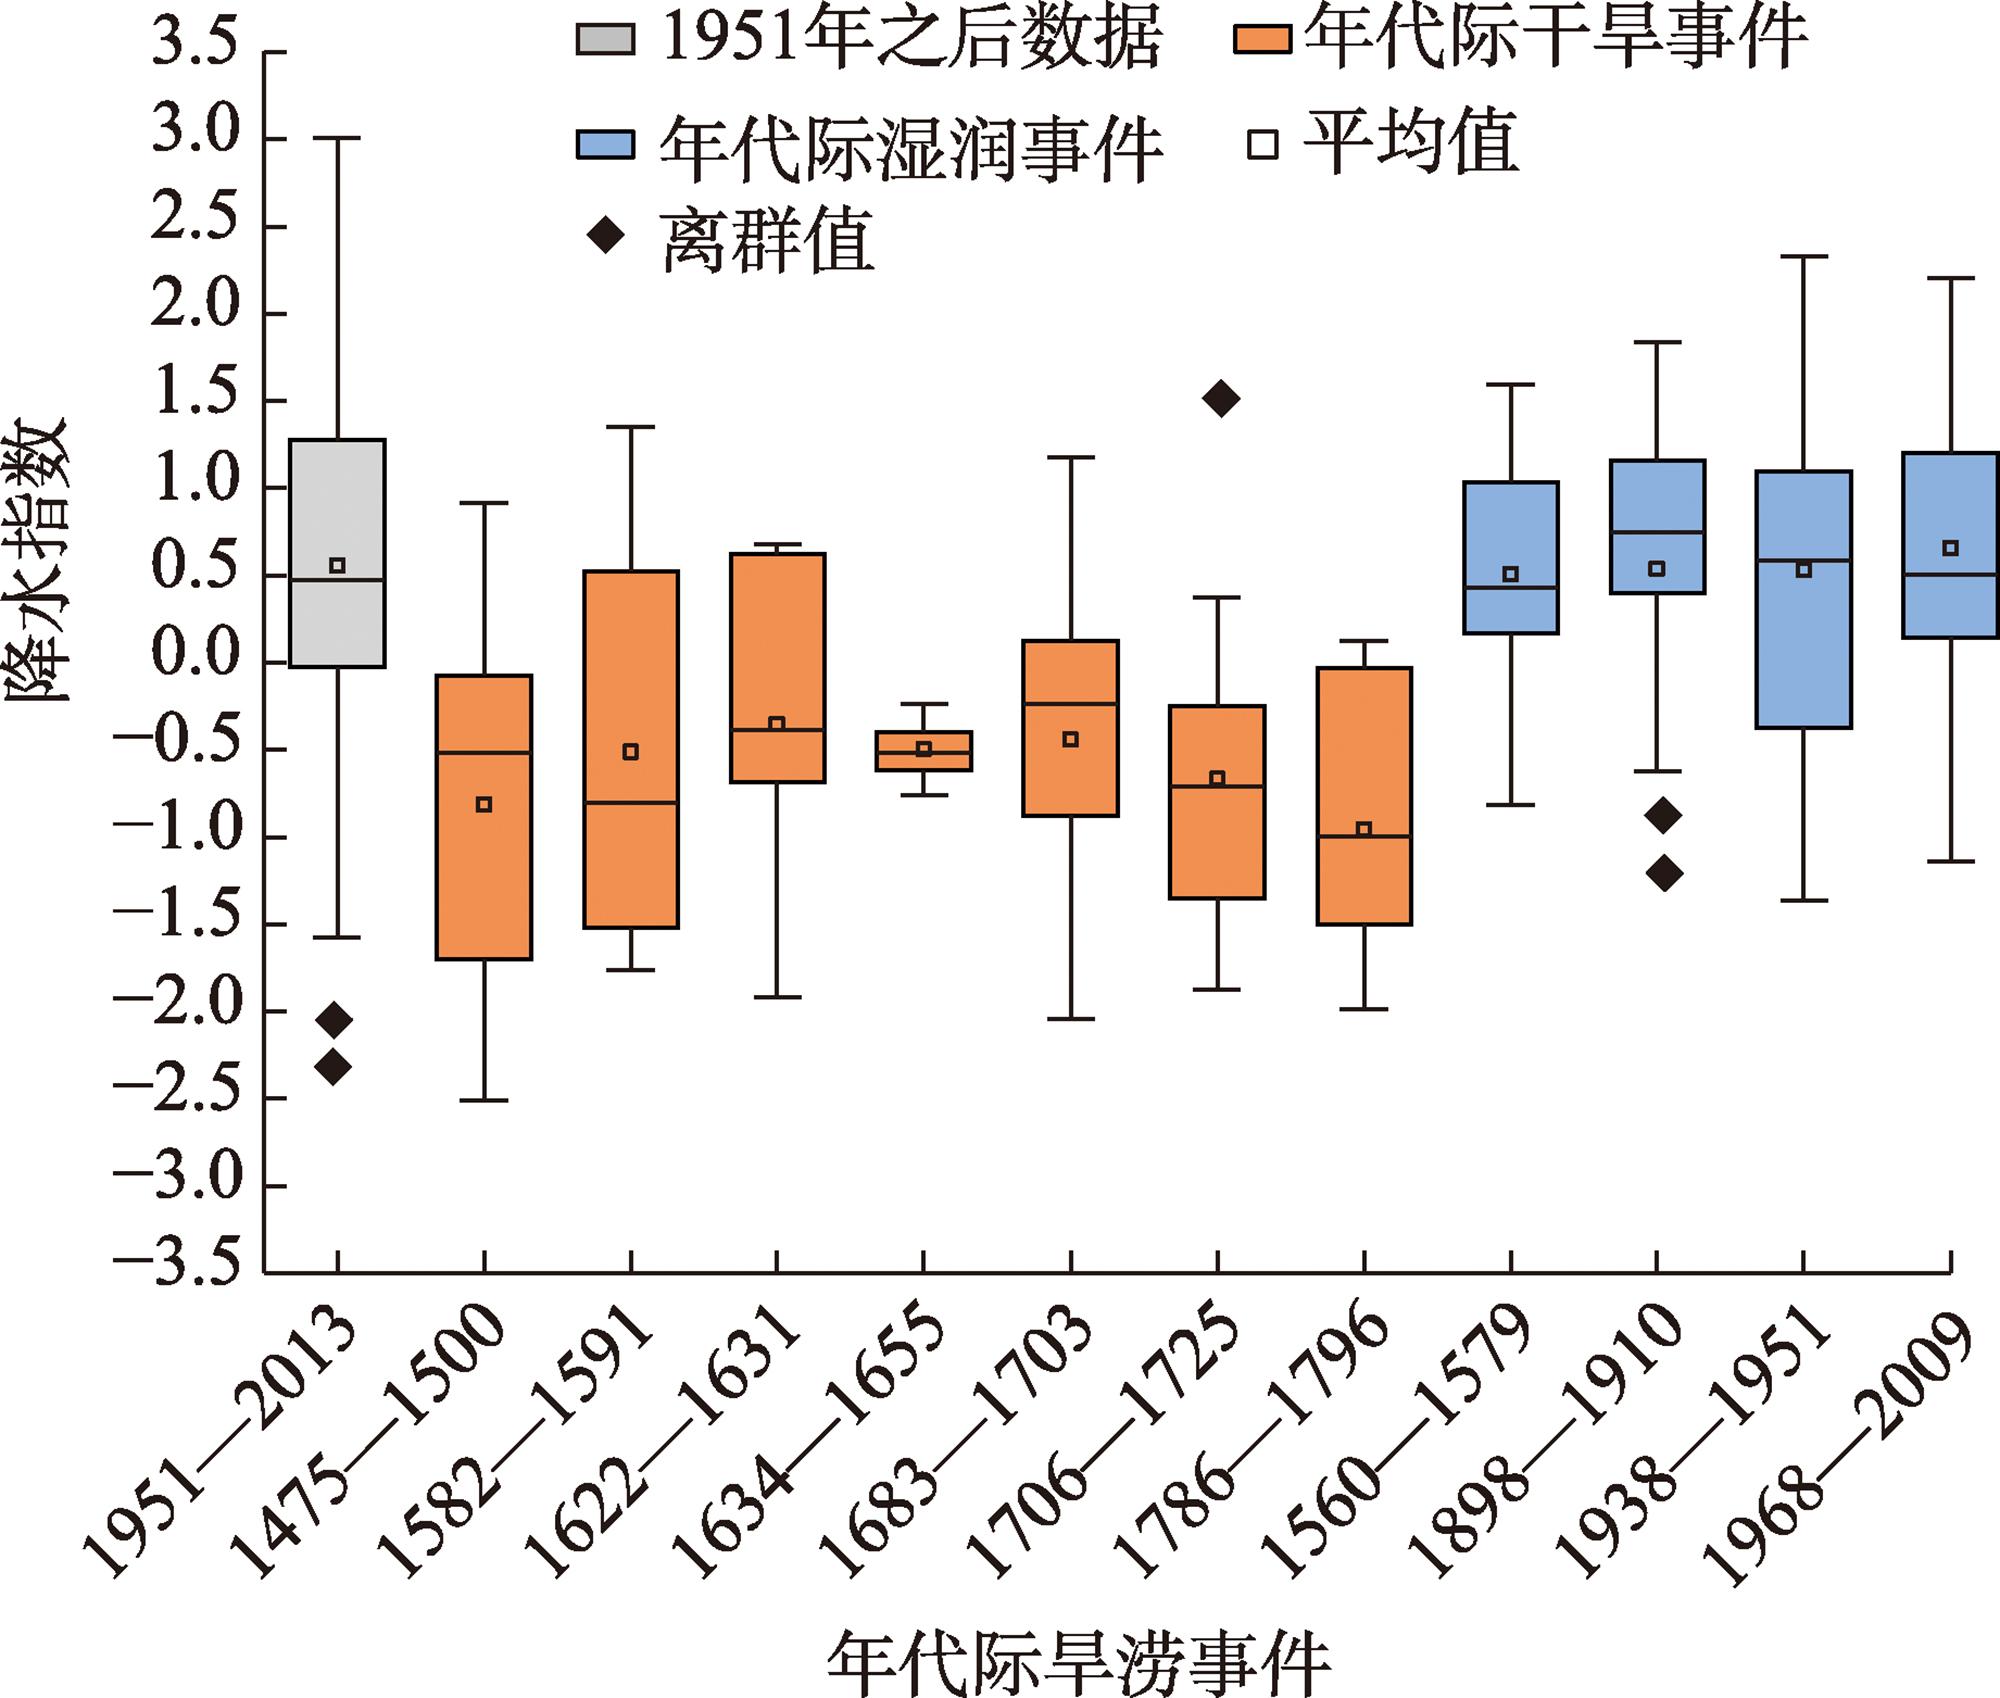
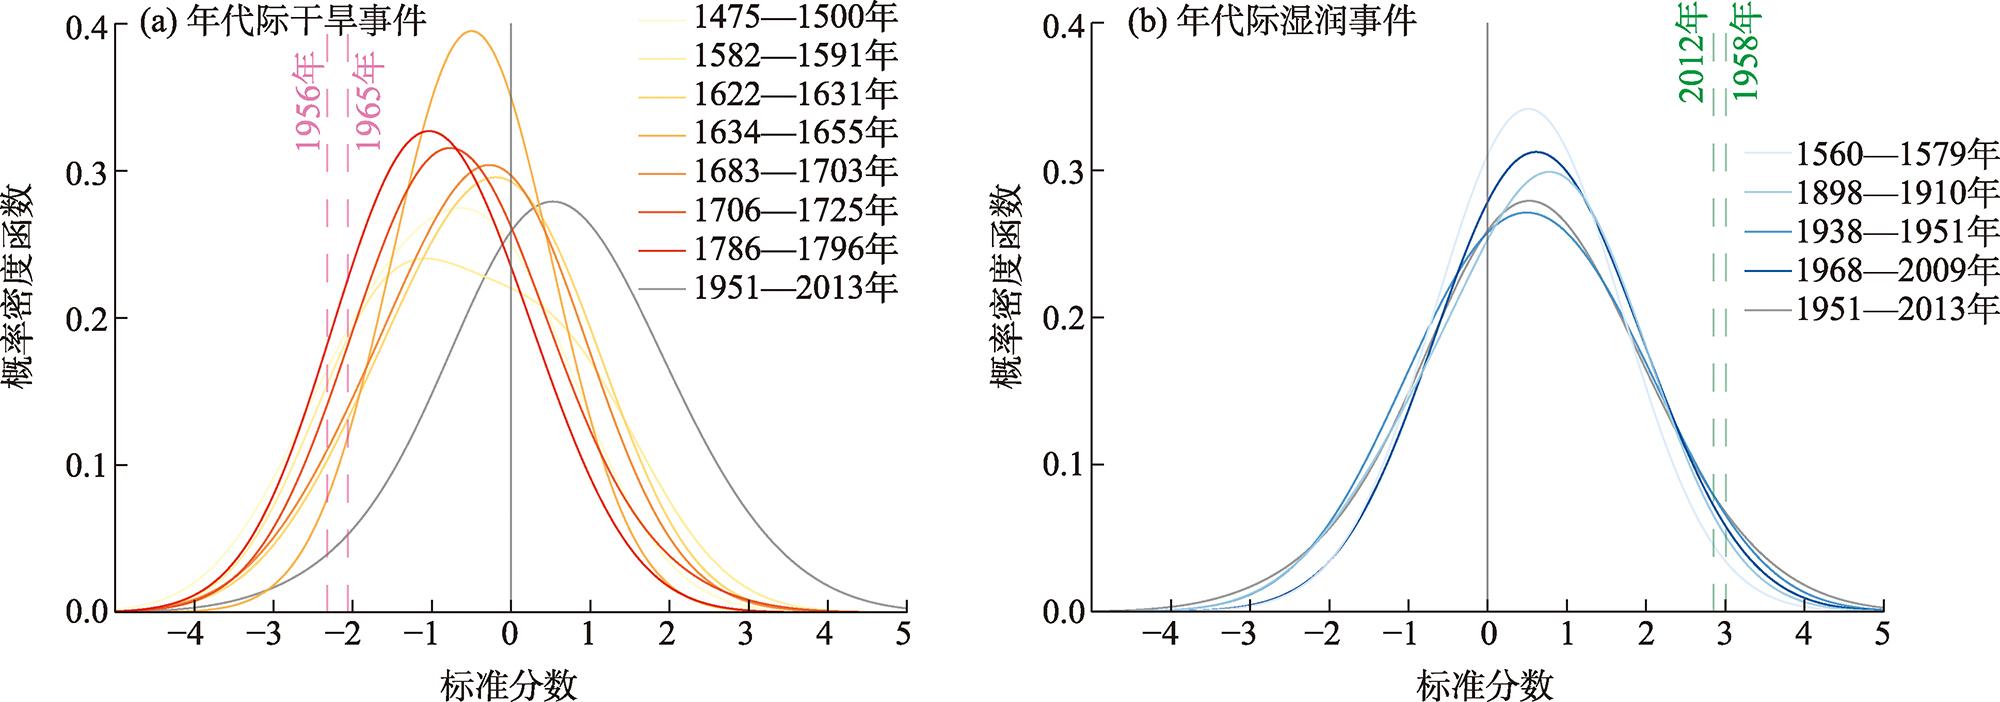
此外,本文还考虑了RAP与另外两套数据集之间的滑动相关性(图4),发现整个周期内RAP与IGGPRE之间的相关性基本都超过了0.3,并且基本都通过了99%显著性检验,在17世纪下半叶、18世纪末以及19世纪上半叶通过了95%显著性检验;RAP与MADA的相关性基本都高于0.2,但是仅在16世纪上半叶和20世纪上半叶通过了99%显著性检验,而在17世纪下半叶及19世纪大部分时间甚至没有达到95%显著性水平。由此可知,RAP与IGGPRE之间的相关性显著高于RAP与MADA的相关性,这可能是因为RAP和IGGPRE重建指标均为降水,而MADA的PDSI指数则综合考虑温度与降水所致。
图4 祁连山地区RAP与另外两套数据集平均序列的51 a滑动相关性

Fig. 4 51-year moving correlation between the mean time series in the RAP dataset and those from the other two datasets in the Qilian Mountains

图3表4可知,RAP与IGGPRE有5次年代际干旱事件和4次年代际湿润事件几乎同步,RAP与MADA有4次年代际干旱事件和1次大湿润事件同步,3套数据集同步的年代际旱涝事件有4次,其中年代际干旱事件3次、年代际湿润事件1次。RAP与另外两套数据集年代际旱涝事件同步性较好,表明本文对年代际旱涝事件的定义是合理可行的。此外,RAP与MADA、IGGPRE的旱涝事件同步性较强,同时RAP与二者相关性也较强,表明用RAP数据集分析祁连山地区气候变化具有较强的可靠性。因此,接下来的分析主要基于RAP数据集展开。
表4 3套数据集过去重大旱涝事件

Tab. 4 Comparison of megadrought and pluvial events in the three datasets over the past several centuries

旱涝事件 RAP IGGPRE MADA
年代际干
旱事件
1 1475—1500(26) 1475—1502(28) 1475—1500(26)
2 1582—1591(10) - 1585—1602(18)
3 1622—1631(10) - -
4 1634—1655(22) 1645—1659(15) 1645—1655(11)
5 1683—1703(21) 1685—1730(46)
1685—1730(46)
-
6 1706—1725(20) 1709—1719(11)
7 1786—1796(11) 1788—1799(12) -
- - 1919—1933(15)
年代际湿
润事件
- - 1526—1553(28)
1 1560—1579(20) 1560—1583(24) -
- - 1607—1621(15)
- - 1798—1812(15)
2 1898—1910(13) 1887—1912(26) -
3 1938—1951(14) 1940—1952(13) -
4 1968—2009(42) 1966—1996(31) 1978—1992(15)

注:括号中数值为干旱事件持续时间(a);事件前数字为事件编号。
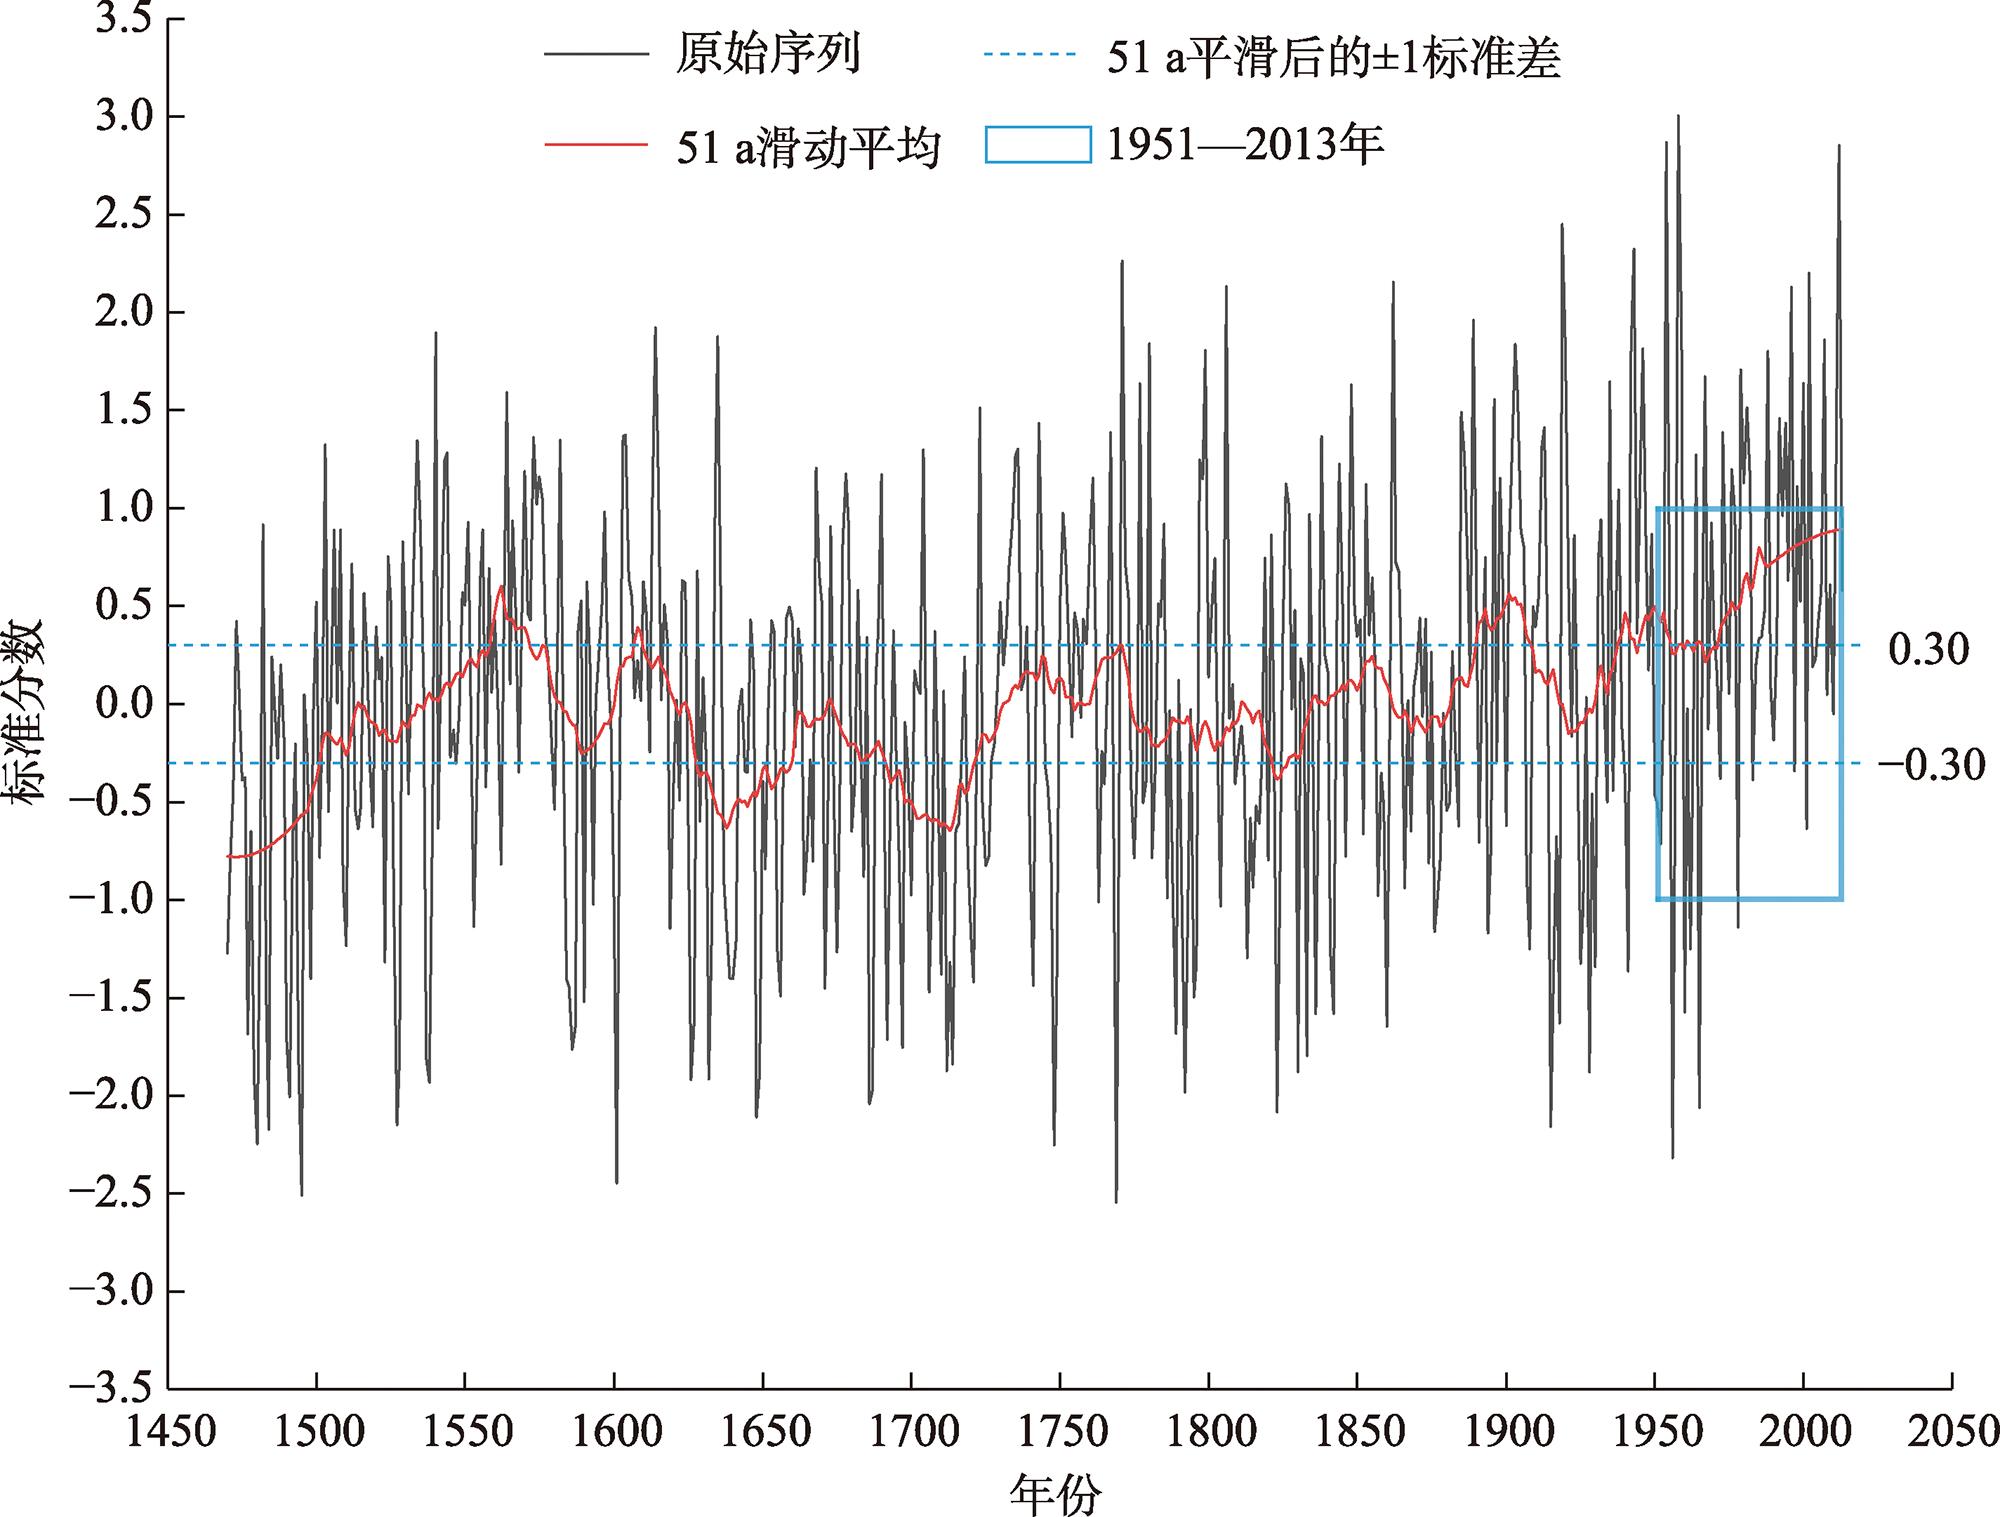
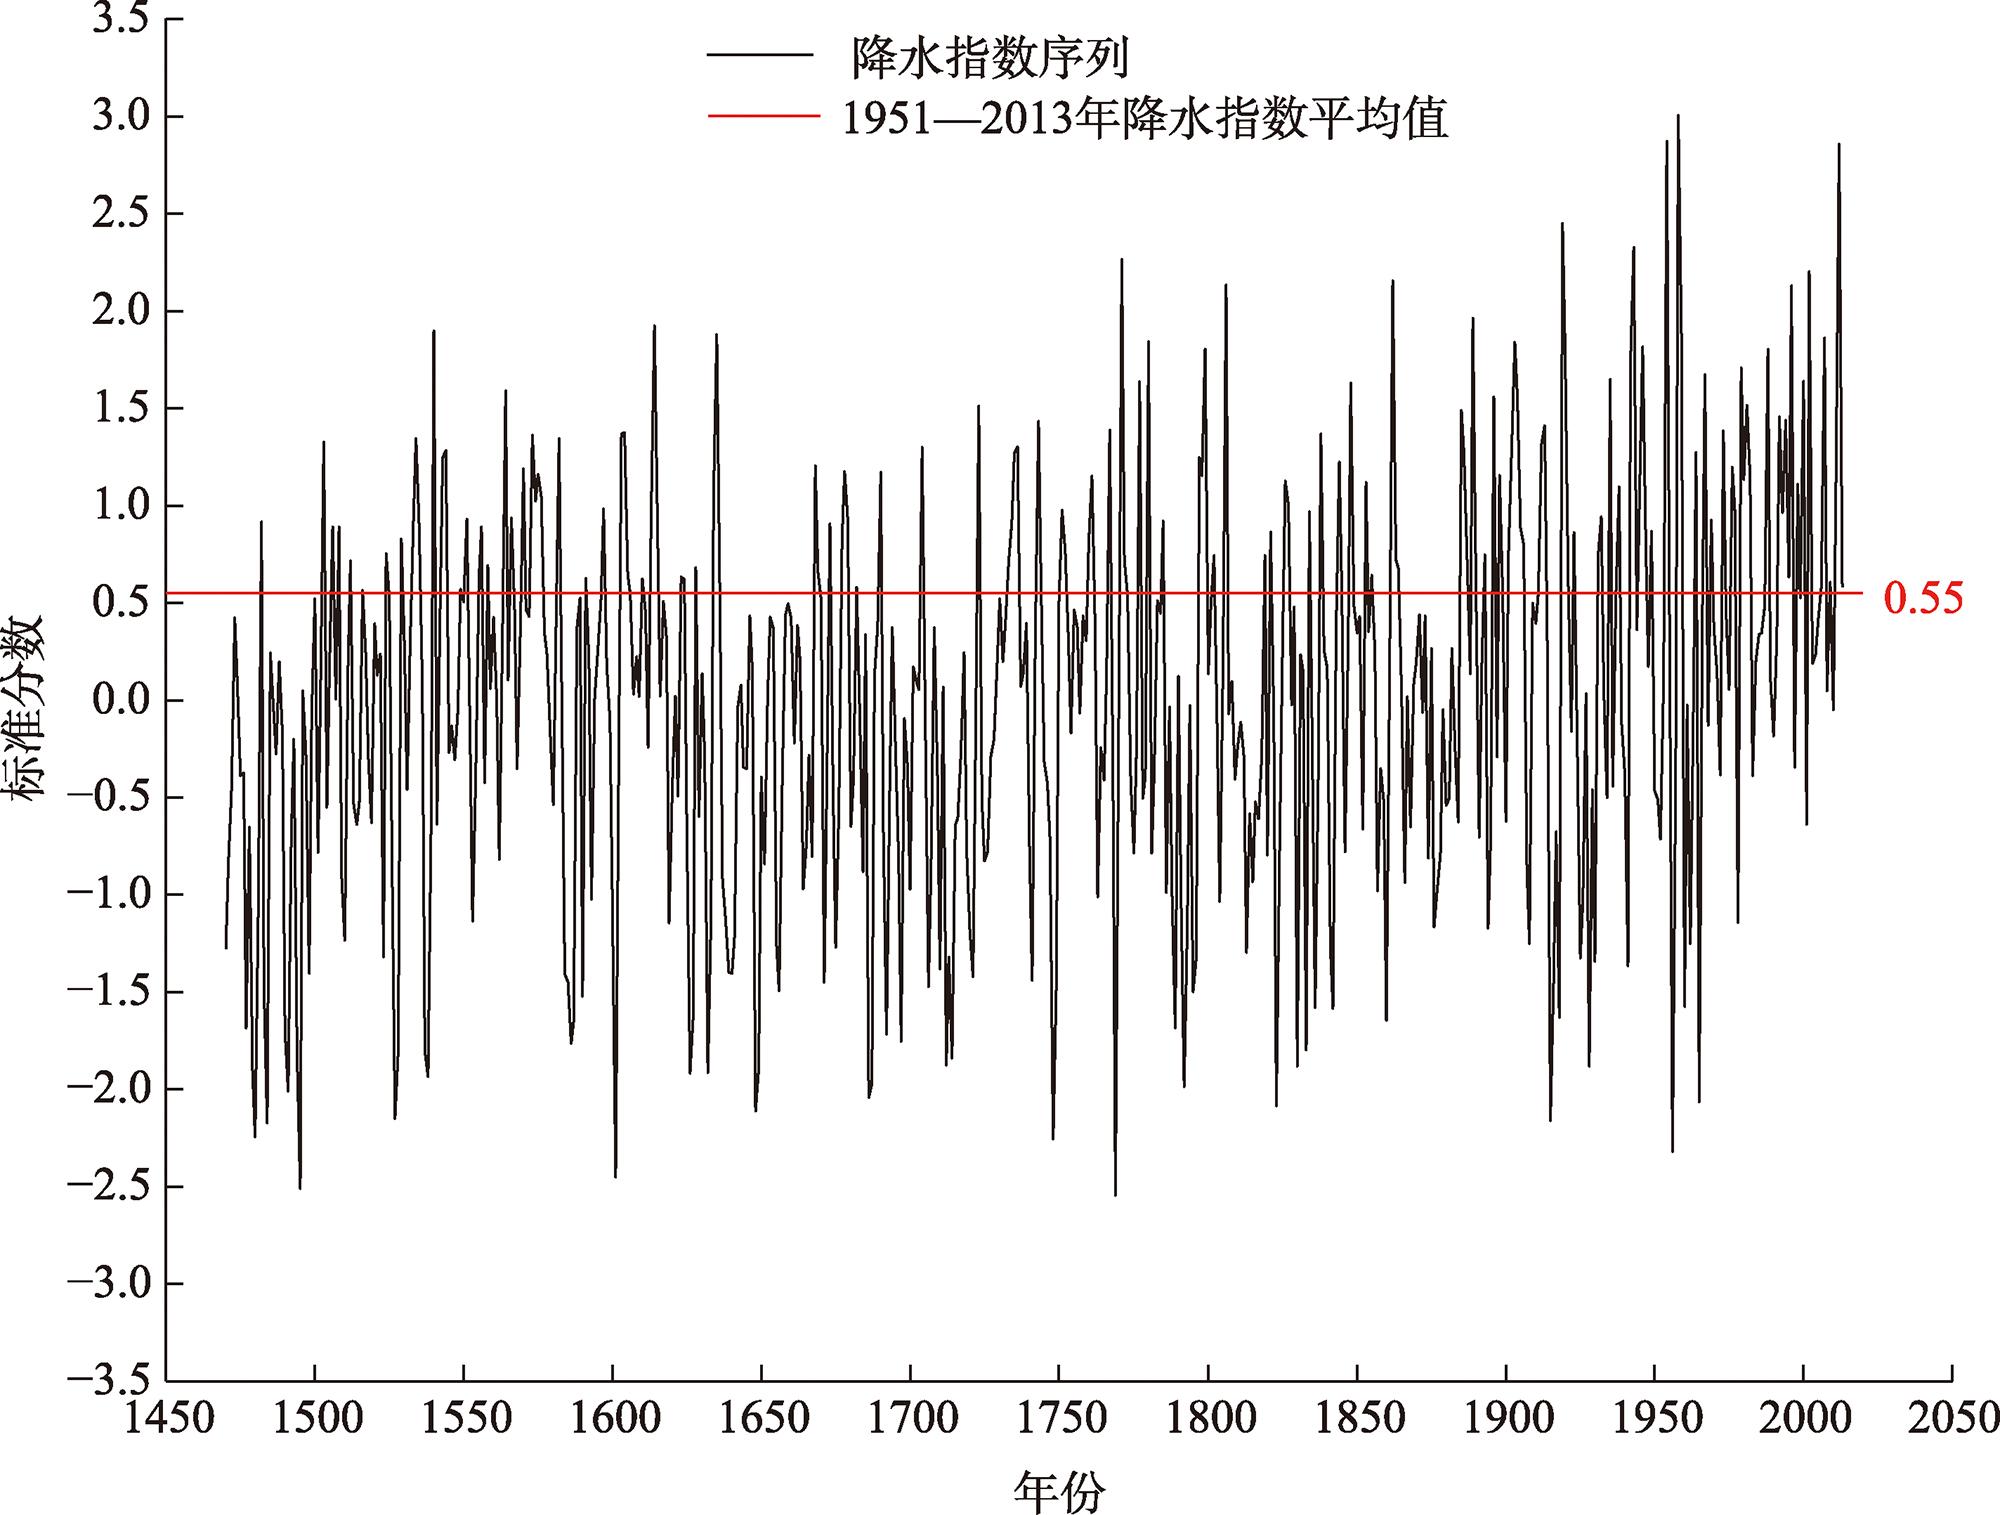
3.3 祁连山1951年以来气候变化趋势及近500 a来年代际旱涝事件分析

图5可看出,祁连山地区近500 a的降水整体呈增加的趋势,并且15世纪末、17世纪中叶、18世纪上半叶、19世纪末以及1951—2013年的降水变化趋势均超出了自然变化的范围。其中,1951年以来的气候呈明显的湿润化趋势,超出自然变化趋势范围的程度最为严重。此外,与1470—1950年相比,祁连山地区1951年以来的降水指数均值明显较高(图6),表明器测时期(1951年以来),祁连山地区的气候呈现明显的偏湿润状态。
图5 1951年以来祁连山地区气候变化趋势与过去趋势对比

Fig. 5 Comparison of hydroclimate trends since 1951 and that of the past centuries in the Qilian Mountains

图6 1951年以来祁连山地区降水指数平均值与过去降水指数对比

Fig. 6 Comparison of mean precipitation index since 1951 and precipitation index of the past centuries in the Qilian Mountains

表4图7可知,祁连山地区在过去500 a共发生了7次年代际干旱事件、4次年代际湿润事件,并且7次年代际干旱事件均发生在小冰期内(LIA:1300—1800年)。此外,1475—1500年的干旱事件是所有干旱事件中持续时间最长的,达到了26 a;而1968—2009年的湿润事件则是几次湿润事件中持续时间最长的(42 a)。与1951年以来的降水相比,7次干旱事件期间降水指数的中位数以及均值都呈现明显的负异常;而4次湿润事件与1951年以来的气候差异不明显,也可得出1951年以来的气候呈现明显的湿润状态。
图7 祁连山地区年代际旱涝事件及1951—2013年降水指数分布

Fig. 7 Distribution of precipitation index during mega-drought/pluvial events and that for the period of 1951—2013 in the Qilian Mountains

图7图8a中可以看出,在7次年代际干旱事件中,1786—1796年的干旱事件期间的降水指数均值以及中值达到了最低水平,此次干旱事件是祁连山地区过去500多年来最严重的一次干旱事件;而根据图7图8b可知,4次湿润事件的湿润程度并没有显著的差异,其中1898—1910年的湿润事件期间降水指数中值最高,而1968—2009年的湿润事件期间降水指数均值最高,受这次事件的影响,1951年之后的气候与4次年代际湿润事件差异并不显著。
图8 祁连山地区过去年代际旱涝事件降水指数概率密度分布

注:图中垂直虚线代表1951年以来的极端干湿年。

Fig. 8 Probability density distribution of precipitation index of megadrought/pluvial events in the Qilian Mountains during the past decadal period

此外,1951年以来祁连山地区经历了几次极端干湿年份,分别为1956、1965年的极端干旱年,1958、2012年的极端湿润年,其中这2次极端湿润年份为祁连山地区过去500 a中最湿润的年份,图8将这些极端干湿年与过去的年代际干湿事件进行比较,可以了解到虽然这些极端干(湿)年份的降水指数与过去年代际干旱(年代际湿润)事件降水指数的分布相比偏干(湿),但它们仍处于这些年代际旱涝事件降水指数的变化范围之内,这就表明祁连山地区1951年以来的极端降水事件仍处于气候自然变化的范围之内,在过去500多年间并不是前所未有的。

3.4 过去年代际干湿事件影响因素分析

在进行年代际旱涝事件影响因素分析之前,为验证各个影响因素之间是否存在相互影响,以甄别影响因素间的耦合作用是否会对后续祁连山降水驱动因素分析产生影响。首先对4个驱动因素10 a平滑序列之间进行了共线性检验,发现其VIF<10,表明4个影响因素均作为独立变量影响祁连山降水。其次采用回归分析定量研究了4个影响因素对祁连山地区降水的影响,结果表明TSI与AMV对祁连山降水影响最大,标准回归系数分别为0.459、0.185,且均通过了99%显著性检验;而AOD和PDO对祁连山降水影响较小,其中AOD的影响未通过显著性检验,PDO对祁连山降水存在微弱的正影响(表5)。
表5 驱动因子回归分析及共线性分析结果

Tab. 5 Multiple regression and multicollinearity analysis of influence factors

影响因素 回归分析 共线性分析
回归系数 显著性 膨胀系数(VIF)
TSI 0.459 ** 1.027
AOD -0.012 - 1.194
PDO 0.088 * 1.068
AMV 0.185 ** 1.187

注:*表示通过了95%显著性检验,**表示通过了99%显著性检验。

图9a~b可知,TSI在15世纪末、16世纪末、17世纪中叶到18世纪初、19世纪上半叶处于极小值期,期间祁连山地区表现出明显的负降水异常(1~6次干旱事件),表明太阳辐射可能是这些干旱事件的驱动因素之一;而在4次湿润事件期间,TSI都出现了极大值,因此这几次湿润事件可能由太阳辐射主导。根据图9c,在2~5次干旱事件期间,AOD出现极大值,表明在这4次干旱事件时期,火山活动可能对祁连山地区气候造成了重要的影响;而在4次湿润事件中,仅第3次湿润事件期间AOD均为低值,这就表明AOD可能并不是另外3次年代际湿润事件的主要影响因素。
图9 过去重大干湿事件影响因素分析

Fig. 9 Analysis of driving factors of megadrought and pluvial events in the past centuries

根据图9a、9d可知,在第1、4、5、7次大干旱事件中,PDO出现了明显的正异常;而在第2次干旱事件期间,PDO的相位不明显,只有微弱的正异常;而在第3、6次干旱事件中,PDO呈正相位。这可能表明在第1、4、5、7次干旱事件中PDO起到了关键性的作用,而第2次干旱事件中PDO也可能起到了一定的作用。在4次年代际湿润事件中,第2、3次事件期间PDO呈负相位,表明PDO可能在这2次湿润事件中起到了重要作用;而第1、4次湿润事件PDO的作用则不明显。
最后,从图9a、9e中可以看出,在1、2、4~6次年代际干旱事件期间,AMV明显处于负相位,这说明AMV在这5次干旱事件中可能起到了主导作用,而第3、7次干旱事件期间AMV的作用则不明显。4次湿润事件中,第1、3次湿润事件期间,AMV呈明显正相位,表明在这2次湿润事件中AMV可能起到了关键作用;而第4次湿润事件虽然AMV有部分时期处于负相位,但是从20世纪80年代开始AMV指数迅速增加,并逐渐转为正相位,这表明第4次湿润事件也可能由AMV主导;第2次湿润事件期间AMV呈显著负相位,原因不明。

4 讨论

本文结合重建数据集对祁连山近几十年气候与过去500 a的气候变化进行对比,结果表明祁连山地区器测时期以来的气候出现了明显的变湿趋势,这与Wang[17]、王有恒等[46]的结果一致。此外,从极端干湿年的角度来看,器测时期以来的气候处于自然变化的范围之内,但是通过二者趋势对比发现,祁连山近几十年的降水趋势显著超出了历史气候变化的范围,Yang等[26]的研究表明祁连山近几十年的气候为小冰期以来最湿润的时段,与本文的研究结果一致。
本文还对祁连山地区过去500 a的降水变化进行分析,确定了7次年代际干旱事件和4次年代际湿润事件,其中7次年代际干旱事件均发生在小冰期。Gou等[25]的研究表明,LIA期间祁连山地区处于一个长期干旱阶段,期间曾发生2次持续时间超过100 a的干旱期(1426—1555年、1639—1764年),而19世纪以来该地区则正在经历一个长期湿润期,这与本文的研究结果对应良好。此外,本文所确定的年代际旱涝事件中有多次也可在Tian等[47]、Sun等[48]的重建结果中看到。
本文还研究了祁连山地区过去重大干湿事件的影响因素,结果表明4个驱动因素(TSI、AOD、PDO和AMV)对祁连山地区的气候有不同程度的影响。Wang等[17]、刘芸芸等[49]曾分析祁连山地区有3个主要的水汽来源:西风带带来的大西洋的水汽以及欧亚大陆上空蒸发的水汽、来自北冰洋的水汽、亚洲季风带来的西太平洋以及孟加拉湾的水汽。4个驱动因素均可通过改变西风和东亚季风的强度影响祁连山地区的气候。
太阳辐射是改变区域气候的最主要外部强迫因素。它主要从两方面对气候产生影响,一方面改变大尺度大气环流,Liu等[50]、Zhou等[51]认为,东亚夏季风对太阳辐射响应明显,太阳辐射改变大尺度海陆热力差异,从而影响东亚夏季风的强度,导致热带海洋输送到祁连山地区的水汽减少;Chen等[52]、Jin等[53]认为太阳辐射通过高纬度和中纬度经向辐射梯度的变化控制西风带的强度。因此,太阳辐射的增加会导致东亚夏季风和西风增强,为祁连山地区带来更多的水汽;反之,太阳辐射弱的时期,到达祁连山地区的水汽减少,发生干旱。另一方面影响水汽蒸发,太阳活动的变化也会调节赤道地区水汽的蒸发,增加(减少)向亚洲夏季风系统的水分输入,从而影响到祁连山地区的降水[54]
火山爆发增加平流层气溶胶浓度,使得到达地球表面的太阳辐射减弱,导致地表冷却[55],造成海陆热力对比减弱,东亚夏季风减弱[56-57],从而使得祁连山降水减少。Shen等[55]发现中国东部近5个世纪以来的3次异常干旱均发生在大型火山爆发事件之后,其中1585、1638年的火山事件与本研究第2、4次年代际干旱事件时期重合,因此合理推断祁连山地区这2次干旱事件可能主要受火山爆发影响。此外大型火山爆发还会减少热带海洋上空的水汽,使得季风携带的水分减少,进而导致祁连山地区水分不足[58]
除外部强迫外,海温内部变率也是影响气候干湿变化的关键因素,有研究表明北极涛动(AO)、北大西洋涛动(NAO)、厄尔尼诺-南方涛动(ENSO)等均为影响气候变化的重要海温内部变率因子,但其多作用于年际尺度上[59-60]。而AMV与PDO作为影响气候年代际变化重要的海温内部变率因素[61],主要用来考虑其对祁连山地区年代际旱涝事件的影响。
AMV对祁连山地区降水变化影响占主要地位。AMV作为大西洋气候变率的一种内部模式[40],主要受大西洋经向翻转环流的影响[62]。东亚夏季风的年代际变化与AMV暖冷相位的转换密切相关[63]。AMV暖相位期间暖空气由大西洋输送到欧亚大陆,增加了欧亚大陆与太平洋的海陆热力差异,使得东亚夏季风增强[64];AMV还可激发大西洋与东亚、印度洋之间的遥相关波列,从而导致沿途对流层扰动增强[61],增加祁连山地区的降水。
PDO是北太平洋温度年代际振荡的主导模态,许多研究发现PDO与东亚夏季风的年代际变化及季风过渡区(祁连山地区)的降水关系密切[65]:PDO暖期,北大平洋中部海温偏冷,北美及赤道中东太平洋海温偏暖,向北的温度经向梯度减小,副热带高压加强,导致东亚夏季风偏弱;而在PDO冷期情况则相反,季风增强,降雨带北移,为祁连山地区带来丰富的水汽[66]
在全序列降水与驱动因素的多元回归分析中,发现PDO与祁连山降水呈同相位变化,但对年代际旱涝事件驱动因素分析则发现,PDO则与降水呈反向变化。而贾艳青等[67]对中国北方的降水与PDO的影响研究中,也发现PDO暖期,祁连山等西北干旱区气候偏湿,冷相位时气候偏干,与本文全时段驱动因子回归分析结果吻合。因此,本文推断PDO对祁连山地区降水作用不稳定,不确定性大,这可能与PDO对祁连山降水的影响仅在负相位时比较稳定有关[68]
此外,大气蒸发量和体积含水率也可能影响降水。有研究表明,中国西北部的降水有一半以上是由蒸发量控制的[69],因此温度升高(降低)会导致高亚洲地区水循环加剧(减弱)[70],使得祁连山地区大气水汽含量增加(减少),这也可能是导致祁连山地区发生大规模干湿事件的诱因。

5 结论

(1) 仪器时期以来,祁连山地区极端湿润事件频发,并且变湿趋势超出了历史自然气候变化的范围。
(2) 祁连山地区在过去500 a共发生了11次年代际旱涝事件,7次干旱事件均发生在小冰期;此外,持续时间最长的干旱是1475—1500年的干旱,而1786—1796年干旱是严重程度最高的年代际干旱事件,4次年代际湿润事件之间降水指数的差异不明显。
(3) 祁连山地区的气候受气候外强迫和海温内部变率驱动下的东亚夏季风和西风的影响。太阳辐射(TSI)增强会增加祁连山地区的降水,反之,祁连山地区降水减少;火山活动主要对祁连山地区的干旱事件影响显著(火山活动剧烈,祁连山地区降水减少),而对湿润事件的影响不明显;PDO与祁连山气候呈反相位变化,即PDO处于负相位,祁连山降水增加,PDO处于正相位,祁连山降水减少;AMV与祁连山降水大体呈正相关关系,AMV正相位期间,祁连山地区湿润事件多发,反之,干旱事件多发。
[1]
Cook E R, Seager R, Cane M A, et al. North American drought: Reconstructions, causes, and consequences[J]. Earthence Reviews, 2007, 81(1-2): 93-134.

[2]
Ionita M, Dima M, Nagavciuc V, et al. Past megadroughts in central Europe were longer, more severe and less warm than modern droughts[J]. Communications Earth & Environment, 2021, 2(1): 61, doi: 10.1038/s43247-021-00130-w.

[3]
Bryson R A, Swain A M. Holocene variations of monsoon rainfall in Rajasthan[J]. Quaternary Research, 1981, 16(2): 135-145.

DOI

[4]
Kennett D J, Breitenbach S F M, Aquino V V, et al. Development and disintegration of Maya political systems in response to climate change[J]. Science, 2012, 338(6108): 788-791.

DOI PMID

[5]
Lu E, Luo Y, Zhang R, et al. Regional atmospheric anomalies responsible for the 2009—2010 severe drought in China[J]. Journal of Geophysical Research Atmospheres, 2011, 116: D21114, doi: 10.1029/2011JD015706.

[6]
Viste E, Korecha D, Sorteberg A. Recent drought and precipitation tendencies in Ethiopia[J]. Theoretical & Applied Climatology, 2013, 112(3): 535-551.

[7]
Cook B I, Cook E R, Smerdon J E, et al. North American megadroughts in the Common Era: Reconstructions and simulations[J]. Wiley Interdisciplinary Reviews-Climate Change, 2016, 7(3): 411-432.

DOI

[8]
Cook E R, Woodhouse C A, Eakin C M, et al. Long-term aridity changes in the western United States[J]. Science, 2004, 306(5698): 1015-1018.

PMID

[9]
Seager R, Ting M F. Decadal drought variability over North America: Mechanisms and predictability[J]. Current Climate Change Reports, 2017, 3(2): 141-149.

DOI

[10]
Ma Z G, Fu C B. Some evidence of drying trend over northern China from 1951 to 2004[J]. Chinese Science Bulletin, 2006, 51(23): 2913-2925.

DOI

[11]
Qin Y M, Ning L, Li L H, et al. Assessing the modern multi-decadal scale aridification over the northern China from a historical perspective[J]. Journal of Geophysical Research-Atmospheres, 2022, 127(3): e2021JD035622, doi: 10.1029/2021JD035622.

[12]
Ning L, Bradley R S. Winter climate extremes over the northeastern United States and southeastern Canada and teleconnections with large-scale modes of climate variability[J]. Journal of Climate, 2015, 28(6): 2475-2493.

DOI

[13]
Ning L, Qian Y F. Interdecadal change in extreme precipitation over south China and its mechanism[J]. Advances in Atmospheric Sciences, 2009, 26(1): 109-118.

DOI

[14]
Seager R, Graham N, Herweijer C, et al. Blueprints for Medieval hydroclimate[J]. Quaternary Science Reviews, 2007, 26(19-21): 2322-2336.

DOI

[15]
Zhang L X, Zhou T J. Drought over east Asia: A review[J]. Journal of Climate, 2015, 28(8): 3375-3399.

DOI

[16]
Qian C, Zhou T J. Multidecadal variability of north China aridity and its relationship to PDO during 1900—2010[J]. Journal of Climate, 2014, 27(3): 1210-1222.

DOI

[17]
Wang X J, Pang G J, Yang M X, et al. Precipitation changes in the Qilian Mountains associated with the shifts of regional atmospheric water vapour during 1960—2014[J]. International Journal of Climatology, 2018, 38(12): 4355-4368.

DOI

[18]
张文杰, 程维明, 李宝林, 等. 气候变化下的祁连山地区近40年多年冻土分布变化模拟[J]. 地理研究, 2014, 33(7): 1275-1284.

DOI

[ Zhang Wenjie, Cheng Weiming, Li Baolin, et al. Simulation of the permafrost distribution on Qilian Mountains over past 40 years under the influence of climate change[J]. Geographical Research, 2014, 33(7): 1275-1284. ]

DOI

[19]
刘兰娅, 勾晓华, 张芬, 等. 升温对祁连山东部青海云杉径向生长的影响[J]. 应用生态学报, 2021, 32(10): 3576-3584.

DOI

[ Liu Lanya, Gou Xiaohua, Zhang Fen, et al. Effects of warming on radial growth of Picea crassifolia in the eastern Qilian Mountains, China[J]. Chinese Journal of Applied Ecology, 2021, 32(10): 3576-3584. ]

DOI

[20]
Luo L H, Ma W, Zhuang Y L, et al. The impacts of climate change and human activities on alpine vegetation and permafrost in the Qinghai-Tibet engineering corridor[J]. Ecological Indicators, 2019, 93: 24-35.

DOI

[21]
晋子振, 秦翔, 赵求东, 等. 祁连山西段老虎沟流域消融季径流变化特征研究[J]. 干旱区地理, 2023, 46(2):178-190.

[ Jin Zizhen, Qin Xiang, Zhao Qiudong, et al. Characteristics of runoff variation during ablation season in Laohugou watershed of western Qilian Mountains[J]. Arid Land Geography, 2023, 46(2): 178-190. ]

[22]
杨金虎, 江志红, 王鹏祥, 等. 中国年极端降水事件的时空分布特征[J]. 气候与环境研究, 2018, 51(1): 75-83.

[ Yang Jinhu, Jiang Zhihong, Wang Pengxiang, et al. Temporal and spatial characteristic of extreme precipitation event in China[J]. Climatic and Environmental Research, 2018, 51(1): 75-83. ]

[23]
程鹏, 孔祥伟, 罗汉, 等. 近60 a以来祁连山中部气候变化及其径流响应研究[J]. 干旱区地理, 2020, 43(5): 1192-1201.

[ Cheng Peng, Kong Xiangwei, Luo Han, et al. Climate change and its runoff response in the middle section of the Qilian Mountains in the past 60 years[J]. Arid Land Geography, 2020, 43(5): 1192-1201. ]

[24]
Zhang Y, Shao X M, Yin Z Y, et al. Characteristics of extreme droughts inferred from tree-ring data in the Qilian Mountains, 1700—2005[J]. Climate Research, 2011, 50(2-3): 141-159.

DOI

[25]
Gou X H, Gao L L, Deng Y, et al. An 850-year tree-ring-based reconstruction of drought history in the western Qilian Mountains of northwestern China[J]. International Journal of Climatology, 2015, 35(11): 3308-3319.

DOI

[26]
Yang B, Qin C, Wang J L, et al. A 3500-year tree-ring record of annual precipitation on the northeastern Tibetan Plateau[J]. Proceedings of the National Academy of Sciences of the United States of America, 2014, 111(8): 2903-2908.

DOI PMID

[27]
Gou X H, Deng Y, Gao L L, et al. Millennium tree-ring reconstruction of drought variability in the eastern Qilian Mountains, northwest China[J]. Climate Dynamics, 2015, 45(7-8): 1761-1770.

DOI

[28]
Yang B, Kang S Y, Ljungqvist F C, et al. Drought variability at the northern fringe of the Asian summer monsoon region over the past millennia[J]. Climate Dynamics, 2014, 43(3-4): 845-859.

DOI

[29]
施雅风, 沈永平, 胡汝骥. 西北气候由暖干向暖湿转型的信号、影响和前景初步探讨[J]. 冰川冻土, 2002, 24(3): 219-226.

[ Shi Yafeng, Shen Yongping, Hu Ruji. Preliminary study on signal, impact and foreground of climatic shift from warm-dry to warm-humid in northwest China[J]. Journal of Glaciology and Geocryology, 2002, 24(3): 219-226. ]

[30]
丁一汇, 柳艳菊, 徐影, 等. 全球气候变化的区域响应: 中国西北地区气候“暖湿化”趋势、成因及预估研究进展与展望[J]. 地球科学进展, 2023, 38(6): 551-562.

DOI

[ Ding Yihui, Liu Yanju, Xu Ying, et al. Regional responses to global climate change: Progress and prospects for trend, causes, and projection of climatic warming-wetting in northwest China[J]. Advances in Earth Science, 2023, 38(6): 551-562. ]

DOI

[31]
Shi H, Wang B, Cook E R, et al. Asian summer precipitation over the past 544 years reconstructed by merging tree rings and historical documentary records[J]. Journal of Climate, 2018, 31(19): 7845-7861.

DOI

[32]
Cook E R, Anchukaitis K J, Buckley B M, et al. Asian monsoon failure and megadrought during the Last Millennium[J]. Science, 2010, 328(5977): 486-489.

DOI PMID

[33]
Shi F, Zhao S, Guo Z T, et al. Multi-proxy reconstructions of May-September precipitation field in China over the past 500 years[J]. Climate of the Past, 2017, 13(12): 1919-1938.

DOI

[34]
Liu Y, Zheng J Y, Hao Z X, et al. A dataset of standard precipitation index reconstructed from multi-proxies over Asia for the past 300 years[J]. Earth System Science Data, 2022, 14(12): 5717-5735.

DOI

[35]
Feng S, Hu Q, Wu Q R, et al. A gridded reconstruction of warm season precipitation for Asia spanning the Past Half Millennium[J]. Journal of Climate, 2013, 26(7): 2192-2204.

DOI

[36]
Liu Y, Hao Z X, Zhang X Z, et al. Intercomparisons of multiproxy-based gridded precipitation datasets in monsoon Asia: Cross-validation and spatial patterns with different phase combinations of multidecadal oscillations[J]. Climatic Change, 2021, 165(1-2): 31, doi: 10.1007/s10584-021-03072-6.

[37]
Lean J L. Estimating solar irradiance since 850 CE[J]. Earth and Space Science, 2018, 5(4): 133-149.

DOI

[38]
Crowley T J. Causes of climate change over the past 1000 years[J]. Science, 2000, 289(5477): 270-277.

PMID

[39]
Macdonald G M, Case R A. Variations in the Pacific Decadal Oscillation over the past millennium[J]. Geophysical Research Letters, 2005, 32(8): L08703, doi: 10.1029/2005GL022478.

[40]
Wang J L, Yang B, Ljungqvist F C, et al. Internal and external forcing of multidecadal Atlantic climate variability over the past 1200 years[J]. Nature Geoscience, 2017, 10(7): 512-517.

DOI

[41]
Ault T R, George S S, Smerdon J E, et al. A robust null hypothesis for the potential causes of megadrought in western north America[J]. Journal of Climate, 2018, 31(1): 3-24.

DOI

[42]
Stevenson S, Overpeck J T, Fasullo J, et al. Climate variability, volcanic forcing, and Last Millennium hydroclimate extremes[J]. Journal of Climate, 2018, 31(11): 4309-4327.

DOI

[43]
刘旻霞, 焦骄, 潘竟虎, 等. 青海省植被净初级生产力(NPP)时空格局变化及其驱动因素[J]. 生态学报, 2020, 40(15): 5306-5317.

[ Liu Minxia, Jiao Jiao, Pan Jinghu, et al. Spatial and temporal patterns of planting NPP and its driving factors in Qinghai Province[J]. Acta Ecologica Sinica, 2020, 40(15): 5306-5317. ]

[44]
徐勇, 戴强玉, 黄雯婷, 等. 2000—2020年西南地区植被NDVI时空变化及驱动机制探究[J]. 环境科学, 2023, 44(1): 323-335.

[ Xu Yong, Dai Qiangyu, Huang Wenting, et al. Spatio-temporal variation in vegetation cover and its driving mechanism exploration in southwest China from 2000 to 2020[J]. Environment Science, 2023, 44(1): 323-335. ]

DOI

[45]
苏玥, 张存厚, 阿木尔萨那, 等. 1981—2018年内蒙古典型草原季节性冻土对气候变化的响应[J]. 干旱区地理, 2022, 45(3): 684-694.

[ Su Yue, Zhang Cunhou, Amuersana, et al. Response of seasonal frozen soil to climate change on a typical steppe of Inner Mongolia during 1981—2018[J]. Arid Land Geography, 2022, 45(3): 684-694. ]

[46]
王有恒, 李丹华, 卢国阳, 等. 祁连山气候变化特征及其对水资源的影响[J]. 应用生态学报, 2022, 33(10): 2805-2812.

DOI

[ Wang Youheng, Li Danhua, Lu Guoyang, et al. Characteristics of climate change and its impact on water resources in Qilian Mountains, China[J]. Chinese Journal of Applied Ecology, 2022, 33(10): 2805-2812. ]

DOI

[47]
Tian Q H, Zhou X J, Gou X H, et al. Analysis of reconstructed annual precipitation from tree-rings for the past 500 years in the middle Qilian Mountain[J]. Science China-Earth Sciences, 2012, 55(5): 770-778.

DOI

[48]
Sun J Y, Liu Y. Drought variations in the middle Qilian Mountains, northeast Tibetan Plateau, over the last 450 years as reconstructed from tree rings[J]. Dendrochronologia, 2013, 31(4): 279-285.

DOI

[49]
刘芸芸, 张雪芹. 西北干旱区空中水资源的时空变化特征及其原因分析[J]. 气候变化研究进展, 2011, 7(6): 385-392.

[ Liu Yunyun, Zhang Xueqin. Variations of atmospheric water resources over the arid region of northwest China and its causes[J]. Advances in Climate Change Research, 2011, 7(6): 385-392. ]

[50]
Liu J A, Wang B, Wang H L, et al. Forced response of the East Asian summer rainfall over the past millennium: Results from a coupled model simulation[J]. Climate Dynamics, 2011, 36(1-2): 323-336.

DOI

[51]
Zhou T J, Li B, Man W M, et al. A comparison of the Medieval Warm Period, Little Ice Age and 20th century warming simulated by the FGOALS climate system model[J]. Chinese Science Bulletin, 2011, 56(28-29): 3028-3041.

DOI

[52]
Chen F H, Chen J H, Huang W, et al. Westerlies Asia and monsoonal Asia: Spatiotemporal differences in climate change and possible mechanisms on decadal to sub-orbital timescales[J]. Earth-Science Reviews, 2019, 192: 337-354.

DOI

[53]
Jin L Y, Chen F H, Morrill C, et al. Causes of early Holocene desertification in arid central Asia[J]. Climate Dynamics, 2012, 38(7-8): 1577-1591.

DOI

[54]
Zhang Y, Tian Q H, Gou X H, et al. Annual precipitation reconstruction since AD 775 based on tree rings from the Qilian Mountains, northwestern China[J]. International Journal of Climatology, 2011, 31(3): 371-381.

DOI

[55]
Shen C, Wang W C, Hao Z, et al. Exceptional drought events over eastern China during the last five centuries[J]. Climatic Change, 2007, 85(3-4): 453-471.

DOI

[56]
Man W M, Zhou T J, Jungclaus J H. Effects of large volcanic eruptions on global summer climate and East Asian Monsoon changes during the Last Millennium: Analysis of MPI-ESM simulations[J]. Journal of Climate, 2014, 27(19): 7394-7409.

DOI

[57]
Iles C E, Hegerl G C, Schurer A P, et al. The effect of volcanic eruptions on global precipitation[J]. Journal of Geophysical Research-Atmospheres, 2013, 118(16): 8770-8786.

DOI

[58]
Zhuo Z H, Gao C C, Pan Y Q. Proxy evidence for China’s monsoon precipitation response to volcanic aerosols over the past seven centuries[J]. Journal of Geophysical Research-Atmospheres, 2014, 119(11): 6638-6652.

DOI

[59]
Hernandez A, Martin-Puertas C, Moffa-Sanchez P, et al. Modes of climate variability: Synthesis and review of proxy-based reconstructions through the Holocene[J]. Earth-Science Reviews, 2020, 209: 103286, doi: 10.1016/j.earscirev.2020.103286.

[60]
Fang K Y, Chen D L, Ilvonen L, et al. Oceanic and atmospheric modes in the Pacific and Atlantic Oceans since the Little Ice Age (LIA): Towards a synthesis[J]. Quaternary Science Reviews, 2019, 215: 293-307.

DOI

[61]
Si D, Ding Y H. Oceanic forcings of the interdecadal variability in East Asian summer rainfall[J]. Journal of Climate, 2016, 29(21): 7633-7649.

DOI

[62]
Mccarthy G D, Haigh I D, Hirschi J J M, et al. Ocean impact on decadal Atlantic climate variability revealed by sea-level observations[J]. Nature, 2015, 521(7553): 508-510.

DOI

[63]
Liu Y W, Chiang J C H, Chou C, et al. Atmospheric teleconnection mechanisms of extratropical North Atlantic SST influence on Sahel rainfall[J]. Climate Dynamics, 2014, 43(9-10): 2797-2811.

DOI

[64]
丁一汇, 李怡, 王遵娅, 等. 亚非夏季风的年代际变化: 大西洋多年代际振荡与太平洋年代际振荡的协同作用[J]. 大气科学学报, 2020, 43(1): 20-32.

[ Ding Yihui, Li Yi, Wang Zunya, et al. Interdecadal variation of Afro-Asian summer monsoon: Coordinated effects of AMO and PDO oceanic modes[J]. Transactions of Atmospheric Sciences, 2020, 43(1): 20-32. ]

[65]
朱益民, 杨修群. 太平洋年代际振荡与中国气候变率的联系[J]. 气象学报, 2003, 61(6): 641-654.

[ Zhu Yimin, Yang Xiuqun. Relationships between Pacific Decadal Oscillation (PDO) and climate variabilities in China[J]. Acta Meteorologica Sinica, 2003, 61(6): 641-654. ]

[66]
程乘, 朱益民, 丁黄兴, 等. 中国东部地区夏季降水和环流的年代际转型及其与PDO的联系[J]. 气象科学, 2017, 37(4): 450-457.

[ Chen Cheng, Zhu Yimin, Ding Huangxing, et al. The interdecadal shift of summer precipitation and atmospheric circulation over east China and its relationship with PDO[J]. Journal of the Meteorological Sciences, 2017, 37(4): 450-457. ]

[67]
贾艳青, 张勃. 近57年中国北方气候干湿变化及与太平洋年代际振荡的关系[J]. 土壤学报, 2019, 56(5): 1085-1097.

[ Jia Yanqing, Zhang Bo. Relationship of dry-wet climate changes in northern China in the past 57 years with Pacific Decadal Oscillation (PDO)[J]. Acta Pedologica Sinica, 2019, 56(5): 1085-1097. ]

[68]
Wang S S, Huang J P, Huang G, et al. Enhanced impacts of Indian Ocean Sea surface temperature on the dry/wet variations over northwest China[J]. Journal of Geophysical Research: Atmospheres, 2022, 127(11): e2022JD036533, doi: 10.1029/2022JD036533.

[69]
Peng D D, Zhou T J. Why was the arid and semiarid northwest China getting wetter in the recent decades?[J]. Journal of Geophysical Research-Atmospheres, 2017, 122(17): 9060-9075.

DOI

[70]
Treydte K S, Schleser G H, Helle G, et al. The twentieth century was the wettest period in northern Pakistan over the past millennium[J]. Nature, 2006, 440(7088): 1179-1182.

DOI

Outlines

/