
Remote Sensing for Natural Resources >
Consistency analysis of mapping products for wetlands of international importance in China
Received date: 2022-09-15
Revised date: 2023-08-17
Online published: 2026-06-03
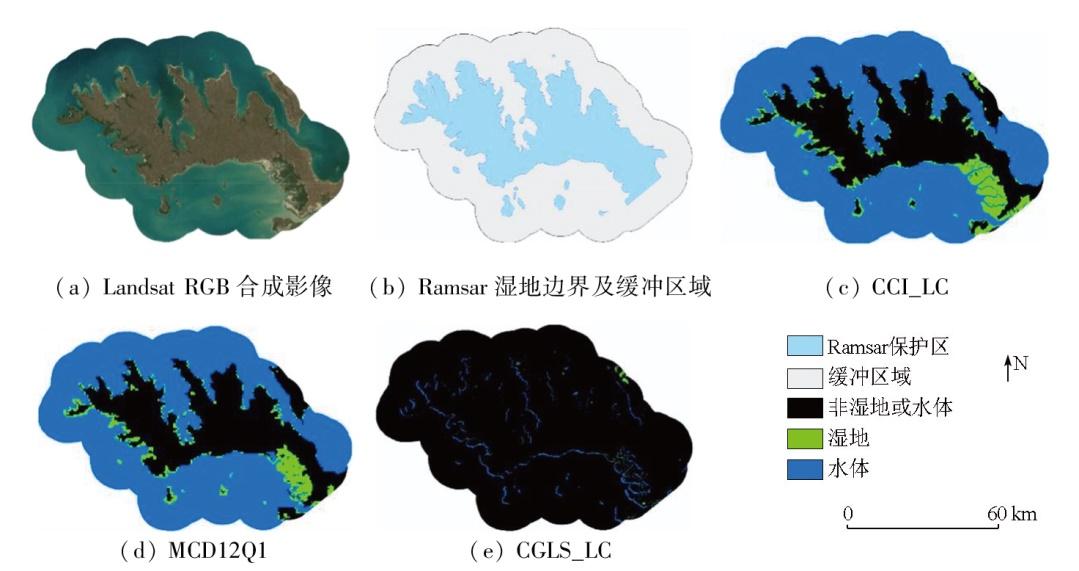
Monitoring wetland changes based on land cover mapping serves as a significant means for supervising contracting parties to the Convention on Wetlands of International Importance Especially as Waterfowl Habitat (also referred to as the Ramsar Convention) in fulfilling their obligations. However, substantial land cover mapping products available show significant differences in spatiotemporal characteristics, classification systems, and quality. This study conducted a consistency analysis of land cover mapping products for 40 wetlands of international importance in China from 2015 to 2019, aiming to provide a reference for selecting wetland mapping products and monitoring wetlands in Ramsar reserves. Using long time-series land cover mapping products CCI_LC, CGLS_LC, and MCD12Q1, this study preprocessed the data in terms of spatial and category consistency. Based on wetland classification areas, it conducted regression analysis and calculated the accuracy and uncertainty indicators of the mapping products. The results indicate that these products exhibited significant inconsistencies in wetland classification areas, with area differences averaging 6 to 10 times. Moreover, their wetland classification results were marked by low accuracy and high uncertainty. For most regions, the user accuracy (UA), producer accuracy (PA), and Kappa coefficient were below 0.1, and the standard deviation exceeded the mean. Overall, the three land cover mapping products fail to support credible monitoring of changes in wetlands of international importance.
LIAO Yuanhong , BAI Yuqi . Consistency analysis of mapping products for wetlands of international importance in China[J]. Remote Sensing for Natural Resources, 2025 , 37(6) : 41 -48 . DOI: 10.6046/zrzyyg.2022503
表1 3种地表覆盖制图产品的特性Tab.1 Characteristics of 3 kinds of land cover mapping products |
| 数据集 | 湿地/水体 分类体系 | 数据源 | 时间范围 | 空间分辨率/m | 准确度评估 |
|---|---|---|---|---|---|
| MCD12Q1[19] | LC_Type1(11:永久湿地); LC_Type3(3:水体; 27:木本湿地; 50:草本湿地) | MODIS | 2001—2020年 | 500 | LC_Type1 11 (UA: 96.4%; PA: 70.6%) |
| CCI_LC[20] | 160:被淡水或微咸水淹没的树; 170:被咸水淹没的树; 180:被咸水、微咸水、淡水淹没的灌木或草本植被; 210:水体 | MERIS, SPOT, PROBA | 1992—2020年 | 300 | 160 (UA: 26%; PA: 86%) 170 (UA: 75%; PA: 86%) 180 (UA: 53%; PA: 24%) |
| CGLS_LC[21] | 80:永久水体; 90:草本植被 | PROBA-V | 2015—2019年 | 100 | 90 (UA: 44.9%; PA: 46.9%) |
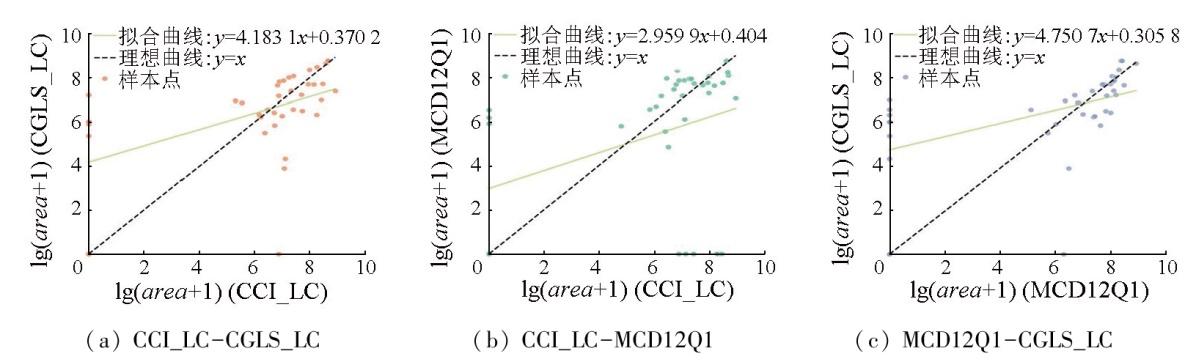
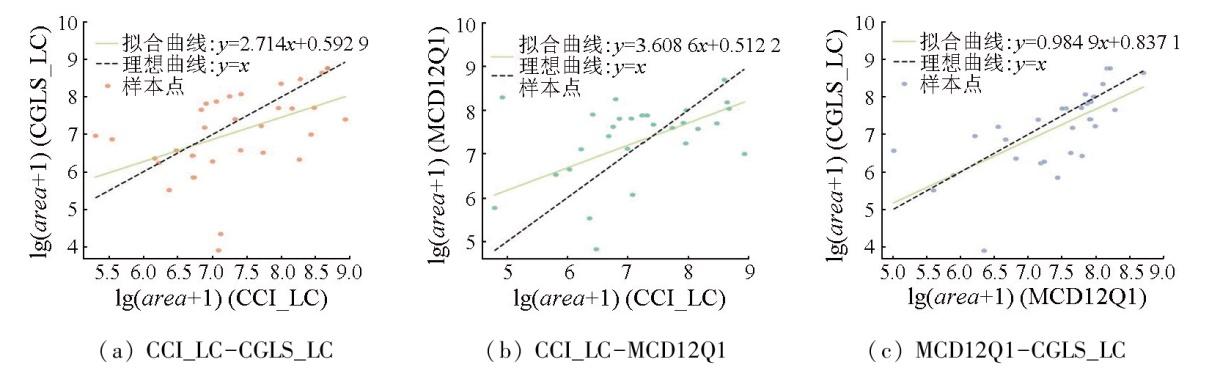
图3 剔除未分类出湿地的区域后产品间的湿地分类面积的回归分析结果Fig.3 Regression result between classification area of wetlands from different products after removing unclassified wetland areas |
表2 剔除未分类出湿地的区域后产品间回归分析的评估结果Tab.2 Evaluation result of regression analysis among products after removing unclassified wetland areas |
| 产品 | RMSE | r | R2 |
|---|---|---|---|
| CCI_LC-CGLS_LC | 1.109 7 | 0.476 5 | -0.457 6 |
| CCI_LC-MCD12Q1 | 0.872 4 | 0.571 2 | 0.214 3 |
| MCD12Q1-CGLS_LC | 0.821 1 | 0.679 8 | 0.097 6 |
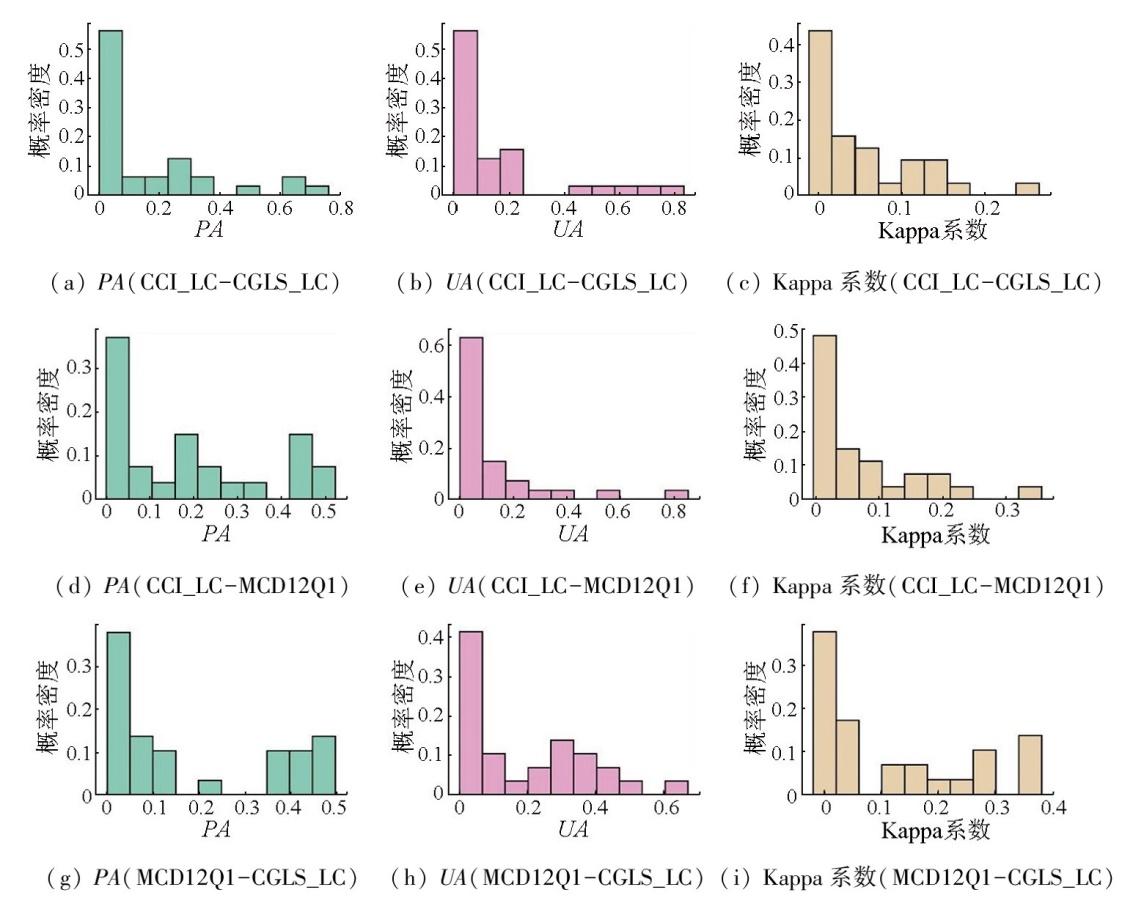
表3 产品间准确度与不确定度指标结果Tab.3 Result of accuracy and uncertainty metrics among products |
| 产品 | 未分类出湿 地的样本数 | 未分类出湿地 的样本的占比/% | UA | PA | Kappa系数 | |||
|---|---|---|---|---|---|---|---|---|
| 均值 | 标准差 | 均值 | 标准差 | 均值 | 标准差 | |||
| CCI_LC-CGLS_LC | 8 | 20.0 | 0.158 6 | 0.230 3 | 0.156 1 | 0.217 1 | 0.051 9 | 0.665 0 |
| CCI_LC-MCD12Q1 | 13 | 32.5 | 0.130 6 | 0.202 5 | 0.192 5 | 0.130 6 | 0.074 1 | 0.091 1 |
| MCD12Q1-CGLS_LC | 11 | 27.5 | 0.190 1 | 0.186 7 | 0.182 9 | 0.195 9 | 0.121 5 | 0.138 0 |
| [1] |
Ramsar Convention Secretariat. The Ramsar Convention Manual:A guide to the Convention on Wetlands (Ramsar,Iran,1971),6th ed[R]. Gland, Switzerland: Ramsar Convention Secretariat, 2013.
|
| [2] |
Ramsar Convention Secretariat. The Fourth Ramsar Strategic Plan 2016—2024[R]// Ramsar Handbooks for the Wise Use of Wetlands,5th Edition,Vol.2.Gland, Switzerland: Ramsar Convention Secretariat, 2016.
|
| [3] |
Ramsar Convention Secretariat. Global Wetland Outlook:Special Edition 2021[R]. Gland, Switzerland: Ramsar Convention Secretariat, 2021.
|
| [4] |
|
| [5] |
|
| [6] |
|
| [7] |
|
| [8] |
|
| [9] |
|
| [10] |
|
| [11] |
|
| [12] |
|
| [13] |
|
| [14] |
Ramsar Convention Secretariat. Global Wetland Outlook:State of the World’s Wetlands and Their Services to People[R]. Gland, Switzerland: Ramsar Convention Secretariat, 2018.
|
| [15] |
|
| [16] |
|
| [17] |
|
| [18] |
|
| [19] |
|
| [20] |
|
| [21] |
|
| [22] |
|
| [23] |
|
| [24] |
|
| [25] |
|
| [26] |
|
| [27] |
|
| [28] |
|
| [29] |
|
| [30] |
|
| [31] |
|
| [32] |
|
| [33] |
|
| [34] |
|
| [35] |
|
| [36] |
|
| [37] |
|
| [38] |
|
| [39] |
|
| [40] |
|
| [41] |
|
| [42] |
|
| [43] |
|
| [44] |
张海英, 牛振国, 许盼盼. 大型国际重要湿地边界及遥感分类数据集(2001、2013)[J]. 全球变化数据学报, 2017, 1(2):230-238.
|
| [45] |
|
| [46] |
|
| [47] |
|
| [48] |
|
| [49] |
|
| [50] |
国家市场监督管理总局, 国家标准化管理委员会. GB/T 36296—2018 遥感产品真实性检验导则[S]. 北京: 中国标准出版社, 2018.
State Administration for Market Regulation, National standardization Administration. GB/T 36296—2018 Guide for the validation of remote sensing products[S]. Beijing: Standards Press of China, 2018.
|
| [51] |
国家市场监督管理总局, 国家标准化管理委员会. GB/T 41536—2022土地覆被遥感产品真实性检验[S]. 北京: 中国标准出版社, 2022.
State Administration for Market Regulation, National standardization Administration. GB/T 41536—2022 Validation of land cover remote sensing products[S]. Beijing: Standards Press of China, 2022.
|
/
| 〈 |
|
〉 |