
Remote Sensing for Natural Resources >
Forest disturbances in the South China hilly and mountainous belt based on long time-series Landsat data
Received date: 2024-11-02
Revised date: 2025-02-10
Online published: 2026-06-03
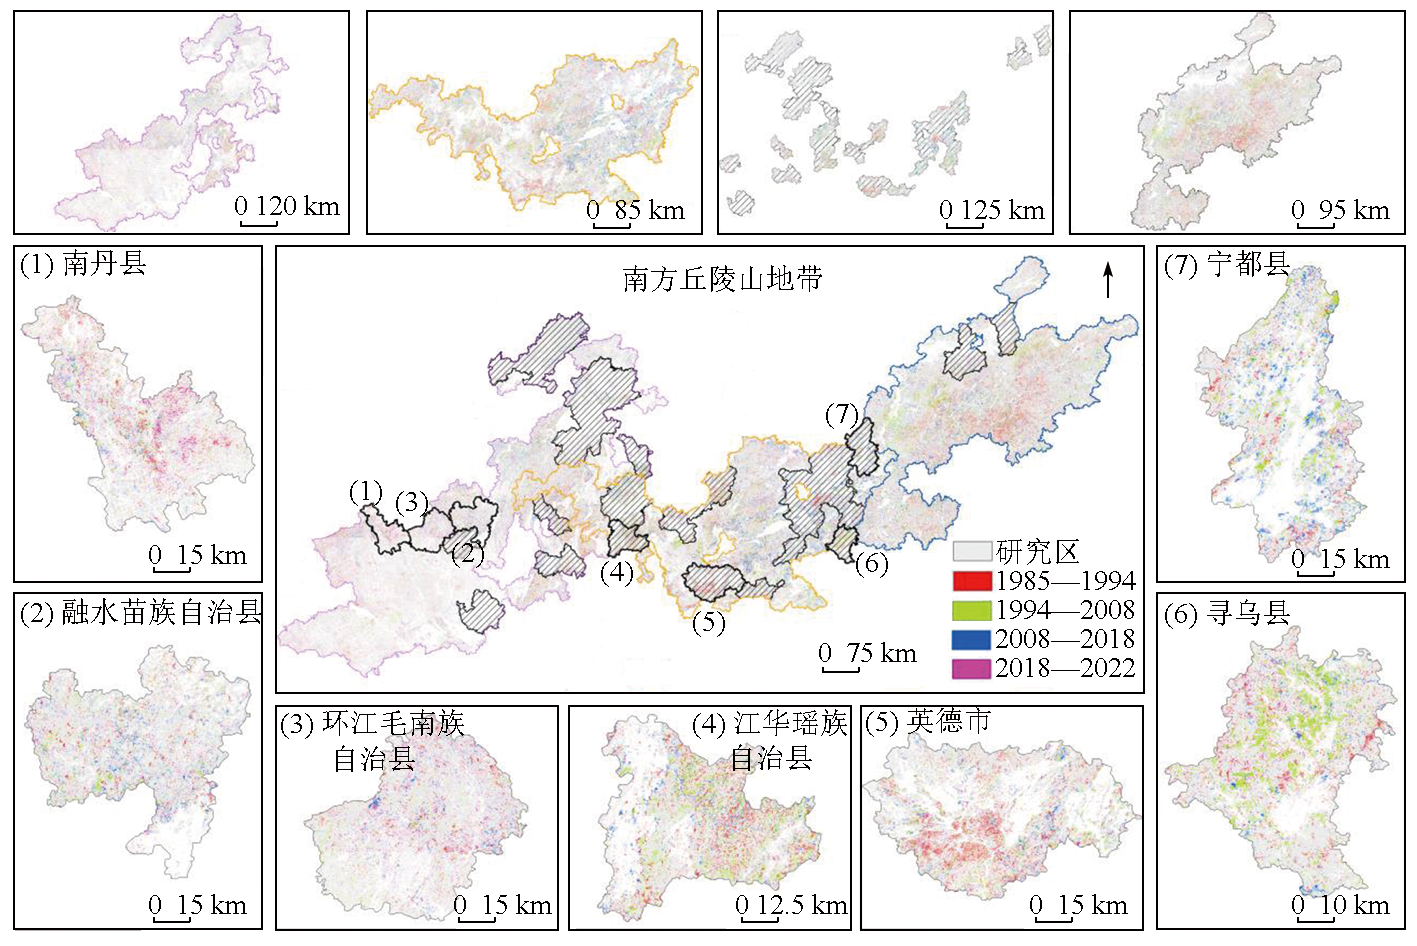
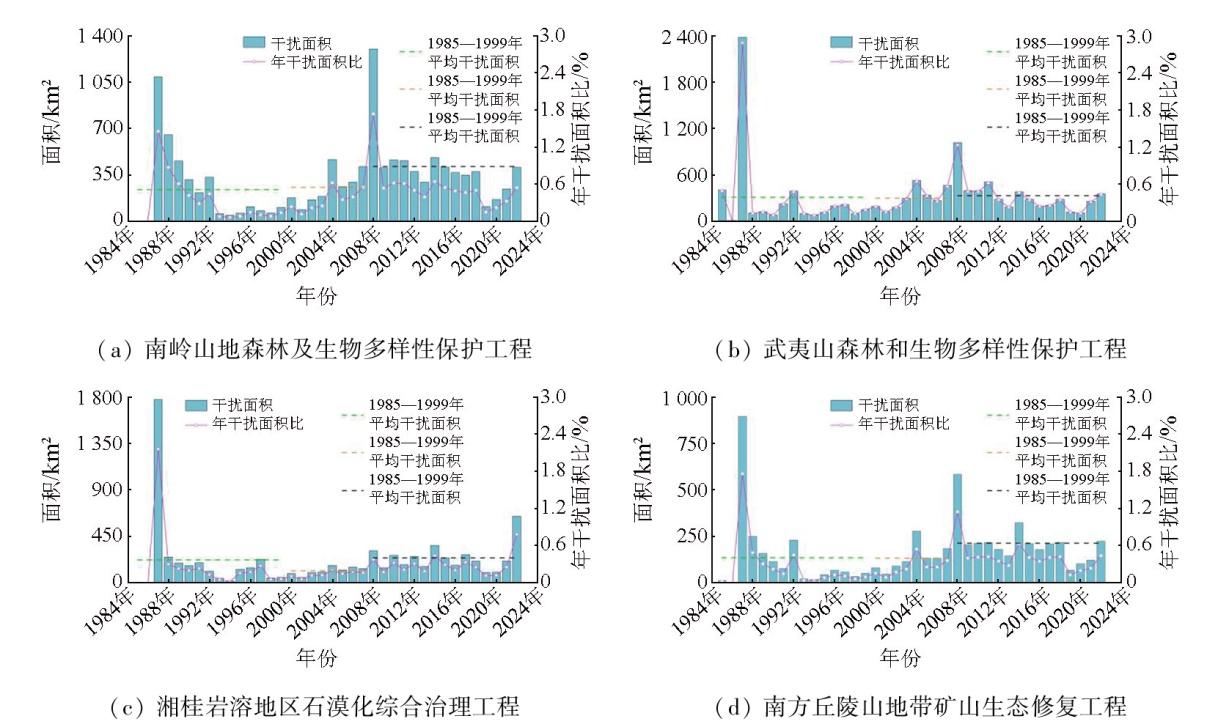
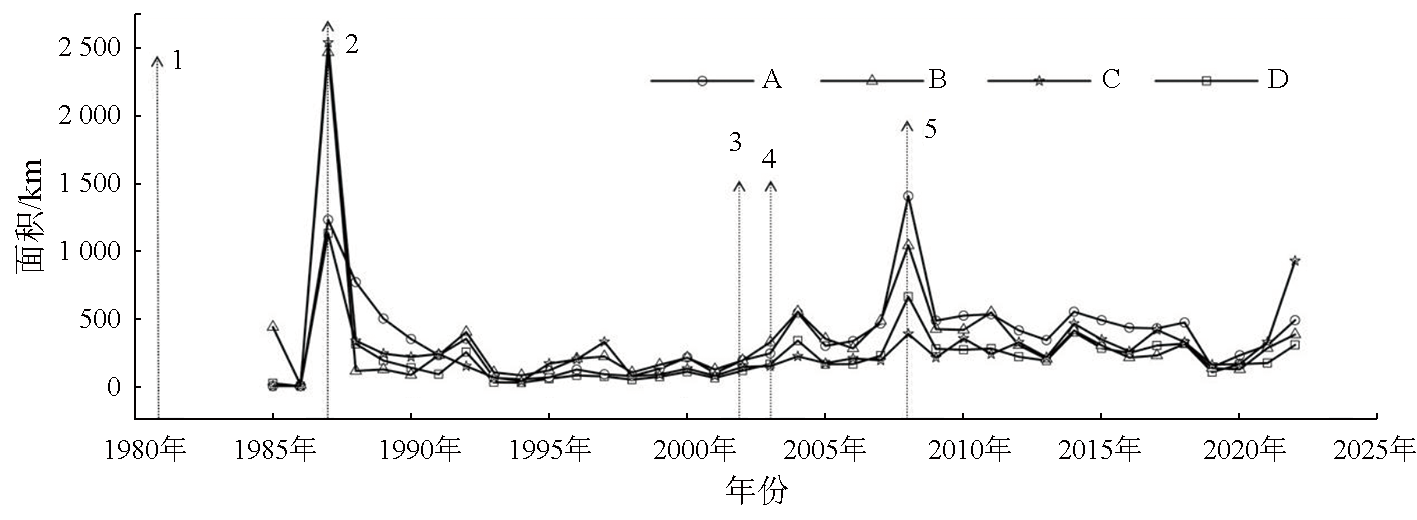
The South China hilly and mountainous belt is one of the “three regions and four belts” involved in China's major ecosystem conservation and restoration program. This belt hosts the largest and most well-preserved middle subtropical forest ecosystem at the same latitudes globally, playing a crucial role in ensuring the ecological security in South and Southwest China. Based on the Google Earth Engine (GEE) platform, this study conducted preliminary monitoring of disturbances in this belt using the LandTrendr algorithm and the Jeffries-Matusita (JM) distance. It further applied the random forest algorithm to relevant disturbance outputs, enabling the monitoring and analysis of forest disturbances in this belt from 1985 to 2022. The results indicate that the total forest disturbance area in this belt reached 38 564.62 km2 during the study period. Specifically, the disturbance areas of four ecological restoration projects decreased in the following order: Wuyi Mountains forests (12 040.27 km2), Nanling Mountains forests (11 820.79 km2), Hunan and Guangxi karst areas (8 228.97 km2), and mining areas (6 474.59 km2). Based on the 38-year forest loss dataset, this study analyzed the spatiotemporal variations in forest disturbances within this belt, revealing significant spatiotemporal forest disturbances. Spatially, forest disturbances were characterized by distinct geographic clustering. Temporally, the forest loss areas under four ecological restoration projects experienced several stages of change. Despite similar critical transition points and interannual variation patterns, differences in forest resources, climate, and economic conditions led to variations in the areas and trends of forest loss. Besides, the implementation of forestry policies somewhat influenced the forest loss trend. Overall, this study provides a scientific basis and decision-making reference for the management of forest ecosystems within this belt.
PEI Du , YUAN Wubin , LI Hengkai . Forest disturbances in the South China hilly and mountainous belt based on long time-series Landsat data[J]. Remote Sensing for Natural Resources, 2025 , 37(6) : 241 -250 . DOI: 10.6046/zrzyyg.2024355
表1 LandTrendr算法参数设置Tab.1 Parameters used in LandTrendr |
| 参数 | 描述 | 取值 |
|---|---|---|
| maxSegments | 最大分段数 | 8 |
| SpikeThreshold | 如果相邻时间点指数值差异百分比小于该值,则被认为是异常值 | 0.9 |
| vertxCountOvershoot | 在初始阶段的潜在节点回归中可以超过的节点数 | 0 |
| preventOneYearRecovery | 是否阻止一年后恢复的情况 | 是 |
| recoveryThreshold | 如果某个分割段的恢复率大于该值的倒数,那么这个分割段将会被移除 | 0.5 |
| pvalThreshold | 回归分析中F检验的p值,超过该值的话,则认为该像元没有发生变化 | 0.05 |
| bestModelProportion | 简单模型的选择规则,如果超过该值,则被选中 | 0.75 |
| minObservationsNeeded | 拟合中需要的最少观测数 | 6 |
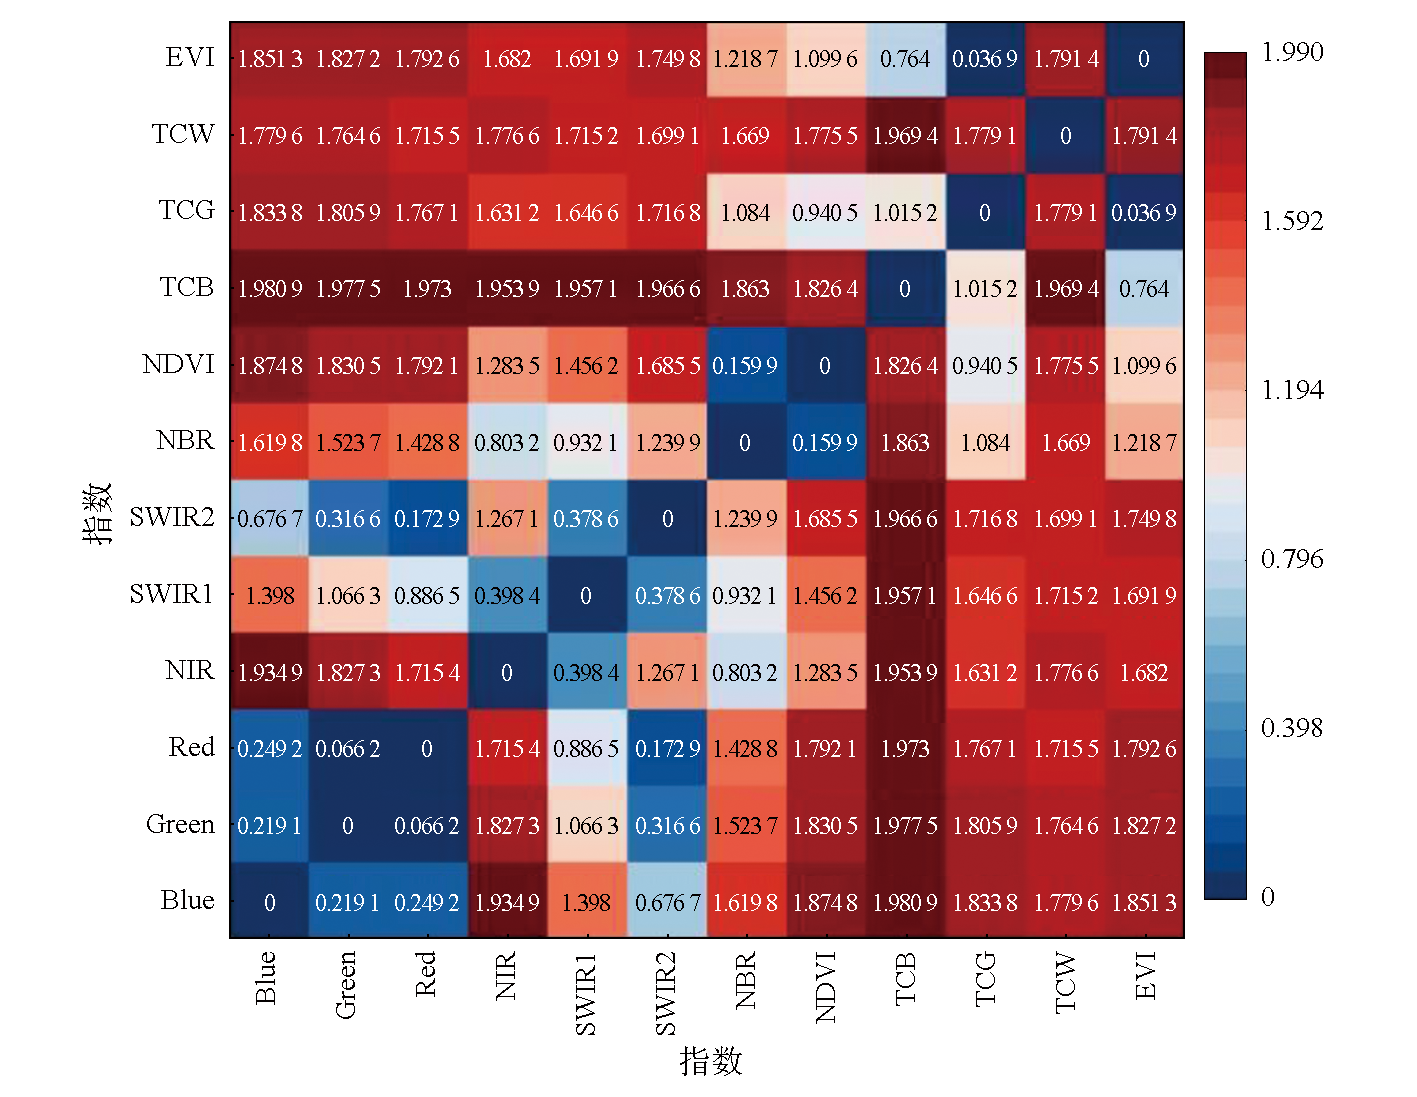
表2 光谱指数计算公式Tab.2 Calculation formula for spectral indices |
| 指数 | 公式 |
|---|---|
| 归一化植被指数 (normalized difference vegetation index,NDVI) | $NDVI=\frac{(NIR-RED)}{(NIR+RED)}$ |
| 增强型植被指数 (vegetation enhancement index,EVI) | $EVI=\frac{(NIR-RED)\times 2.5}{(NIR+6\times RED-7.5\times BLUE+1)}$ |
| 归一化燃烧指数 (normalized burning index,NBR) | $NBR=\frac{(NIR-SWIR2)}{(NIR+SWIR2)}$ |
| 缨帽变换亮度指数 (TCT conversion brightness index,TCB) | $\begin{array}{l}TCW=0.204\mathrm{ }3BLUE+0.415\mathrm{ }8GREEN+0.552\mathrm{ }4RED+0.574\mathrm{ }1NIR+\\ 0.312\mathrm{ }4SWIR1+0.230\mathrm{ }3SWIR2\end{array}$ |
| 缨帽变换湿度指数 (TCT conversion humidity index,TCW) | $\begin{array}{l}TCW=0.031\mathrm{ }5BLUE+0.202\mathrm{ }1GREEN+0.310\mathrm{ }2RED+0.159\mathrm{ }4NIR-\\ 0.680\mathrm{ }6SWIR1-0.610\mathrm{ }9SWIR2\end{array}$ |
| 缨帽变换绿度指数 (TCT conversion greenness index,TCG) | $\begin{array}{l}TCG=-0.160\mathrm{ }3BLUE-0.281\mathrm{ }9GREEN-0.493\mathrm{ }4RED+0.794\mathrm{ }0NIR-\\ 0.000\mathrm{ }2SWIR1-0.144\mathrm{ }6SWIR2\end{array}$ |
J=2(1-e-B),
| [1] |
|
| [2] |
|
| [3] |
|
| [4] |
|
| [5] |
潘丹, 陈寰, 孔凡斌. 1949年以来中国林业政策的演进特征及其规律研究——基于283个涉林规范性文件文本的量化分析[J]. 中国农村经济, 2019(7):89-108.
|
| [6] |
|
| [7] |
|
| [8] |
|
| [9] |
|
| [10] |
|
| [11] |
|
| [12] |
|
| [13] |
|
| [14] |
|
| [15] |
王李娟, 孔钰如, 杨小冬, 等. 基于特征优选随机森林算法的农耕区土地利用分类[J]. 农业工程学报, 2020, 36(4):244-250.
|
| [16] |
|
| [17] |
|
| [18] |
|
| [19] |
|
| [20] |
傅伯杰, 王晓峰, 冯晓明, 等. 国家生态屏障区生态系统评估[M]. 北京: 科学出版社, 2017.
|
| [21] |
|
| [22] |
|
| [23] |
el Rosario González-Moradas M,
|
| [24] |
|
| [25] |
|
| [26] |
|
| [27] |
|
| [28] |
|
| [29] |
李亚飞, 刘高焕. 澜沧江流域植被覆盖变化特征及其与气候因子的关系[J]. 资源科学, 2012, 34(7):1214-1221.
|
| [30] |
|
| [31] |
|
| [32] |
|
| [33] |
朱玮晗, 林金煌, 杨舒棋, 等. 福建省县域森林损失时空演变特征及其影响因素分析[J]. 生态与农村环境学报, 2024, 40(4):499-512.
|
| [34] |
刘双, 阮宏华. 基于地统计学的广东省和广西省森林生物量和NPP空间格局分析[J]. 生态学杂志, 2013, 32(9):2502-2509.
|
| [35] |
|
| [36] |
韦西勤. 我国速生产林现状与存在的问题[J]. 林业调查规划, 2010(5):115-118.
|
/
| 〈 |
|
〉 |