
Remote Sensing for Natural Resources >
Deep learning-based remote sensing interpretation and its reliability verification for hydroxyl alteration information in the East Qinling Mountains
Received date: 2024-11-19
Revised date: 2025-04-10
Online published: 2026-06-03
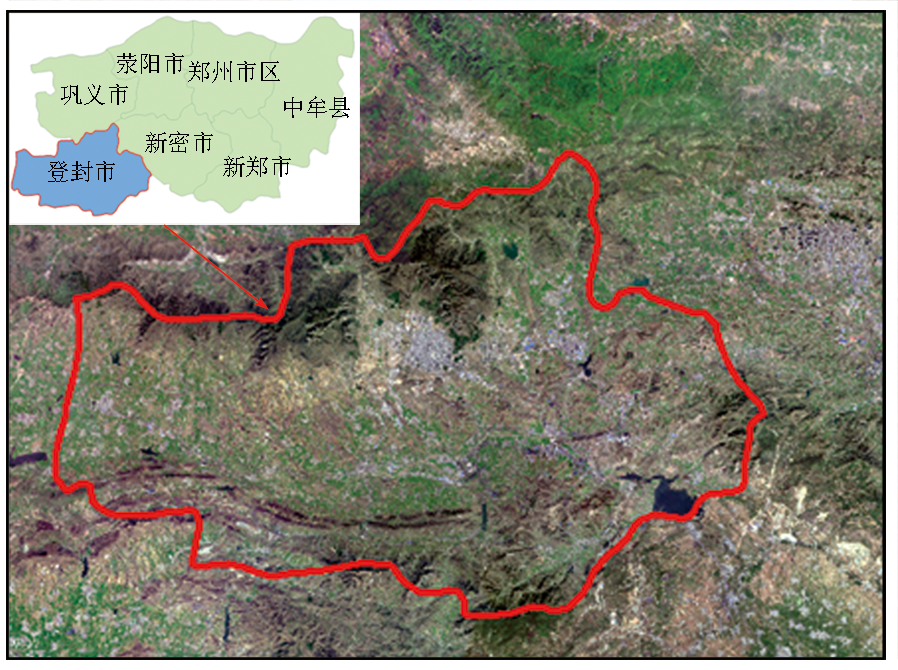
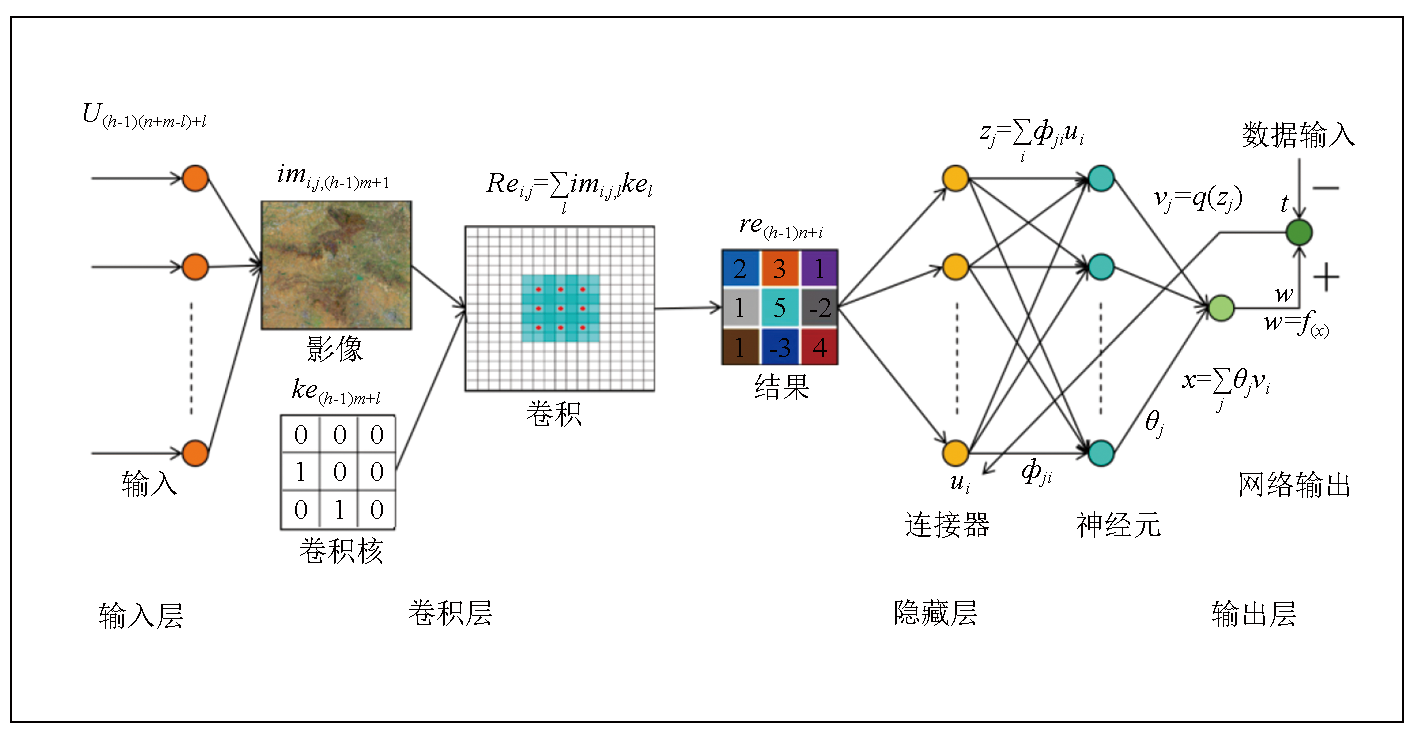
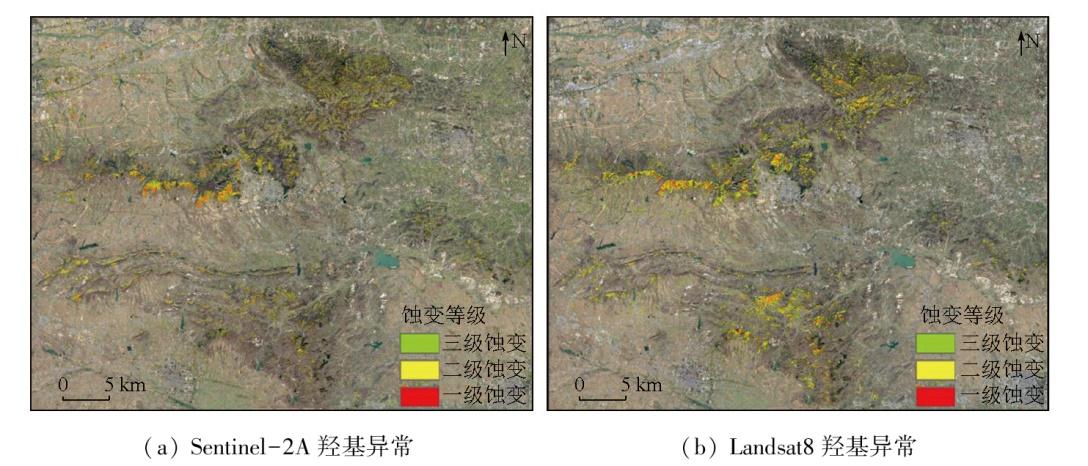
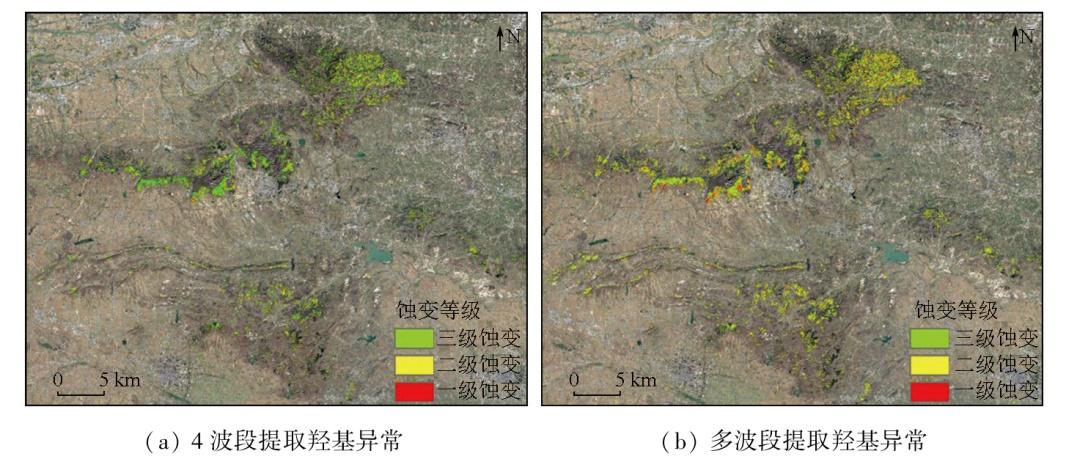
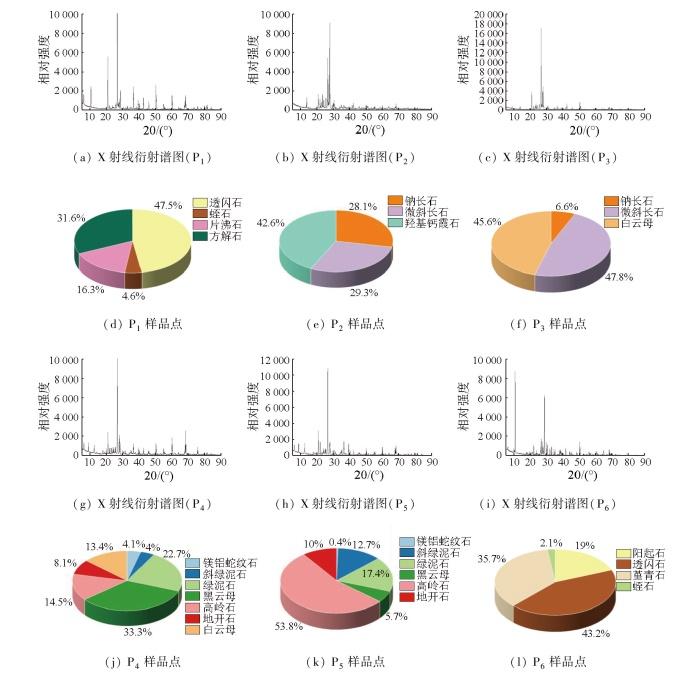
The East Qinling Mountains, located in the eastern Qinling orogen between the North China and Yangtze plates, boast the largest Mo-Au-W polymetallic metallogenic belt in China. Given that alteration played a key role in the mineralization process, its information extraction and distribution characteristics can provide critical insights for analyzing the mineralization mechanisms. To explore a more efficient method for extracting alteration information, this study investigated Dengfeng City in the East Qinling Mountains using data from the Sentinel-2A and Landsat-8 sensors. Data processing and analysis were conducted based on the Google Earth Engine (GEE) platform, and deep learning was applied to the extraction of alteration information. To improve the extraction efficiency, the information about vegetation, water bodies, and buildings was extracted first using the normalized difference vegetation index (NDVI), modified normalized difference water index (MNDWI), and normalized difference built-up index (NDBI), respectively. Subsequently, the interference information was masked by generating binary images using the threshold segmentation method. In combination with the spectral curves of typical hydroxyl minerals, the bands used to extract hydroxyl alteration information were determined. Then, the initial alteration information was extracted using the principal component analysis (PCA) method, and the pixels that overlapped spatially and exhibited concentrated information and high alteration levels were selected as labels to train the deep learning model. The potential information of remote sensing images was further extracted using the convolutional neural network (CNN) model that integrated multi-band data. Finally, in combination with the linear structure maps and mineralization anomalies of the target area, rock and soil samples were collected from the corresponding locations, and their main components were determined using X-ray fluorescence spectroscopy (XRF) and X-ray diffraction (XRD) analysis. In this manner, the reliability of the alteration information extracted was verified. The results indicate that compared to the PCA method alone, the CNN model can extract more comprehensive and clearer hydroxyl alteration information that was more easily graded. The samples collected at the field sampling points all contained minerals with hydroxyl alteration, such as muscovite, biotite, and chlorite. The laboratory XRF and XRD analysis results were consistent with the hydroxyl alteration information extracted using the CNN model. This verifies the reliability and efficiency of the interpretations of hydroxyl alteration information extracted using the deep learning-based CNN model. The results of this study can provide a theoretical and technical basis for remote sensing prospecting in the East Qinling Mountains.
LI Chunyi , ZHAO Pengxiang , DING Laizhong , WANG Wenjie , GAO Yantao , MAI Zhiyao , GUO Yaxing . Deep learning-based remote sensing interpretation and its reliability verification for hydroxyl alteration information in the East Qinling Mountains[J]. Remote Sensing for Natural Resources, 2025 , 37(6) : 228 -240 . DOI: 10.6046/zrzyyg.2024375
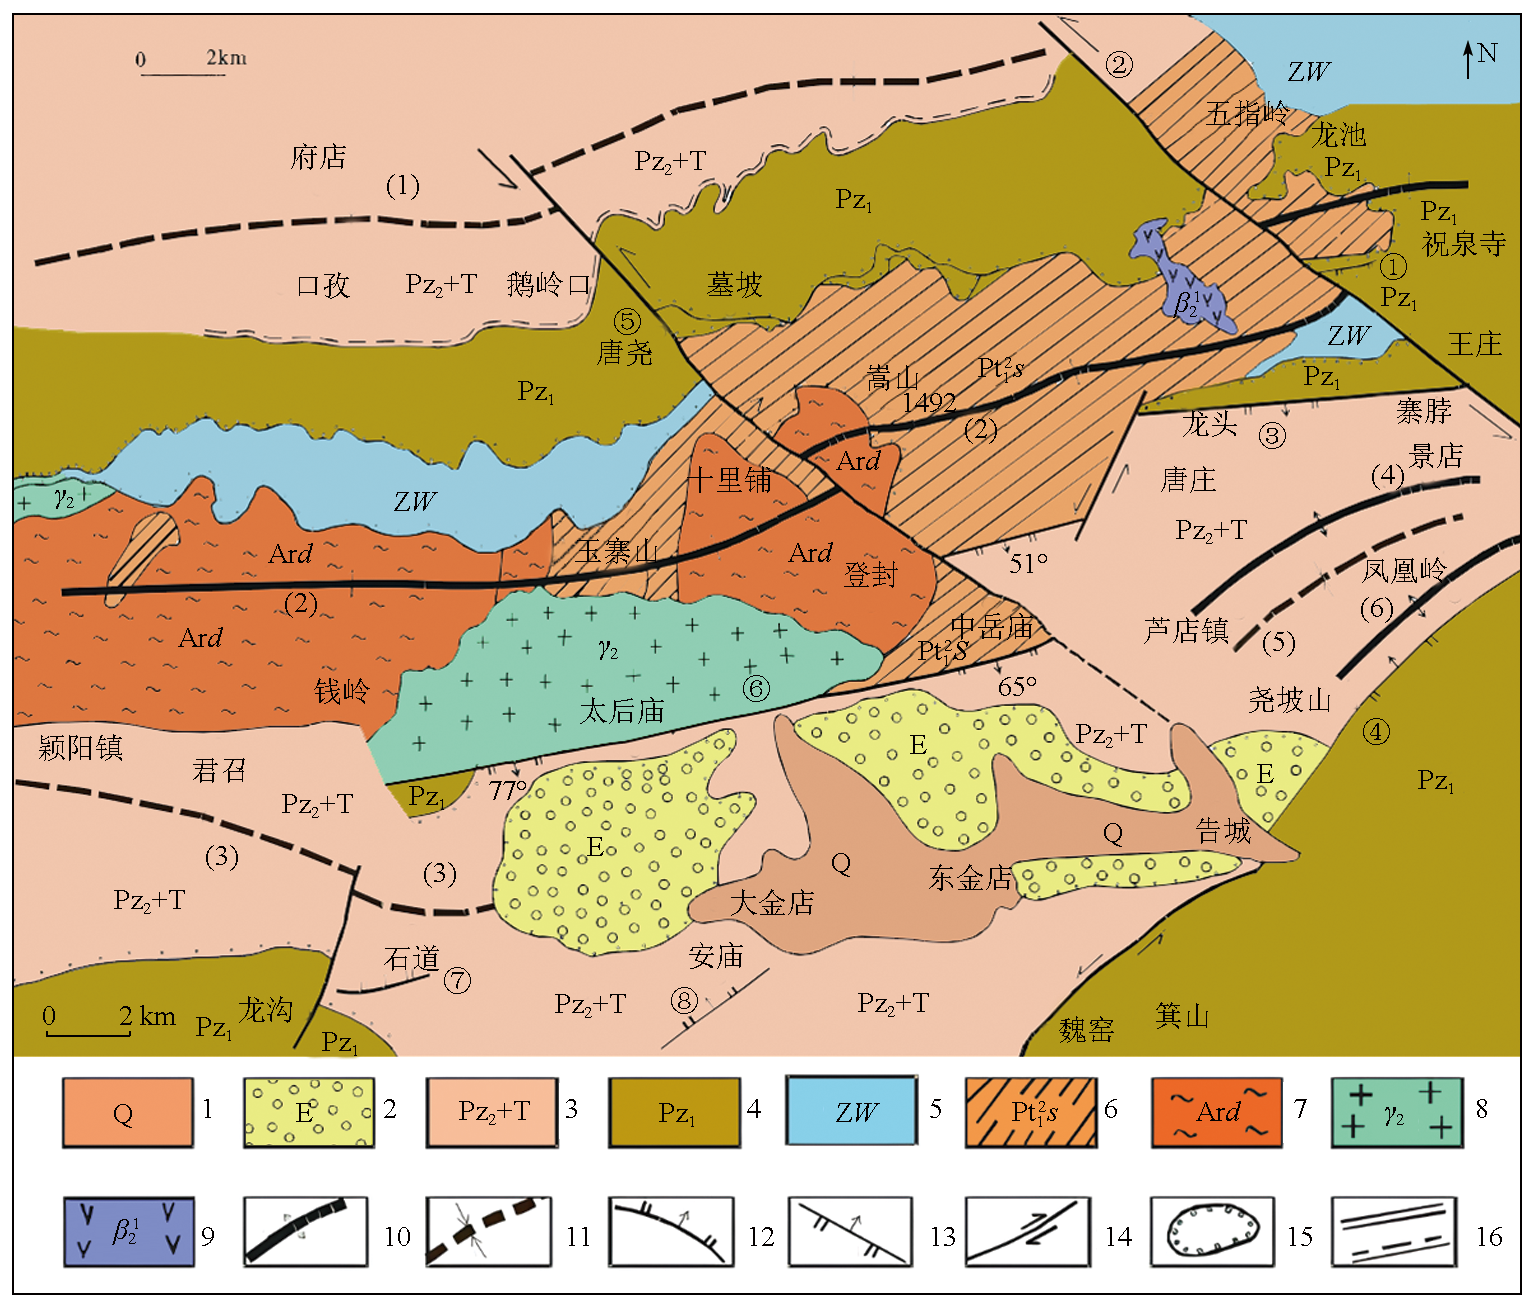
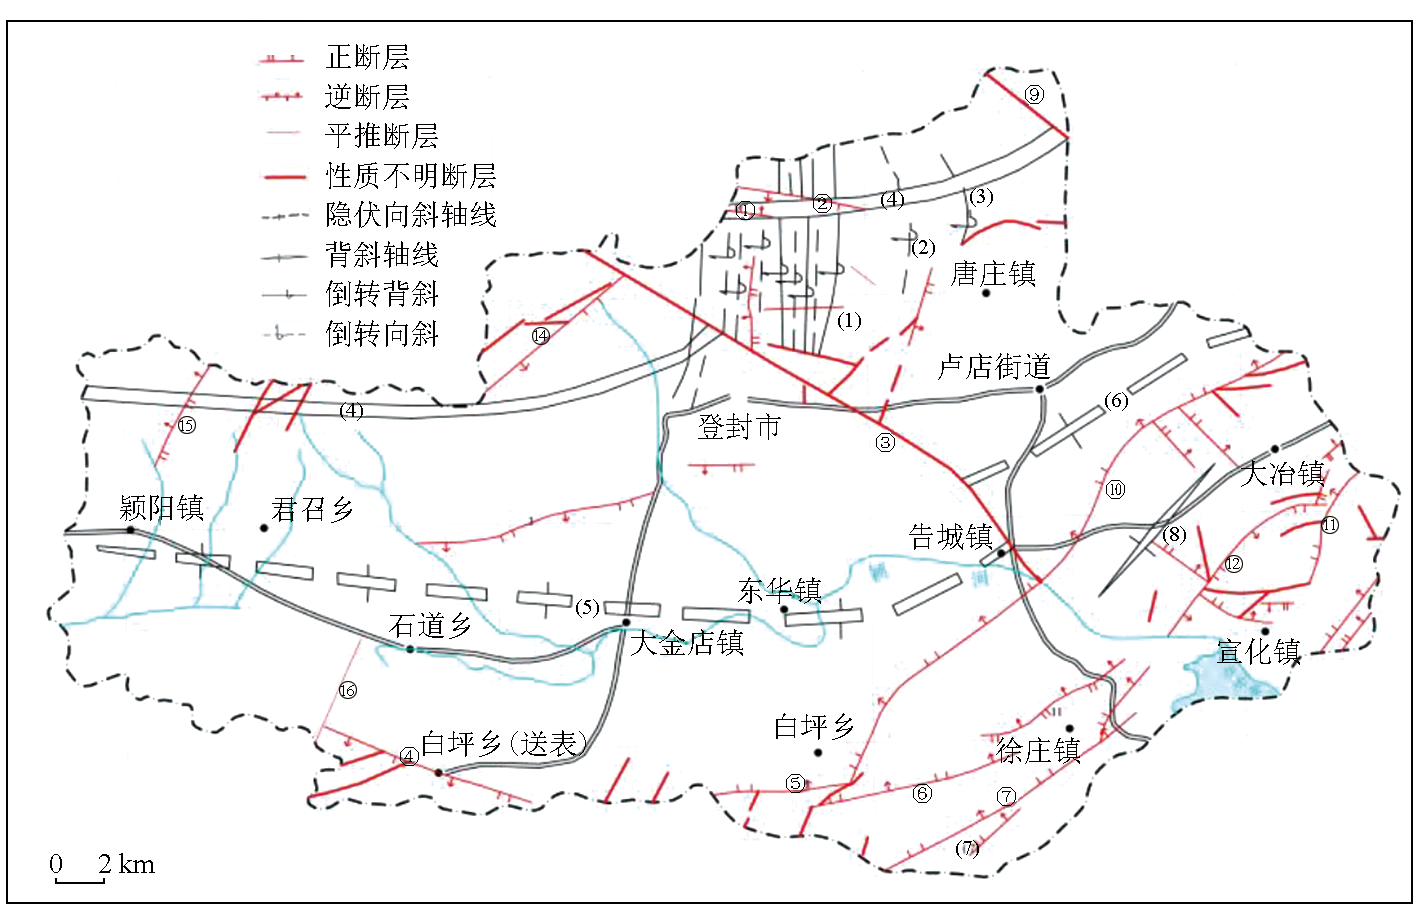
图2 研究区域地质简图1-第四系; 2-古近系; 3-上古生界及三叠系; 4-下古生界; 5-五佛山群; 6-嵩山群; 7-登封岩群; 8-元古宇花岗岩; 9-元古宇基性岩; 10-背斜; 11-向斜; 12-正断层; 13-逆断层; 14-平推断层; 15-飞来峰; 16-平行不整合及角度不整合 ①助泉寺断裂; ②五指岭断裂; ③上寺沟断裂; ④龙头—寨脖断裂; ⑤尧坡山断裂; ⑥唐窑—中岳庙断裂; ⑦登封大断裂; ⑧安庙断裂 (1)府店—涉村向斜; (2)登封大背斜; (3)颍阳—石道向斜; (4)景店背斜; (5)芦店向斜; (6)凤凰岭背斜 Fig.2 Geological map of the study area |
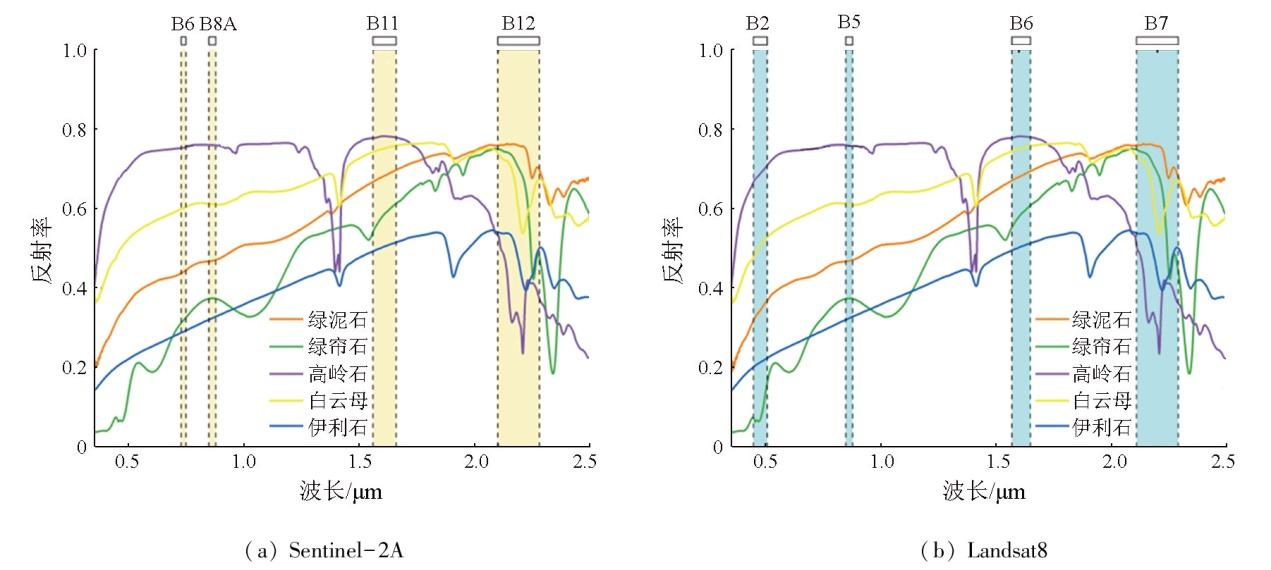
表1 Sentinel-2A与Landsat8 OLI数据波段特征对比Tab.1 Comparison of Sentinel-2A and Landsat8 OLI data band characteristics |
| 波段 分布 | Sentinel-2A | Landsat8 OLI | ||||
|---|---|---|---|---|---|---|
| 波段 | 中心波 长/μm | 分辨 率/m | 波段 | 中心波 长/μm | 分辨 率/m | |
| 可见光 | B1 | 0.433 | 60 | B1 | 0.443 | 30 |
| B2 | 0.490 | 10 | B2 | 0.483 | 30 | |
| B3 | 0.560 | 10 | B3 | 0.561 | 30 | |
| B4 | 0.665 | 10 | B4 | 0.655 | 30 | |
| B5 | 0.705 | 20 | B8 | 0.592 | 15 | |
| B6 | 0.740 | 20 | ||||
| 近红外 | B7 | 0.783 | 20 | B5 | 0.865 | 30 |
| B8 | 0.842 | 10 | ||||
| B8A | 0.865 | 20 | ||||
| B9 | 0.945 | 60 | ||||
| 短波红外 | B10 | 1.375 | 60 | B9 | 1.373 | 30 |
| B11 | 1.610 | 20 | B6 | 1.609 | 30 | |
| B12 | 2.190 | 20 | B7 | 2.201 | 30 | |
NDVI=(NIR-Red)/(NIR+Red),
MNDWI=(Green-SWIR)/(Green+SWIR),
NDBI=(SWIR-NIR)/(SWIR+NIR),
表2 主成分分析特征向量表Tab.2 Principal component analysis eigenvector table |
| 数据 | 波段 | 特征向量 | |||
|---|---|---|---|---|---|
| PC1 | PC2 | PC3 | PC4 | ||
| Sentinel-2A | B6 | -0.493 315 | 0.504 024 | -0.350 873 | 0.616 026 |
| B8A | -0.569 618 | 0.428 483 | 0.326 705 | -0.620 646 | |
| B11 | -0.506 105 | -0.560 972 | 0.544 714 | 0.363 944 | |
| B12 | -0.419 564 | -0.497 668 | -0.688 069 | -0.320 709 | |
| Landsat8 | B2 | -0.157 516 | 0.017 635 | -0.791 345 | -0.590 466 |
| B5 | -0.521 527 | 0.845 590 | 0.044 310 | 0.104 996 | |
| B6 | -0.645 970 | -0.364 374 | 0.474 349 | -0.474 286 | |
| B7 | -0.534 716 | -0.389 741 | -0.383 147 | 0.644 499 | |
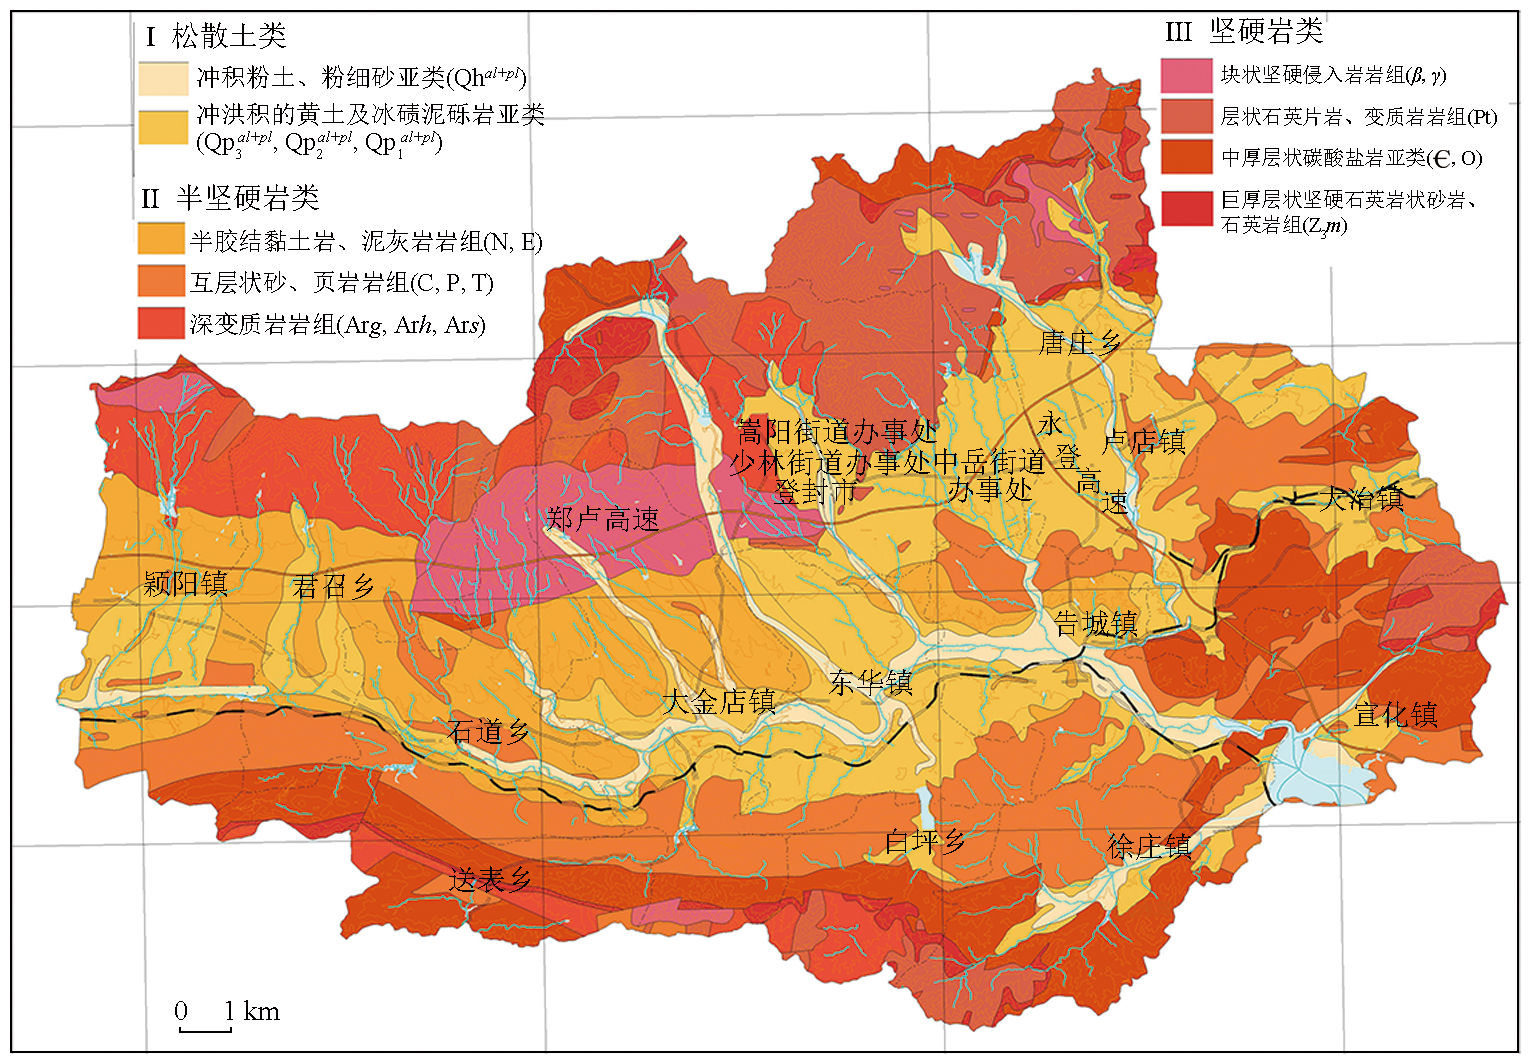
图9 登封市褶皱和断裂构造褶皱名称: (1)大搭寺复背斜; (2)三官庙复向斜; (3)老虎头寨复背斜; (4)嵩山背斜; (5)颖阳—大金店复向斜; (6)芦店向斜; (7)箕山背斜; (8)东刘碑背斜 断裂名称: ①嵩山北坡正断层; ②王峪正断层; ③太后庙正断层; ④送表—郭沟正断层; ⑤南窑正断层; ⑥葫芦套正断层; ⑦过风口正断层; ⑧嵩山断层; ⑨五指岭断层; ⑩魏窑—尧坡山正断层; ⑪申家门逆断层; ⑫火神庙正断层; ⑬峙岈砦沟正断层; ⑭少林寺—当阳山正断层; ⑮安坡山逆断层; ⑯范庄平推断层 Fig.9 Fold and fault structures in Dengfeng City |
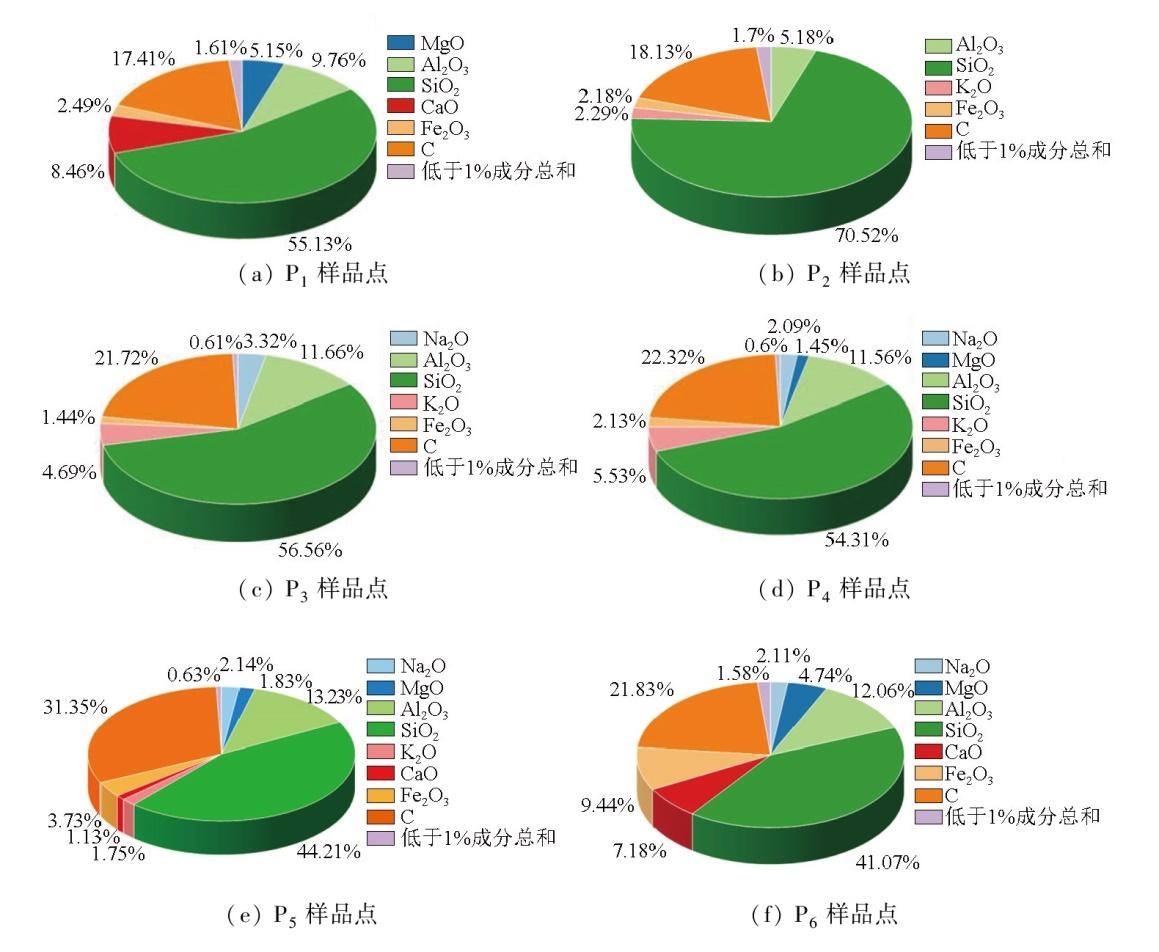
表3 样品主要元素百分比含量Tab.3 Percentage content of main elements in the sample (%) |
| 检测元素 | 样品序号 | |||||
|---|---|---|---|---|---|---|
| P1 | P2 | P3 | P4 | P5 | P6 | |
| SiO2 | 55.134 2 | 72.183 7 | 56.561 6 | 54.313 0 | 44.202 5 | 41.066 4 |
| Al2O3 | 9.756 7 | 4.200 8 | 11.661 9 | 11.556 1 | 13.227 1 | 12.059 2 |
| Na2O | 0.452 2 | 1.780 4 | 3.316 6 | 2.089 6 | 2.143 5 | 2.106 8 |
| K2O | 0.524 4 | 1.864 3 | 4.687 1 | 5.531 4 | 1.749 3 | 0.567 6 |
| MgO | 5.146 6 | 0.093 2 | 0.135 9 | 1.453 9 | 1.834 1 | 4.739 5 |
| Fe2O3 | 2.486 4 | 0.364 2 | 1.438 5 | 2.128 0 | 3.727 1 | 9.440 0 |
| CaO | 8.456 2 | 0.564 3 | 0.102 1 | 0.196 2 | 1.126 9 | 7.178 3 |
| C | 17.414 5 | 19.125 6 | 21.720 7 | 22.323 3 | 31.341 5 | 21.828 9 |
| [1] |
赵芝玲, 王萍, 荆林海, 等. 用ASTER数据提取植被覆盖区遥感铁矿化蚀变信息[J]. 金属矿山, 2016(10):109-115.
|
| [2] |
|
| [3] |
崔世超, 周可法, 丁汝福. 高光谱的矿区植物异常信息提取[J]. 光谱学与光谱分析, 2019, 39(1):241-249.
|
| [4] |
褚志远, 温殿刚, 吕青, 等. 山东蒙阴地区金刚石遥感找矿模型的构建与应用[J]. 地球科学与环境学报, 2024, 46(2):240-251.
|
| [5] |
张云峰, 李领军, 冯淳. ASTER数据在北方铝土矿预普查中的应用——以豫西渑池地区为例[J]. 国土资源遥感, 2012, 24(1):48-52.doi:10.6046/gtzyyg.2012.01.09.
|
| [6] |
|
| [7] |
|
| [8] |
赵振华, 严爽. 花岗伟晶岩成矿有关的几个问题讨论[J]. 大地构造与成矿学, 2023, 47(1):1-41.
|
| [9] |
|
| [10] |
|
| [11] |
连琛芹, 姚佛军, 杨建民, 等. 半裸露区遥感蚀变信息提取研究——以甘肃玛曲地区为例[J]. 现代地质, 2019, 33(5):1079-1085.
|
| [12] |
|
| [13] |
|
| [14] |
|
| [15] |
|
| [16] |
赵慧童, 王萍. 中高分辨率遥感数据铁染信息提取及找矿预测[J]. 遥感信息, 2017, 32(6):96-102.
|
| [17] |
|
| [18] |
连琛芹, 姚佛军, 封志明, 等. 多源数据在甘肃山羊坝地区找矿勘查中的应用[J]. 现代地质, 2022, 36(6):1605-1612.
|
| [19] |
肖壮, 罗彬, 刘友明. 基于深度学习的矿区韧性剪切带找矿研究[J]. 世界有色金属, 2019(21):46-47.
|
| [20] |
|
| [21] |
|
| [22] |
贾黎黎, 朱世博, 王建荣, 等. 基于语义分割深度学习的找矿靶区预测研究——以广东省阳江-茂名地区为例[J]. 地质与勘探, 2023, 59(5):1093-1102.
|
| [23] |
李新萍, 杜文涛, 蔡铁刚, 等. 洛宁盆地多源遥感地热信息提取方法研究[J]. 地质与勘探, 2024, 60(3):552-562.
|
| [24] |
韩燿徽, 王翠芝, 吴志杰, 等. 内蒙古赤峰柴胡栏子金矿田遥感地质解译和蚀变信息提取与找矿预测[J]. 现代地质, 2024, 38(4):1076-1091.
|
| [25] |
易敏, 叶发旺, 张川, 等. 基于深度学习的蚀变矿物识别——以新疆白杨河铀矿床为例[J]. 铀矿地质, 2021, 37(4):673-682.
|
/
| 〈 |
|
〉 |