
Remote Sensing for Natural Resources >
Reconstruction of vegetation index time-series data for crops at a 15 m resolution after reflectance normalization of multi-satellite data
Received date: 2024-09-13
Revised date: 2025-02-17
Online published: 2026-06-03
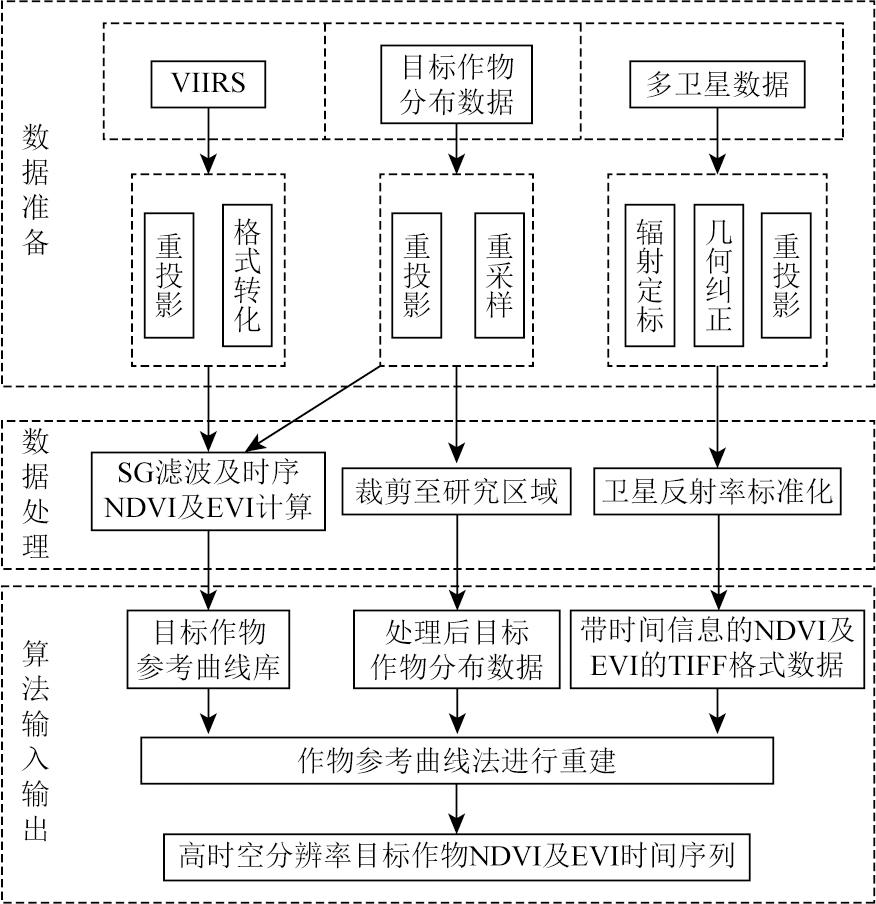
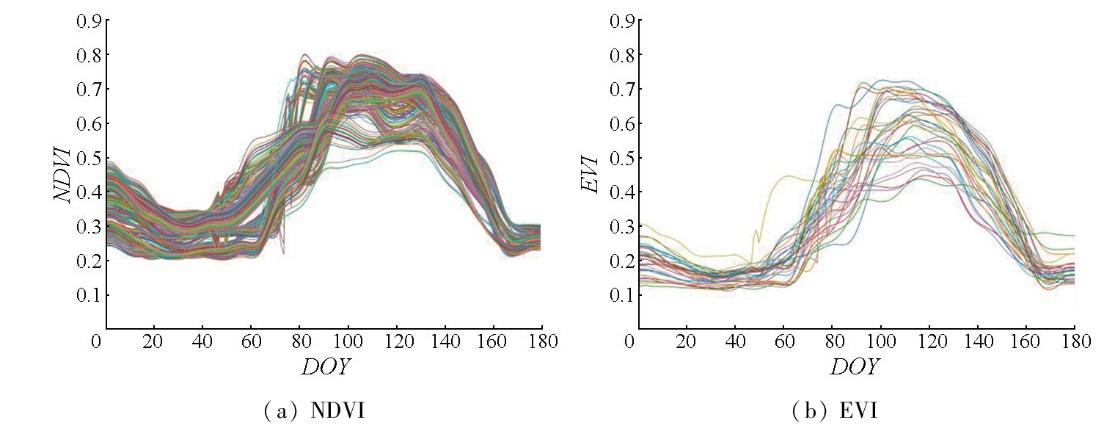
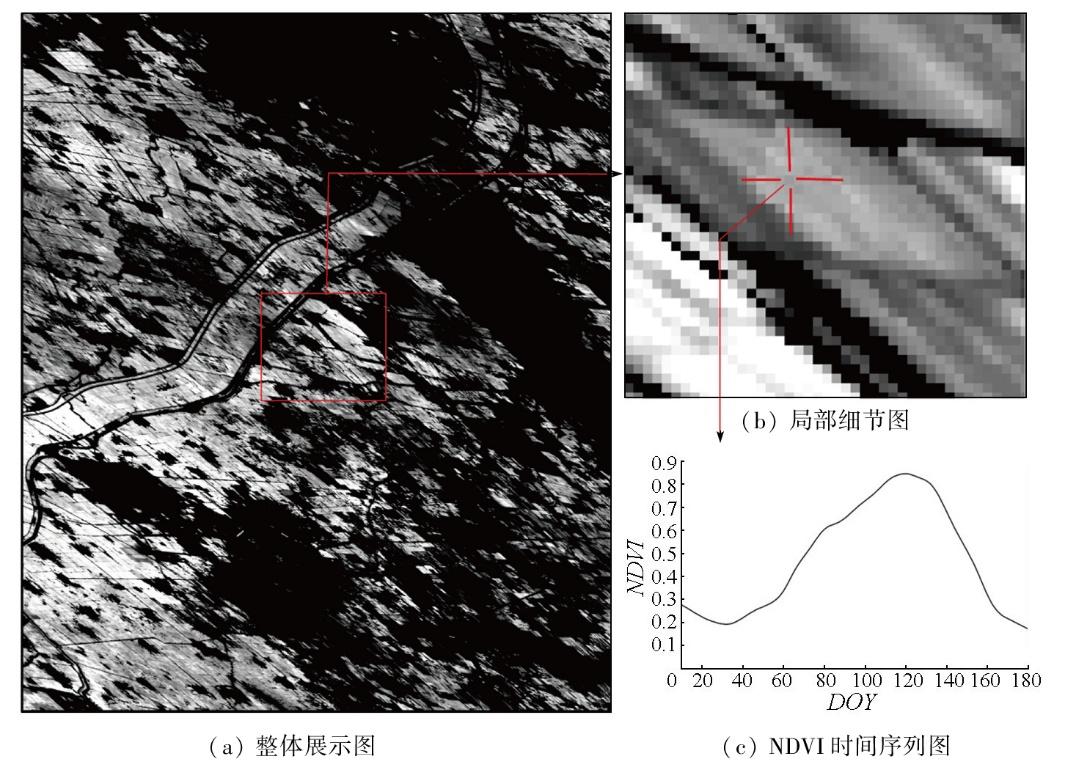
Changes in the vegetation index can reflect variations in vegetation cover and growth in the region to some extent. Monitoring the changes in vegetation index time-series data plays a significant role in local agricultural management. However,existing methods for vegetation index time-series data reconstruction face challenges such as a single data source input and low spatial resolution of reconstruction results. In response to this,this paper proposes a reconstruction method for vegetation index time-series data that integrates the satellite data standardization method and the crop reference curve method. Consequently,it reconstructed vegetation index time-series data with high spatiotemporal resolution for winter wheat in the study area in 2021,including normalized differential vegetation index (NDVI) and enhanced vegetation index (EVI). The results show that after reflectance normalization,the coefficient of determination (R2) for GF-1 satellite and VIIRS surface reflectance data in red,green,infrared,and near infrared bands generally increased by 0.05%,with a few exceeding 0.1%. The root mean square error (RMSE) was reduced,with the majority decreasing by 0.01. In contrast,the relative root mean square error (rRMSE) showed a reduction of about 2%. Most data from the GF-6 satellites exhibited an increase of about 0.12 in R2,a decrease of 0.03 in RMSE,and a general decline in rRMSE ranging from 3% to 4%. In contrast,the data from the Sentinel-2 satellite show an overall increase of about 0.05 in R2,as well as a decrease of around 0.001 and 2% in RMSE and rRMSE,respectively. The accuracy assessment results for the reconstructed high-resolution vegetation index time-series data indicate that the NDVI time-series reconstruction results presented high R2 values in the validation period,with five validation images reaching 0.49 and above. The RMSE was less than 0.1 in all validation periods,while the relative error (RE) was less than 15% in most cases,with only one validation image reaching 18%. Similarly,the EVI time-series reconstruction results also exhibited high R2 values,with five validation images above 0.44. Both RMSE and rRMSE values were less than 0.15 and 20%,respectively.
AO Yangqian , SUN Liang . Reconstruction of vegetation index time-series data for crops at a 15 m resolution after reflectance normalization of multi-satellite data[J]. Remote Sensing for Natural Resources, 2025 , 37(5) : 206 -215 . DOI: 10.6046/zrzyyg.2024298
表1 本文使用数据Tab.1 Datasheet of this article |
| 数据类型 | 名称 | 时间 | 空间分辨率/m |
|---|---|---|---|
| 卫星反射 率数据 | GF-1 | 2021-01-03 | 16 |
| 2021-01-28 | |||
| 2021-02-17 | |||
| 2021-04-07 | |||
| GF-6 | 2021-02-16 | 16 | |
| 2021-03-04 | |||
| 2021-04-18 | |||
| 2021-05-01 | |||
| 2021-05-05 | |||
| Sentinel-2 | 2021-02-01 | 10 | |
| 2021-02-11 | |||
| 2021-03-03 | |||
| 2021-03-23 | |||
| 2021-04-27 | |||
| 2021-05-07 | |||
| 2021-05-27 | |||
| 2021-06-26 | |||
| VIIRS数据 | VNP09GA | 2021年1—6月 | 1 000 |
| 作物分 布数据 | 中国冬小麦 识别数据集 | 2021年 | 10 |
表2 GF-1卫星反射率标准化前后评价指标变化Tab.2 Changes in evaluation indicators before and after standardization of GF-1 satellite reflectance |
| 波段 | 标准化 前R2 | 标准化 后R2 | 标准 化前 RMSE | 标准 化后 RMSE | 标准 化前 rRMSE/% | 标准 化后 rRMSE/% |
|---|---|---|---|---|---|---|
| 蓝光 | 0.568 | 0.658 | 0.01 | 0.008 | 33.199 | 29.557 |
| 绿光 | 0.563 | 0.632 | 0.012 | 0.011 | 17.037 | 15.624 |
| 红光 | 0.592 | 0.642 | 0.017 | 0.016 | 28.550 | 26.732 |
| 近红外 | 0.822 | 0.861 | 0.003 | 0.028 | 8.020 | 7.078 |
表3 GF-6卫星反射率标准化前后评价指标变化Tab.3 Changes in evaluation indicators before and after standardization of GF-6 satellite reflectance |
| 波段 | 标准化 前R2 | 标准化 后R2 | 标准 化前 RMSE | 标准 化后 RMSE | 标准 化前 rRMSE/% | 标准 化后 rRMSE/% |
|---|---|---|---|---|---|---|
| 蓝光 | 0.499 | 0.620 | 0.014 | 0.011 | 22.497 | 18.852 |
| 绿光 | 0.518 | 0.674 | 0.018 | 0.015 | 16.526 | 13.591 |
| 红光 | 0.585 | 0.721 | 0.029 | 0.024 | 23.666 | 19.423 |
| 近红外 | 0.759 | 0.812 | 0.041 | 0.036 | 10.421 | 9.202 |
表4 Sentinel-2卫星反射率标准化前后评价指标变化Tab.4 Changes in evaluation indicators before and after standardization of Sentinel-2 satellite reflectance |
| 波段 | 标准化 前R2 | 标准化 后R2 | 标准 化前 RMSE | 标准 化后 RMSE | 标准 化前 rRMSE/% | 标准 化后 rRMSE/% |
|---|---|---|---|---|---|---|
| 蓝光 | 0.326 | 0.446 | 0.01 | 0.009 | 22.816 | 20.688 |
| 绿光 | 0.572 | 0.646 | 0.012 | 0.011 | 16.856 | 15.335 |
| 红光 | 0.586 | 0.647 | 0.017 | 0.015 | 28.74 | 26.552 |
| 近红外 | 0.824 | 0.864 | 0.031 | 0.027 | 7.976 | 7.012 |
表5 NDVI时间序列重建精度评价表Tab.5 NDVI time series reconstruction accuracy evaluation |
| 积日 | 原始NDVI 图像均值 | 重建NDVI 图像均值 | Bias | RMSE | RE/% | R2 |
|---|---|---|---|---|---|---|
| 28 | 0.23 | 0.19 | -0.04 | 0.05 | 18.25 | 0.49 |
| 42 | 0.21 | 0.21 | 0.00 | 0.03 | 11.49 | 0.52 |
| 47 | 0.26 | 0.24 | -0.02 | 0.03 | 9.22 | 0.85 |
| 82 | 0.55 | 0.54 | -0.01 | 0.09 | 14.26 | 0.38 |
| 117 | 0.67 | 0.75 | 0.07 | 0.10 | 13.71 | 0.59 |
| 125 | 0.74 | 0.73 | -0.01 | 0.04 | 3.90 | 0.84 |
| 127 | 0.67 | 0.73 | 0.06 | 0.10 | 13.07 | 0.42 |
表6 EVI时间序列重建精度评价Tab.6 EVI time series reconstruction accuracy evaluation |
| 积日 | 原始EVI 图像均值 | 重建EVI 图像均值 | Bias | RMSE | RE/% | R2 |
|---|---|---|---|---|---|---|
| 28 | 0.15 | 0.14 | -0.004 | 0.02 | 11.56 | 0.49 |
| 42 | 0.15 | 0.15 | -0.005 | 0.03 | 13.37 | 0.44 |
| 47 | 0.14 | 0.16 | 0.013 | 0.02 | 11.64 | 0.78 |
| 82 | 0.44 | 0.48 | 0.034 | 0.19 | 38.95 | 0.10 |
| 117 | 0.62 | 0.55 | -0.072 | 0.11 | 13.63 | 0.57 |
| 125 | 0.56 | 0.50 | -0.057 | 0.07 | 11.16 | 0.74 |
| 127 | 0.60 | 0.49 | -0.108 | 0.14 | 20.59 | 0.35 |
| [1] |
|
| [2] |
边金虎, 李爱农, 宋孟强, 等. MODIS植被指数时间序列Savitzky-Golay滤波算法重构[J]. 遥感学报, 2010, 14(4):725-741.
|
| [3] |
胡顺石, 黄春晓, 杨斌, 等. 自适应加权Savitzky-Golay滤波重构MODIS植被指数时间序列[J]. 测绘科学, 2020, 45(4):105-116.
|
| [4] |
|
| [5] |
王鹏新, 荀兰, 李俐, 等. 基于时间序列叶面积指数傅里叶变换的作物种植区域提取[J]. 农业工程学报, 2017, 33(21):207-215.
|
| [6] |
|
| [7] |
|
| [8] |
邵亚婷, 王卷乐, 严欣荣. 蒙古国植被物候特征及其对地理要素的响应[J]. 地理研究, 2021, 40(11):3029-3045.
|
| [9] |
|
| [10] |
樊辉. 融合QA-SDS的MODIS NDVI时序数据重构[J]. 遥感技术与应用, 2013, 28(1):90-96.
|
| [11] |
|
| [12] |
|
| [13] |
贾良良, 刘克桐, 孙彦铭, 等. 河北省低平原区近16年来农田施肥量、作物产量和养分效率的变化特征[J]. 中国土壤与肥料, 2017(3):50-55.
|
| [14] |
王晓峰, 陈霞. 衡水市冬小麦节水品种栽培技术试验[J]. 种子世界, 2016(5):25-26.
|
| [15] |
潘海珠. 基于作物多模型遥感数据同化的区域冬小麦生长模拟研究[D]. 北京: 中国农业科学院, 2020.
|
| [16] |
吴尚蓉. 基于流依赖背景误差同化系统的冬小麦估产研究[D]. 北京: 中国农业科学院, 2019.
|
| [17] |
闫峰, 史培军, 武建军, 等. 基于MODIS-EVI数据的河北省冬小麦生育期特征[J]. 生态学报, 2008, 28(9):4381-4387.
|
/
| 〈 |
|
〉 |