
Remote Sensing for Natural Resources >
Trend analysis and prediction method of ground deformation using TS-InSAR-based combination-long short-term memory
Received date: 2024-09-14
Revised date: 2024-11-26
Online published: 2026-06-03
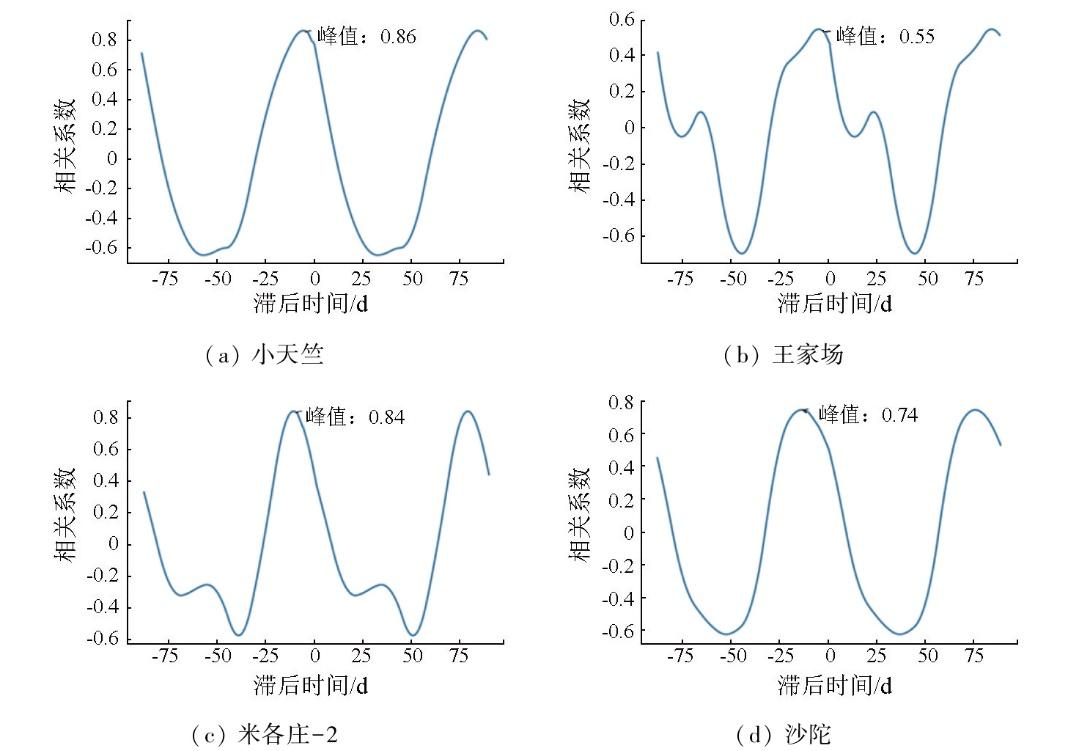
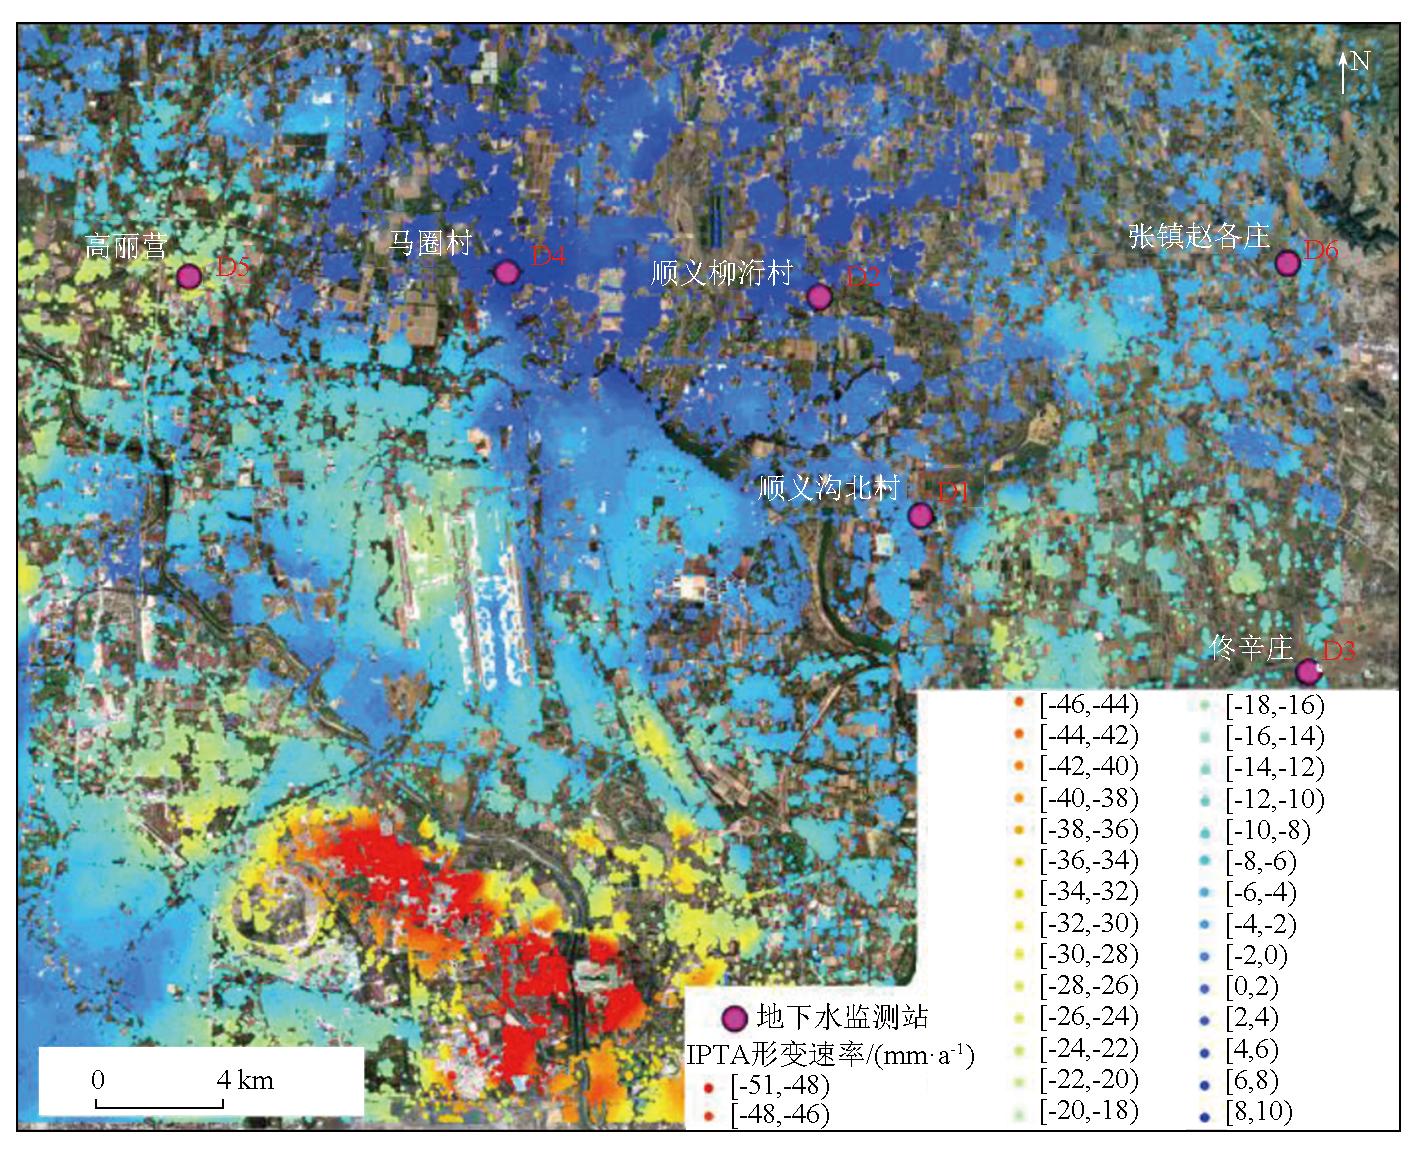
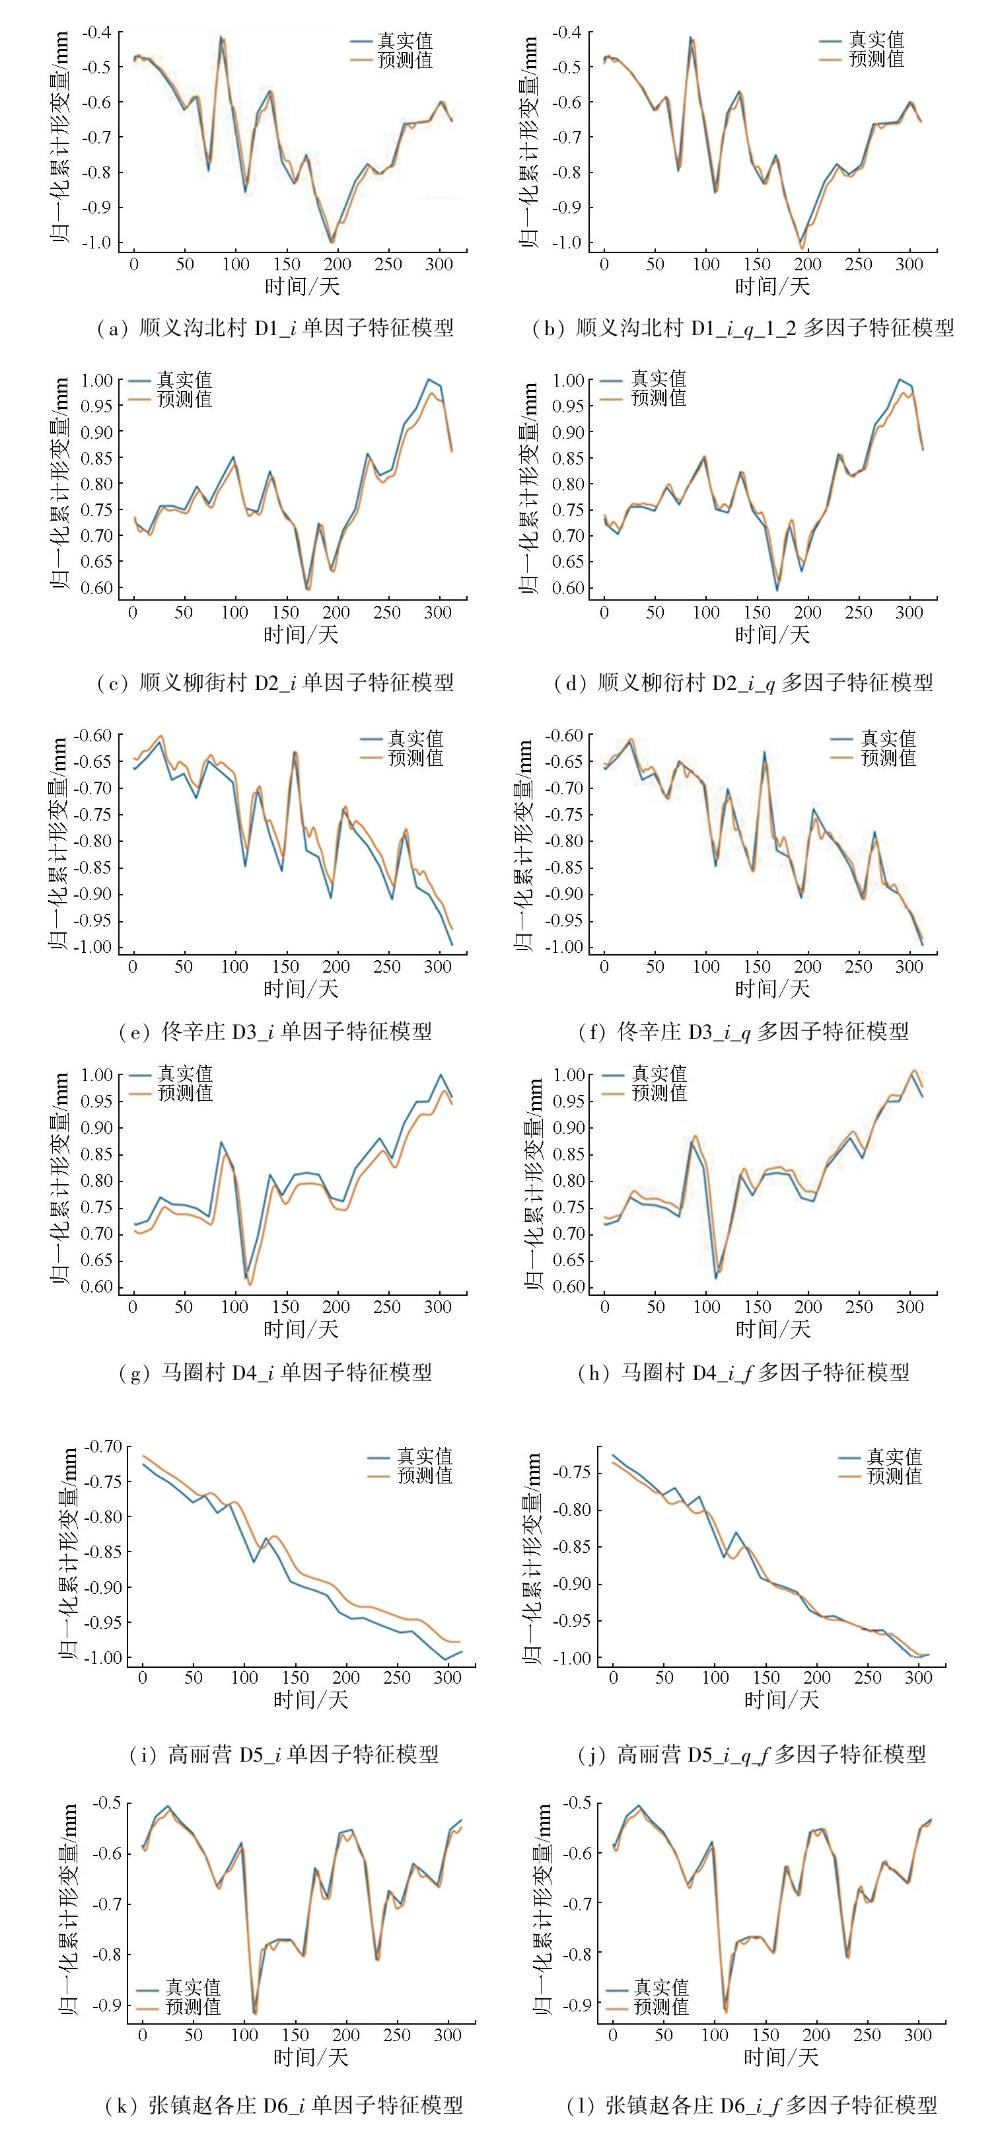
Time-series interferometric synthetic aperture radar (TS-InSAR) technology has been widely used in ground deformation monitoring and prediction. However,current research remains insufficient in the correlation and temporal lag between groundwater and ground deformation. Moreover,InSAR-based prediction models for ground deformation mostly rely on a single InSAR data,which limits the prediction accuracy and generalization ability of the models. To address these challenges,this study proposed a combination-long short-term memory (C-LSTM) model that integrates groundwater level,rainfall,and InSAR deformation data. This model was employed to evaluate the prediction and accuracy of single-factor and multi-factor models,respectively. The results revealed a temporal lag between ground deformation and changes in groundwater level. The optimal feature combination,obtained through model training using groundwater and rainfall data,exhibited significant improvements in prediction accuracy compared to single-factor predictions,with the coefficient of determination (R2) increasing by 2.45%,1.52%,4.16%,8.08%,5.08%,and 1.45% respectively. The model enhances the prediction accuracy of ground deformation by incorporating model feature combinations with high correlation with ground deformation.
WEN Yi , ZHANG Ling , KONG Hanquan , WAN Xiangxing , GE Daqing , LIU Bin . Trend analysis and prediction method of ground deformation using TS-InSAR-based combination-long short-term memory[J]. Remote Sensing for Natural Resources, 2025 , 37(5) : 141 -151 . DOI: 10.6046/zrzyyg.2024299
表1 遥感数据信息概况Tab.1 Information on remote sensing data |
| 卫星影像 | Sentinel-1A-IW-SAR-SLC |
|---|---|
| 时间范围 | 2018-01-03—2022-12-20 |
| 主影像 | 2019-01-22 |
| 时间基线/d | 12~108 |
| 垂直基线/m | -150~150 |
| 干涉对 | 572 |
| DEM | Copernicus-30 |
表5 单因子预测结果Tab.5 Single-factor prediction results |
| 因子① | RMSE | MAE | MAPE | R2 | r |
|---|---|---|---|---|---|
| D1_i | 0.026 8 | 0.022 1 | 3.233 6 | 0.960 8 | 0.992 0 |
| D2_i | 0.016 6 | 0.013 6 | 1.684 4 | 0.966 7 | 0.993 4 |
| D3_i | 0.022 6 | 0.020 4 | 2.607 7 | 0.942 5 | 0.992 8 |
| D4_i | 0.027 3 | 0.024 4 | 3.027 6 | 0.887 4 | 0.979 9 |
| D5_i | 0.020 9 | 0.019 4 | 2.179 5 | 0.940 4 | 0.995 8 |
| D6_i | 0.015 1 | 0.013 2 | 2.081 2 | 0.973 9 | 0.993 0 |
①i为InSAR形变数据。 |
表6 多因子预测结果Tab.6 Multi-factor prediction results |
| 因子① | RMSE | MAE | MAPE | R2 | r |
|---|---|---|---|---|---|
| D1_i_q_1_2 | 0.017 0 | 0.012 8 | 1.839 8 | 0.984 3 | 0.994 3 |
| D2_i_q | 0.012 4 | 0.009 7 | 1.221 0 | 0.981 4 | 0.995 7 |
| D3_i_q | 0.012 8 | 0.009 7 | 1.275 9 | 0.981 7 | 0.993 9 |
| D4_i_f | 0.016 5 | 0.012 6 | 1.602 2 | 0.959 1 | 0.986 6 |
| D5_i_q_f | 0.009 3 | 0.007 0 | 0.830 3 | 0.988 2 | 0.995 2 |
| D6_i_f | 0.010 2 | 0.007 6 | 1.180 0 | 0.988 0 | 0.994 4 |
①i为InSAR形变数据;q为潜水层水位数据;1为第一层承压水层水位数据;2为第二层承压水层水位数据;3为第三层承压水层水位数据;f为顺义地区累计降雨数据。 |
| [1] |
|
| [2] |
|
| [3] |
田芳, 罗勇, 周毅, 等. 北京地面沉降与地下水开采时空演变对比[J]. 南水北调与水利科技, 2017, 15(2):163-169.
|
| [4] |
|
| [5] |
|
| [6] |
|
| [7] |
|
| [8] |
|
| [9] |
|
| [10] |
|
| [11] |
|
| [12] |
刘明坤, 贾三满, 褚宏亮. 北京市地面沉降监测系统及技术方法[J]. 地质与资源, 2012, 21(2):244-249.
|
| [13] |
|
| [14] |
雷坤超. 南水北调前后北京平原区地下水和地面沉降演变特征[J]. 地质学报, 2024, 98(2):591-610.
|
/
| 〈 |
|
〉 |