
Remote Sensing for Natural Resources >
Monitoring 2018—2022 changes in lake levels across China using ICESat-2 data
Received date: 2024-03-15
Revised date: 2024-09-11
Online published: 2026-06-03
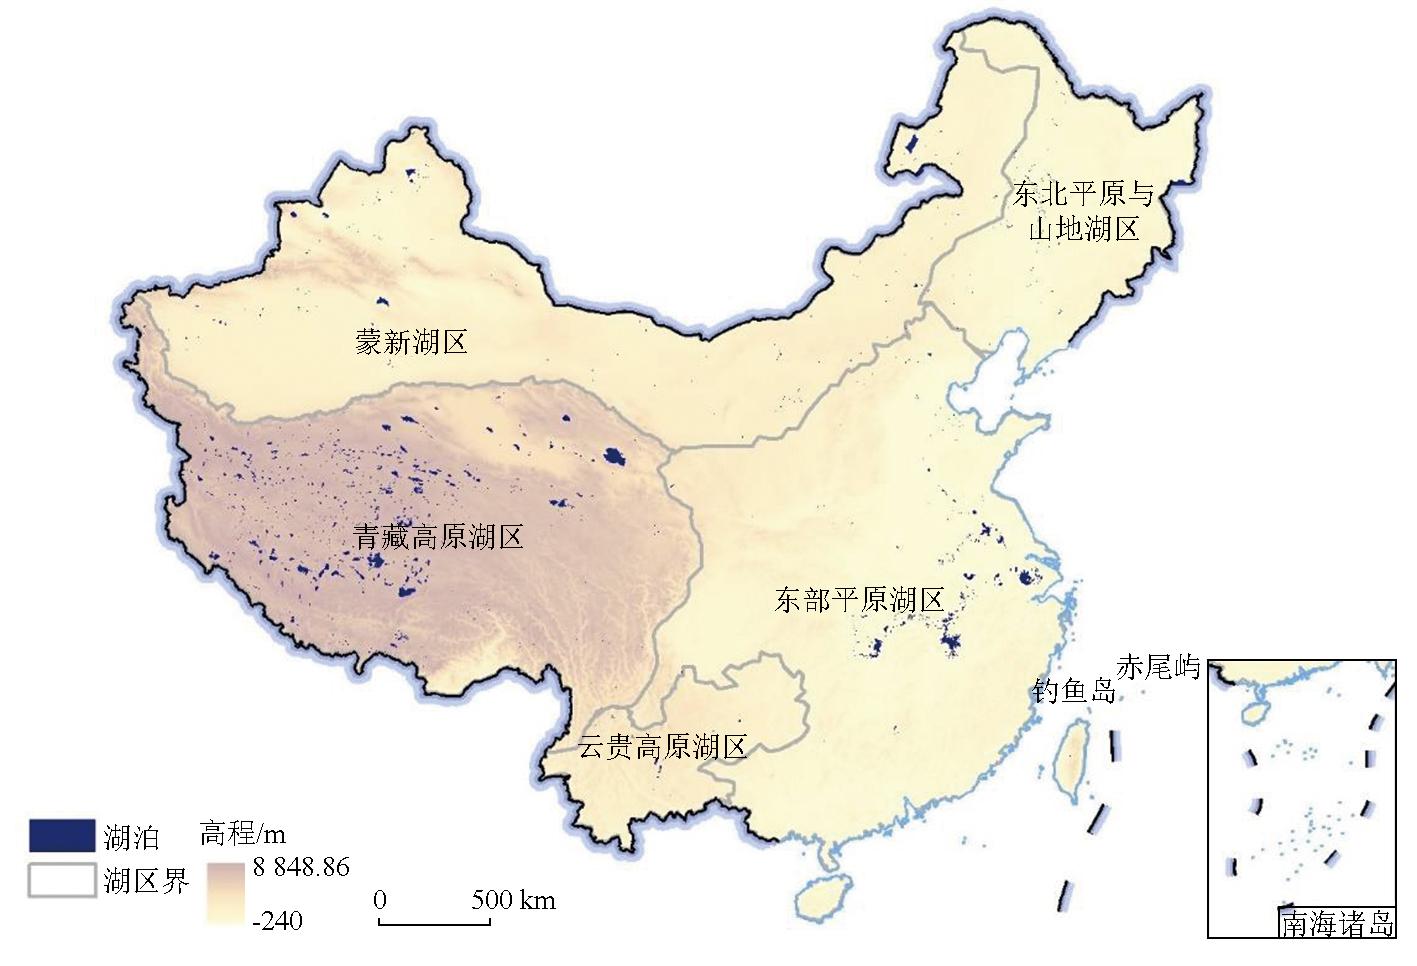
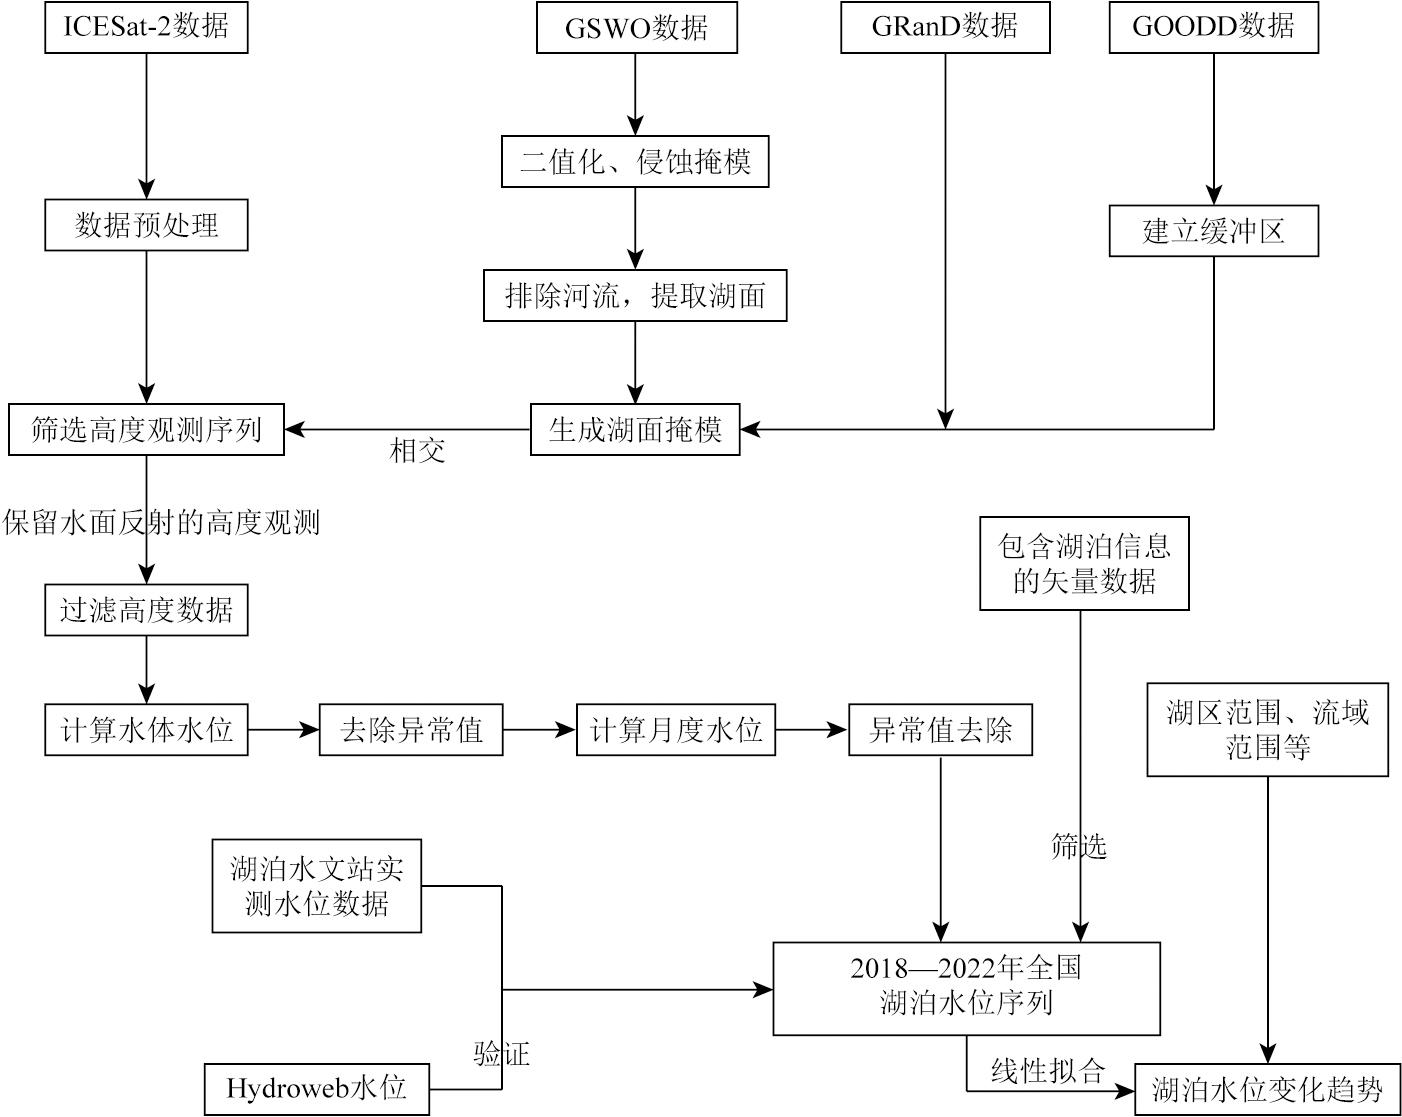
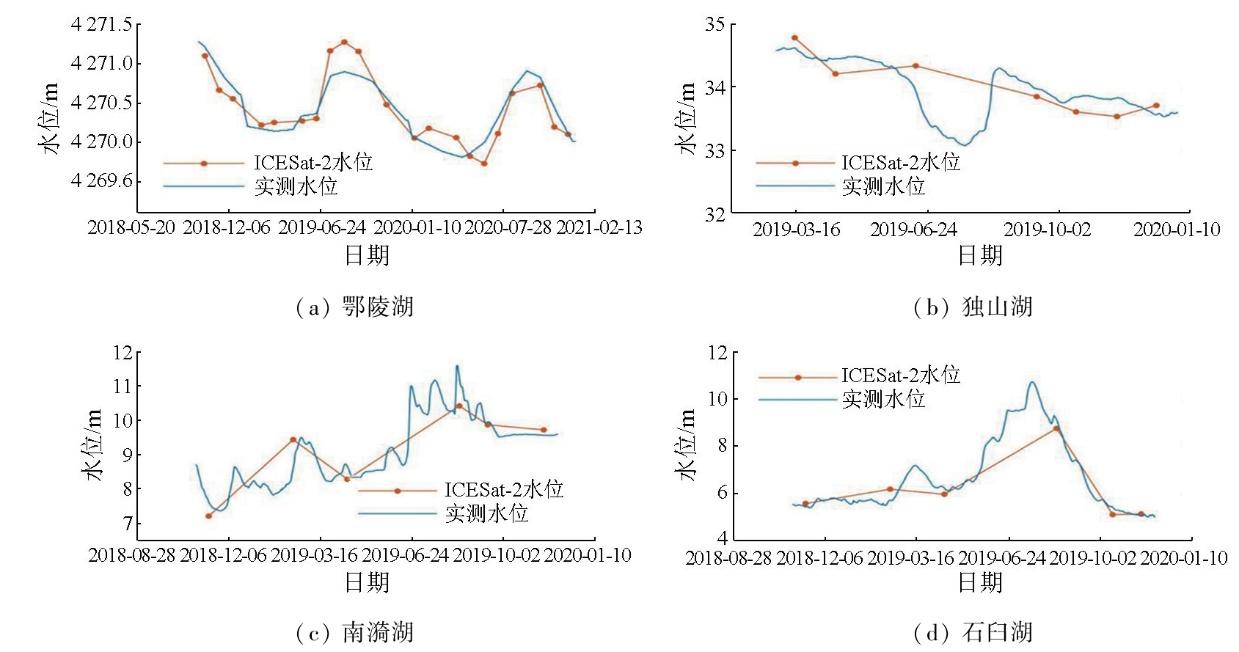
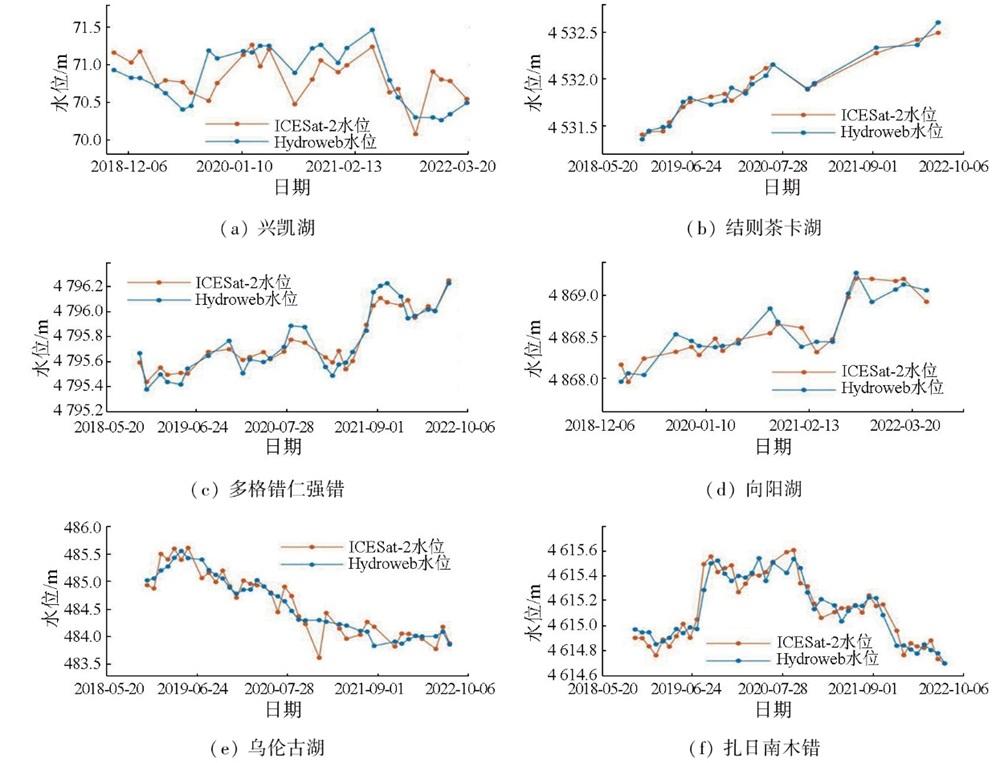
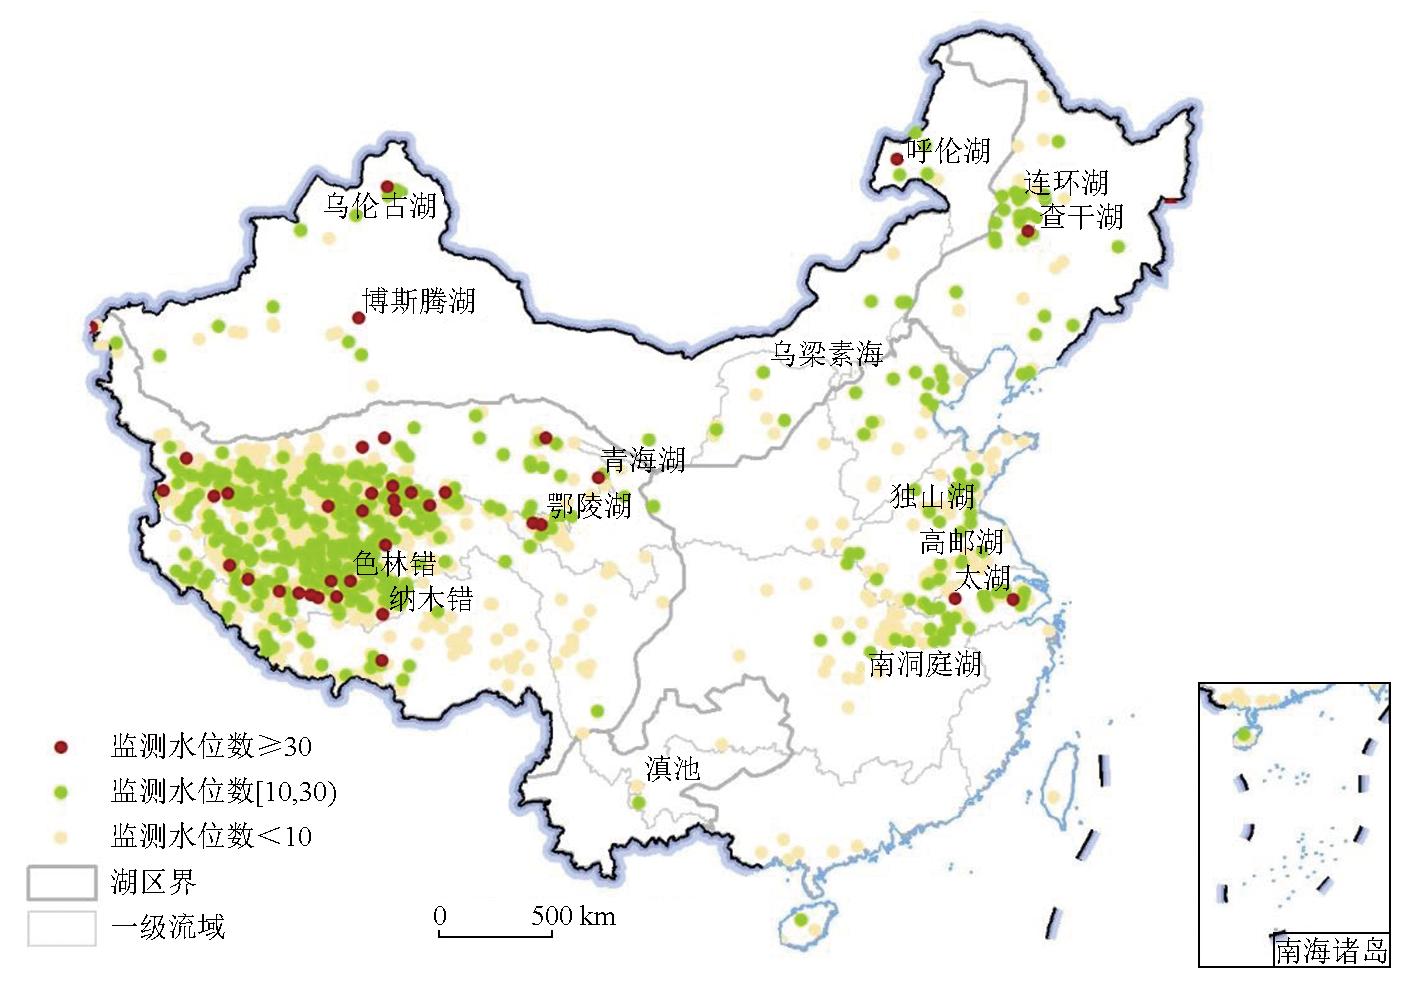
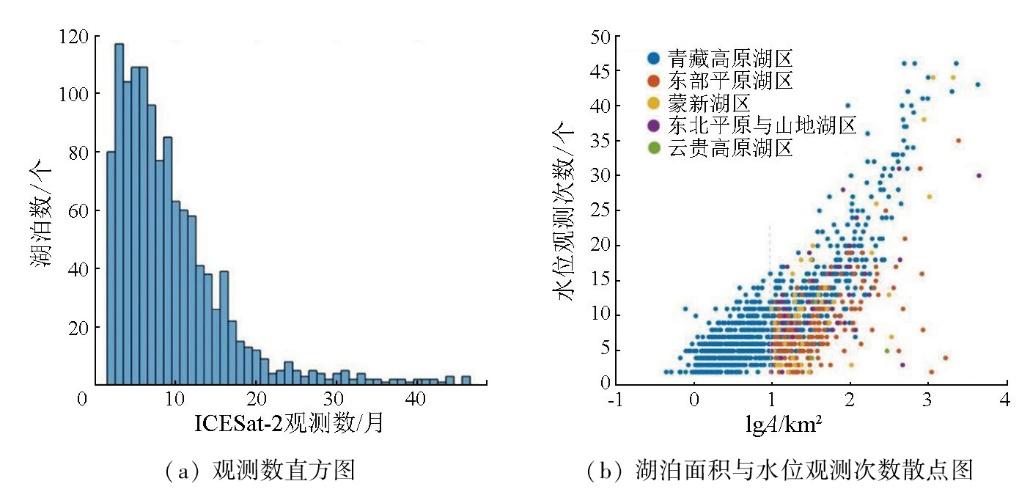
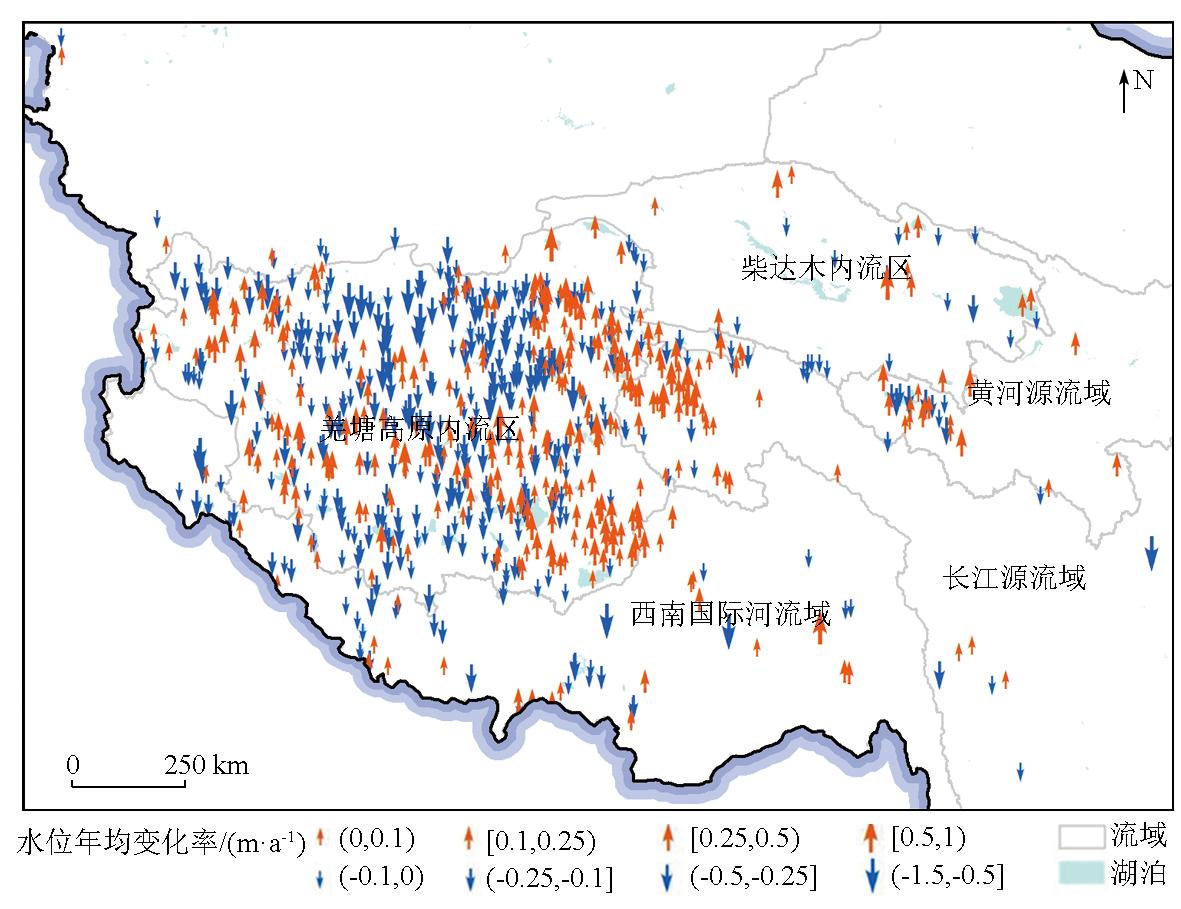
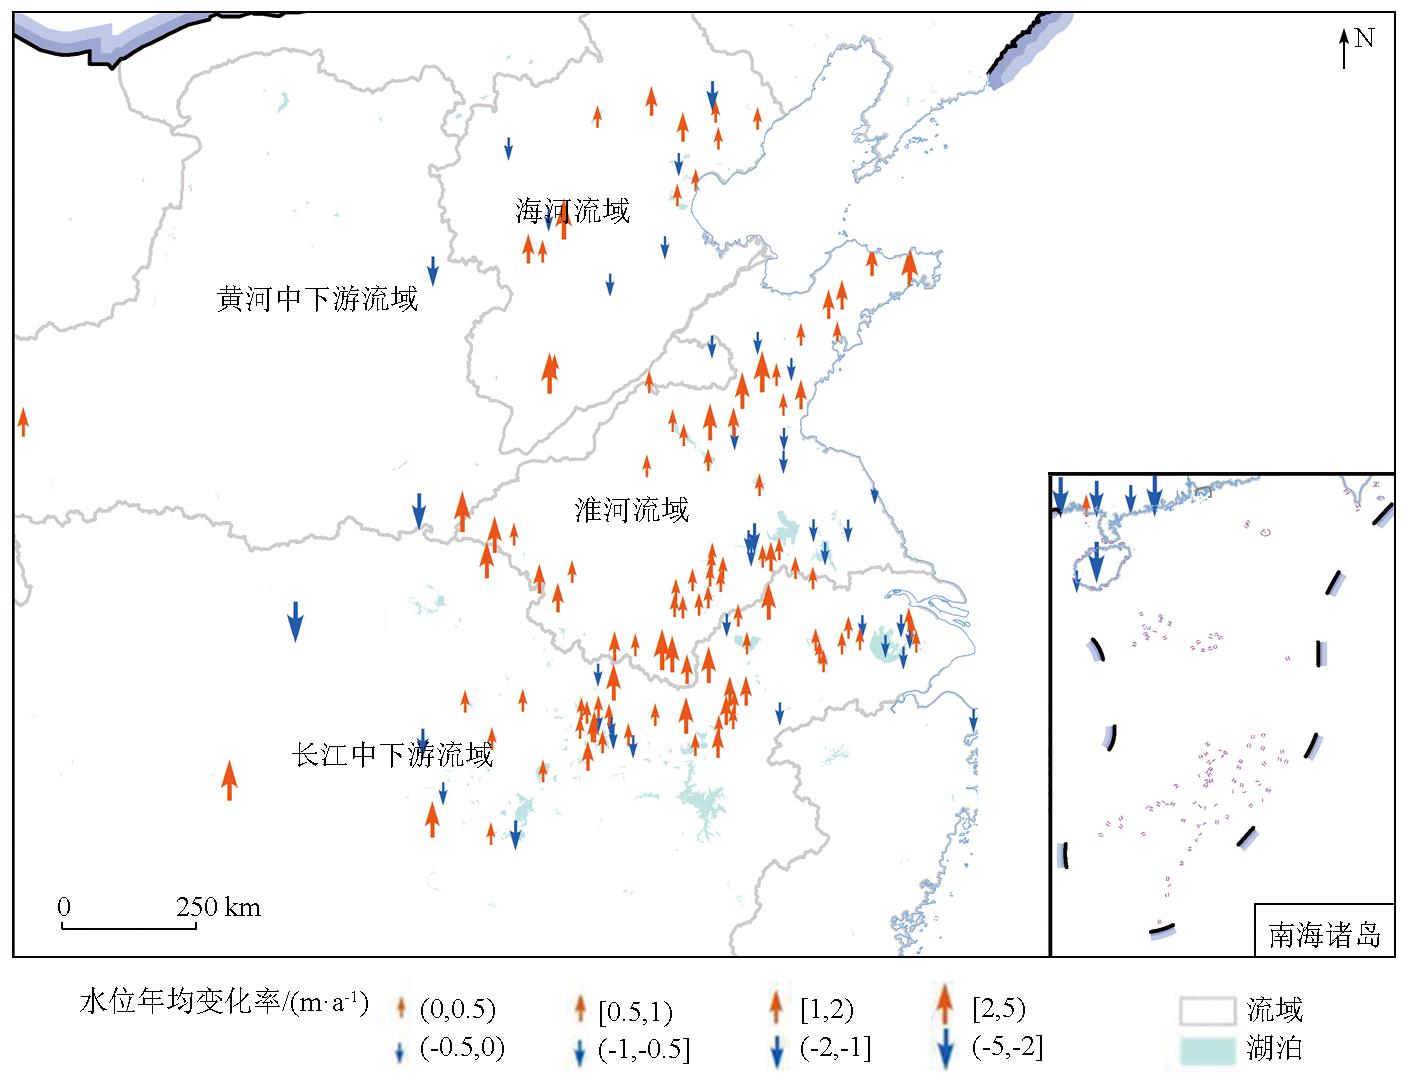
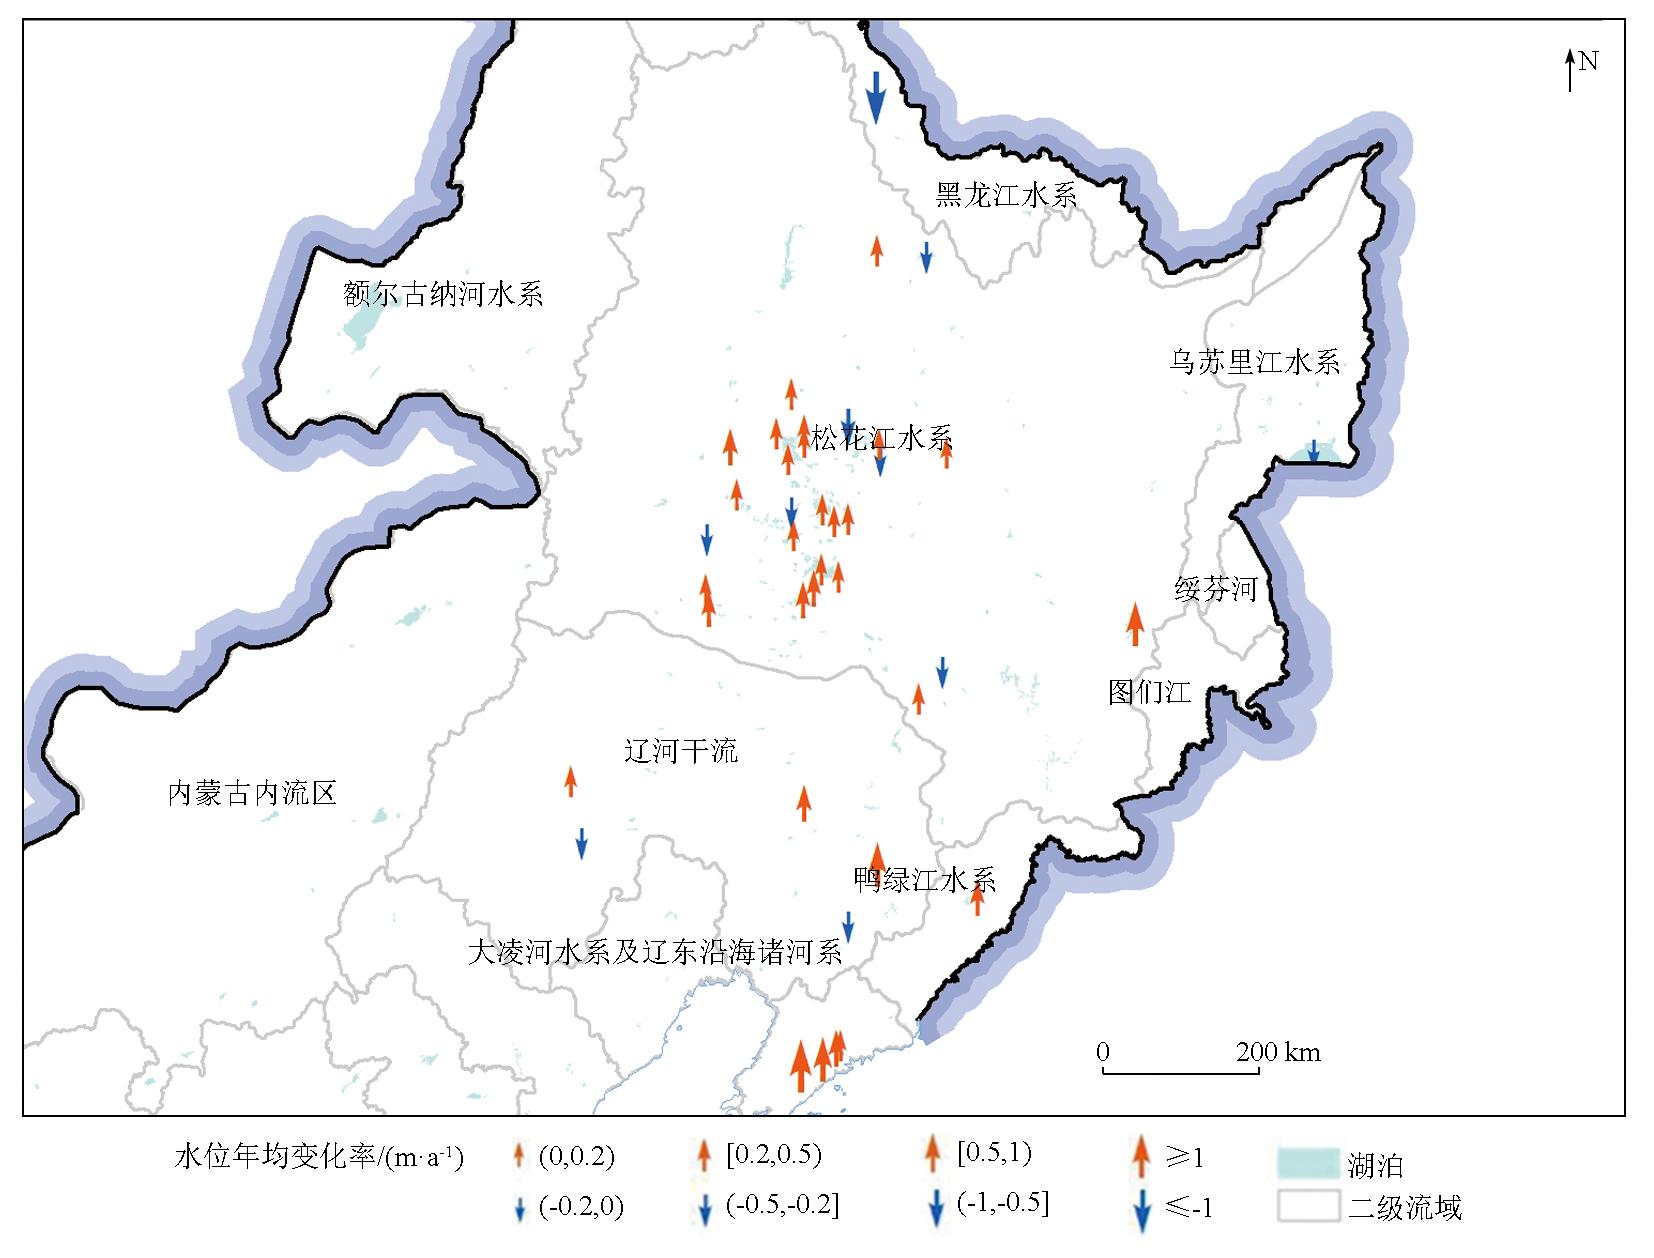
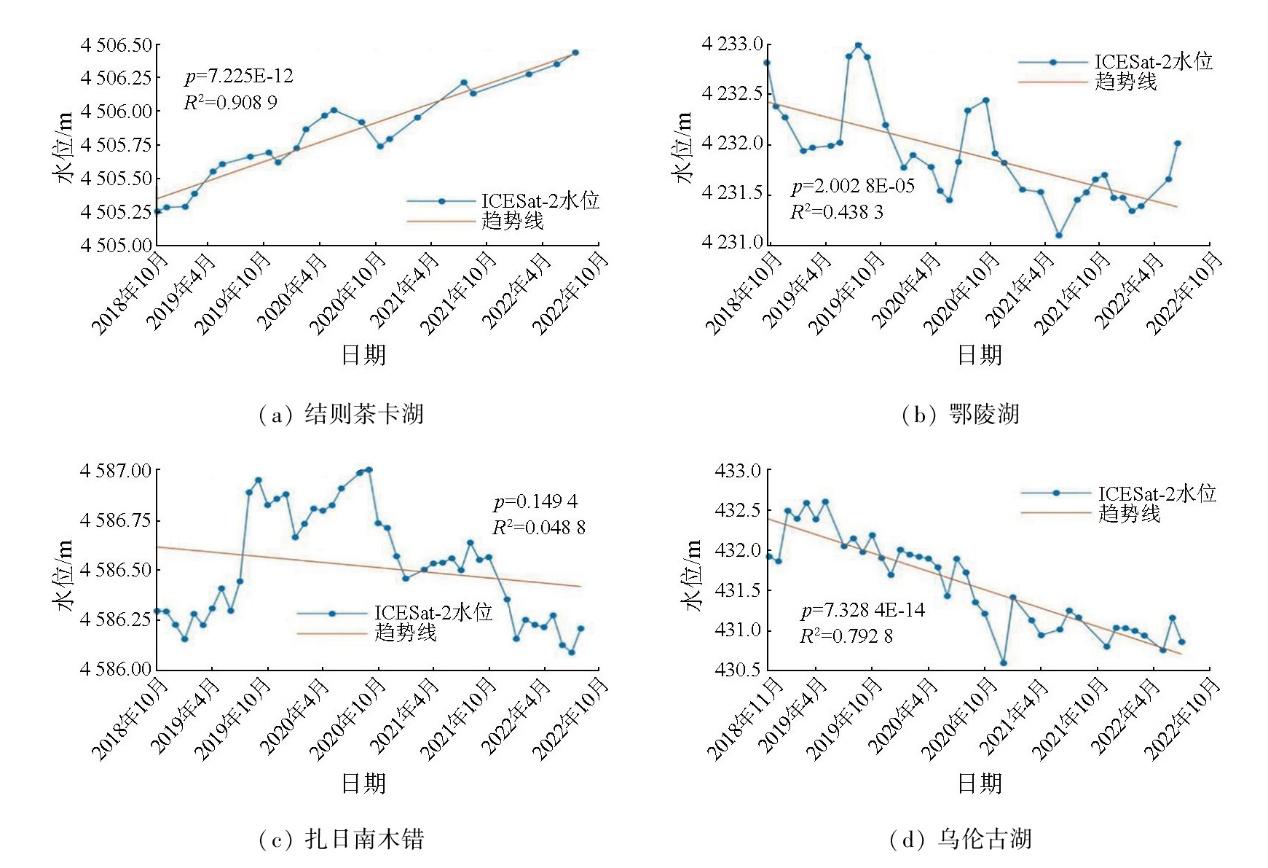
Satellite altimetry enables non-contact,large-scale Earth observation,providing technical support for monitoring changes in water levels of lakes where there is a lack of ground-based hydrological stations. The ICESat-2 laser altimeter features small footprints and high measurement accuracy,enjoying advantages in monitoring small-to medium-sized lakes. Therefore,this study extracted water level data from October 2018 to August 2022 for 1248 lakes across China based on ICESat-2 ATL08 data. The extracted data were validated using measured water level data from 18 lakes and Hydroweb data from 36 ones. Subsequently,based on the division of China's five major lake regions,this study analyzed variations in water levels of 957 lakes that were observed for over two years in at least four campaigns. The results show that the root mean square errors (RMSEs) between ICESat-2-derived and measured lake levels showed a minimum of 0.097 m. The cross-validation with Hydroweb data yielded a correlation coefficient of 0.95 and a minimum RMSE of 0.085 m. These results demonstrate the high precision and accuracy of the water level retrieval based on the ICESat-2 data. The lake levels on the Tibetan Plateau exhibited a slow rising trend,while those in northwestern China showed a declining trend. In eastern China,the water levels of large lakes displayed no significant variation trend,whereas those of small lakes showed pronounced fluctuations. Overall,the lake levels across China exhibited a gently rising trend. This study achieved high-precision measurement and monitoring of variations in lake levels across China,providing a scientific basis for water resource protection,ecological management,and the exploration of the responses of lake levels to human activities and climate change.
Key words: satellite altimetry; lake level; ICESat-2; change analysis; lake region of China
JING Ruofan , LIAO Jingjuan , MA Shanmu . Monitoring 2018—2022 changes in lake levels across China using ICESat-2 data[J]. Remote Sensing for Natural Resources, 2025 , 37(5) : 1 -14 . DOI: 10.6046/zrzyyg.2024100
表1 实测数据验证误差统计表Tab.1 Statistics for verification error using the in-situ data |
| 序号 | 湖泊名 | 重复水位数/个 | 重合水位日期范围 | RMSE/m | 相关系数 |
|---|---|---|---|---|---|
| 1 | 扎陵湖 | 22 | 2018年10月—2020年12月 | 0.097 | 0.881 |
| 2 | 鄂陵湖 | 21 | 2018年10月—2020年12月 | 0.195 | 0.894 |
| 3 | 太湖 | 18 | 2018年10月—2020年12月 | 0.462 | 0.366 |
| 4 | 青海湖 | 12 | 2018年12月—2019年12月 | 0.203 | 0.766 |
| 5 | 巢湖 | 10 | 2018年12月—2019年12月 | 0.830 | 0.365 |
| 6 | 乌梁素海 | 8 | 2018年10月—2020年10月 | 0.198 | 0.555 |
| 7 | 独山湖 | 7 | 2019年3月—2019年12月 | 0.270 | 0.771 |
| 8 | 南漪湖 | 6 | 2018年11月—2019年11月 | 0.398 | 0.932 |
| 9 | 石臼湖 | 6 | 2018年11月—2019年11月 | 0.241 | 0.981 |
| 10 | 阳澄湖 | 6 | 2018年10月—2019年12月 | 0.134 | 0.416 |
| 11 | 大官湖 | 6 | 2018年12月—2019年12月 | 0.384 | 0.417 |
| 12 | 菜子湖 | 5 | 2018年12月—2019年12月 | 0.320 | 0.774 |
| 13 | 高邮湖 | 4 | 2018年12月—2020年12月 | 0.045 | 0.978 |
| 14 | 微山湖 | 4 | 2019年4月—2019年12月 | 0.167 | 0.324 |
| 15 | 泸沽湖 | 3 | 2019年2月—2019年5月 | 0.019 | 0.966 |
| 16 | 洪泽湖 | 3 | 2019年6月—2019年12月 | 0.152 | 0.933 |
| 17 | 武昌湖 | 3 | 2019年1月—2019年10月 | 0.424 | 0.982 |
| 18 | 固城湖 | 3 | 2018年11月—2019年4月 | 0.139 | 0.996 |
表2 青藏高原湖区不同面积湖泊水位变化趋势统计表Tab.2 Trends in water levels of lakes of different sizes in the lake area of the Qinghai-Xizang Plateau |
| 湖泊面积 范围/km2 | 湖泊数量/个 | 总面积/km2 | 上升数量/个 | 上升面积/ km2 | 上升率/ (m·a-1) | 下降数量/个 | 下降面积/ km2 | 下降率/ (m·a-1) |
|---|---|---|---|---|---|---|---|---|
| >1 000 | 4 | 9 673.41 | 3 | 8 672.84 | 0.207 | 1 | 1 000.57 | -0.051 |
| (500,1 000] | 10 | 6 561.89 | 6 | 3 997.77 | 0.279 | 4 | 2 564.12 | -0.146 |
| (200,500] | 29 | 9 698.25 | 14 | 4 938.49 | 0.239 | 15 | 4 759.76 | -0.132 |
| (100,200] | 46 | 6 264.33 | 32 | 4 433.57 | 0.197 | 14 | 1 830.77 | -0.120 |
| (50,100] | 69 | 4 956.55 | 40 | 2 980.10 | 0.165 | 29 | 1 976.45 | -0.094 |
| (10,50] | 231 | 5 411.45 | 102 | 2 593.46 | 0.174 | 129 | 2 817.98 | -0.148 |
| ≤10 | 345 | 1 477.06 | 146 | 641.12 | 0.141 | 199 | 835.94 | -0.192 |
| 总计 | 734 | 44 042.94 | 343 | 28 257.35 | 0.212 | 391 | 15 785.59 | -0.129 |
表3 青藏高原湖区各流域湖泊水位变化趋势Tab.3 Trends in lake level changes in various basins on the Qinghai-Xizang Plateau |
| 流域名称 | 湖泊数/个 | 上升面积/km2 | 平均上升率/(m·a-1) | 下降面积/km2 | 平均下降率/(m·a-1) |
|---|---|---|---|---|---|
| 柴达木内流区 | 30 | 5 747.132 | 0.245 4 | 554.773 | -0.111 4 |
| 羌塘高原内流区 | 532 | 21 259.077 | 0.205 9 | 11 143.659 | -0.118 9 |
| 黄河源流域 | 27 | 148.091 | 0.114 3 | 1 295.693 | -0.222 2 |
| 长江源流域 | 58 | 691.819 | 0.243 8 | 343.625 | -0.047 5 |
| 西南国际河流域 | 73 | 371.611 | 0.067 3 | 2 280.361 | -0.145 2 |
表4 东部平原湖区不同面积湖泊水位变化趋势统计Tab.4 Trends in water levels of lakes of different sizes in the Eastern Plains lake area |
| 湖泊面积/ km2 | 湖泊数量/个 | 总面积/ km2 | 上升数量/个 | 上升面积/ km2 | 年均上升率/ (m·a-1) | 下降数量/个 | 下降面积/ km2 | 年均下降率/ (m·a-1) |
|---|---|---|---|---|---|---|---|---|
| >1 000 | 1 | 2 457.42 | 0 | 0 | 0 | 1 | 2 457.42 | -0.025 |
| (500,1 000] | 4 | 2 985.60 | 3 | 2 125.73 | 0.101 | 1 | 859.87 | -0.034 |
| (100,500] | 26 | 5 010.93 | 23 | 4 259.28 | 0.275 | 3 | 751.65 | -0.375 |
| (50,100] | 17 | 1 162.70 | 10 | 684.72 | 0.699 | 7 | 477.98 | 0.049 |
| (10,50) | 100 | 2 464.14 | 68 | 1 727.11 | 0.817 | 32 | 737.03 | -0.604 |
| 总计 | 148 | 14 080.78 | 104 | 8 796.84 | 0.373 | 44 | 5 283.94 | -0.234 |
表5 东部平原湖区各流域水位变化趋势Tab.5 Trends in lake level changes in various basins in the Eastern Plains lake area |
| 流域名称 | 湖泊数/个 | 上升面积/km2 | 平均上升率/(m·a-1) | 下降面积/km2 | 平均下降率/(m·a-1) |
|---|---|---|---|---|---|
| 长江中下游流域 | 60 | 4 935.227 | 0.303 9 | 3 569.893 | -0.165 6 |
| 黄河中下游流域 | 6 | 310.559 | 0.801 9 | 44.734 | -0.783 0 |
| 淮河流域 | 55 | 2 896.429 | 0.336 5 | 1 292.278 | -0.077 7 |
| 海河流域 | 19 | 615.876 | 0.878 5 | 161.389 | -0.319 4 |
| 珠江流域 | 7 | 38.750 | 0.315 7 | 197.237 | -2.331 9 |
志谢:研究中用到的ICESat-2 ATL08数据由美国国家冰雪数据中心NSIDC提供(https://nsidc.org/data/atl08),在此表示感谢!
| [1] |
吴红波, 郭忠明, 毛瑞娟. ICESat-GLAS测高数据在长江中下游湖泊水位变化监测中的应用[J]. 资源科学, 2012, 34(12):2289-2298.
|
| [2] |
高乐, 廖静娟, 刘焕玲, 等. 卫星雷达测高的应用现状及发展趋势[J]. 遥感技术与应用, 2013, 28(6):978-983.
|
| [3] |
赵云. 雷达高度计数据中国主要湖泊水位变化监测方法研究[D]. 北京: 中国科学院大学(中国科学院遥感与数字地球研究所), 2017.
|
| [4] |
|
| [5] |
王成, 习晓环, 骆社周, 等. 星载激光雷达数据处理与应用[M]. 北京: 科学出版社, 2015.
|
| [6] |
安德笼, 杨进, 武永斌, 等. ICESat-2激光测高卫星应用研究进展[J]. 海洋测绘, 2019, 39(6):9-15.
|
| [7] |
|
| [8] |
|
| [9] |
张国庆, 王蒙蒙, 周陶, 等. 青藏高原湖泊面积、水位与水量变化遥感监测研究进展[J]. 遥感学报, 2022, 26(1):115-125.
|
| [10] |
马山木, 甘甫平, 吴怀春, 等. ICESat-2数据监测青藏高原湖泊2018—2021年水位变化[J]. 自然资源遥感, 2022, 34(3):164-172.doi:10.6046/zrzyyg.2021329.
|
| [11] |
|
| [12] |
张国庆,
|
| [13] |
王娜. 中国五大湖区湖泊生态系统结构及水生生物演化比较研究[D]. 南京: 南京大学, 2012.
|
| [14] |
|
| [15] |
吴红波, 王宁练, 郭忠明. ICESat-2/ATLAS测高数据在青海湖湖泊水位估计中的应用[J]. 水资源与水工程学报, 2021, 32(5):11-18,26.
|
| [16] |
|
| [17] |
|
/
| 〈 |
|
〉 |