
Remote Sensing for Natural Resources >
Analyzing impact of the Beijing-Guangzhou high-speed railway on cities along the Hebei section based on remote sensing monitoring
Received date: 2024-03-31
Revised date: 2024-10-13
Online published: 2026-06-03
At present, the impacts of high-speed railways (HSRs) on cities along rail lines remain unclear. Previous analyses of these impacts based on remote sensing data focused primarily on qualitative assessment. Given this, this study investigated the Hebei section of the Beijing-Guangzhou HSR and introduced a remote sensing monitoring-based method that integrated qualitative and quantitative analyses for assessing the impacts of HSR on urban development. First, this study established a parameter index system used to characterize urban development changes. Then, multi-source and multi-scale remote sensing data were employed to monitor the spatiotemporal variations in these indices before and after the operation of the Beijing-Guangzhou HSR within this study area. Finally, four cities that were adjacent to the study area but lacked available HSRs were selected as a control group. Using the difference-in-differences (DID) model, this study quantified the impacts of HSRs on four cities along the Hebei section. The results indicate that the four cities along the Hebei section of the Beijing-Guangzhou HSR saw a rapid expansion in the construction land between 2005 and 2020, with an average annual expansion rate of 2.00%. The HSR construction exerted a significant impact on the direction of urban expansion, with the impact related to the spatial relationship between both. Compared to the four cities in the control group, the operation of the Beijing-Guangzhou HSR has slowed down the expansion rates of urban areas in the four cities along the line.
Key words: urban expansion; land use; night light; high-speed railway (HSR)
SU Boxiong , WU Mingquan , NIU Zheng , CHEN Fang , HUANG Wenjiang . Analyzing impact of the Beijing-Guangzhou high-speed railway on cities along the Hebei section based on remote sensing monitoring[J]. Remote Sensing for Natural Resources, 2025 , 37(4) : 194 -203 . DOI: 10.6046/zrzyyg.2024161
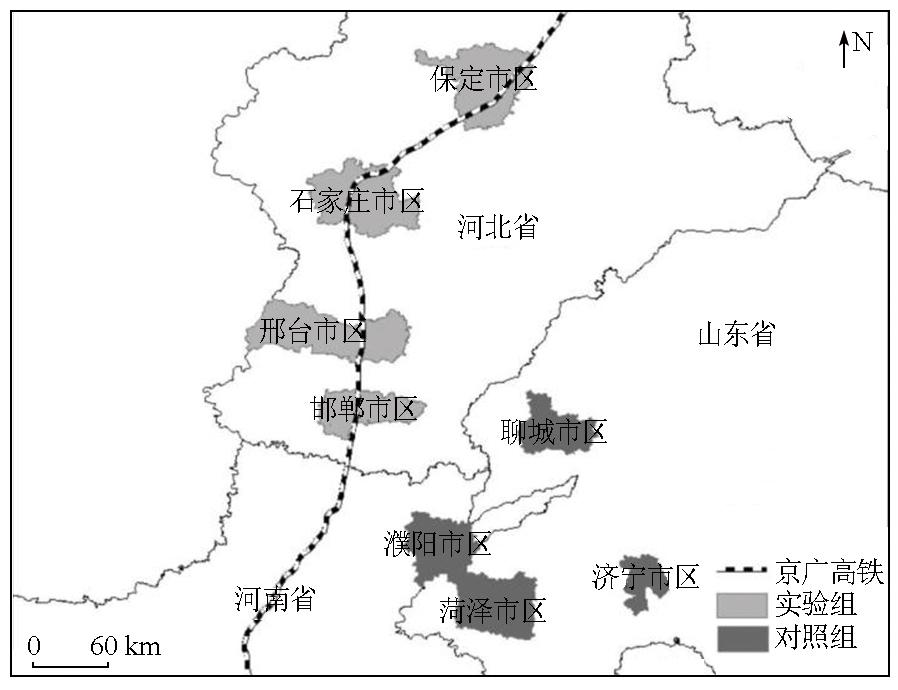
图1 京广高铁河北段4市与邻近对照城市地理位置Fig.1 Location of the four cities in the Hebei section of the Beijing-Guangzhou high-speed railway and neighboring comparison cities |
表1 研究区8座城市城区行政区范围Tab.1 Scope of urban administrative districts of the eight cities in the study area |
| 分组 | 所在地级市 | 城区范围 | 高速铁路通车时间 | 所属省份 |
|---|---|---|---|---|
| 实验组 | 保定市 | 满城区、徐水区、清苑区、莲池区、竞秀区 | 2012年12月26日 | 河北省 |
| 石家庄市 | 新华区、长安区、裕华区、桥西区、栾城区、鹿泉区、正定县、藁城区 | |||
| 邢台市 | 襄都区、任泽区、南和区、信都区 | |||
| 邯郸市 | 丛台区、肥乡区、邯山区、复兴区 | |||
| 对照组 | 濮阳市 | 华龙区、濮阳县 | 2022年6月20日 | 河南省 |
| 聊城市 | 东昌府区① | 2023年12月8日 | ||
| 菏泽市 | 牡丹区、定陶区 | 2021年12月26日 | 山东省 | |
| 济宁市 | 任城区 | 2021年12月26日 |
①聊城市下辖有东昌府区与荏平区,但由于荏平区城区并未与主城区东昌府区接壤,因此本文研究区只包括东昌府区。 |
表2 卫星影像使用情况Tab.2 Satellite imagery used |
| 地级市 | 2005年 | 2009年 | 2013年 | 2017年 | 2020年 |
|---|---|---|---|---|---|
| 保定 | √① | 2011*② | √ | 2018* | √ |
| 石家庄 | √ | √ | √ | 2018* | √ |
| 邢台 | Landsat③ | 2008* | √ | √ | √ |
| 邯郸 | Landsat | 2008* | √ | √ | √ |
| 聊城 | Landsat | Landsat | √ | √ | √ |
| 濮阳 | Landsat | 2010* | 2014* | √ | √ |
| 菏泽 | Landsat | Landsat | √ | √ | √ |
| 济宁 | Landsat | √ | √ | √ | 2019* |
①√表示完全符合研究要求; ②2011*表示无对应列年份的高分影像,使用邻近的2011年的高分影像代替; ③Landsat表示利用Yang等[26]根据Landsat影像所做的用地分类数据进行填补。 |
表3 高铁开通对城市发展影响遥感指标体系构建Tab.3 Remote sensing indicator system for the impact of high-speed rail opening on urban development |
| 指标计算基础 | 指标参数 | 意义 |
|---|---|---|
| 土地利用数据 | 用地扩张速率 | 反映一定时期内各类型土地变化情况 |
| 用地扩张强度 | 反映一段时期内各类型土地平均每年的变化情况 | |
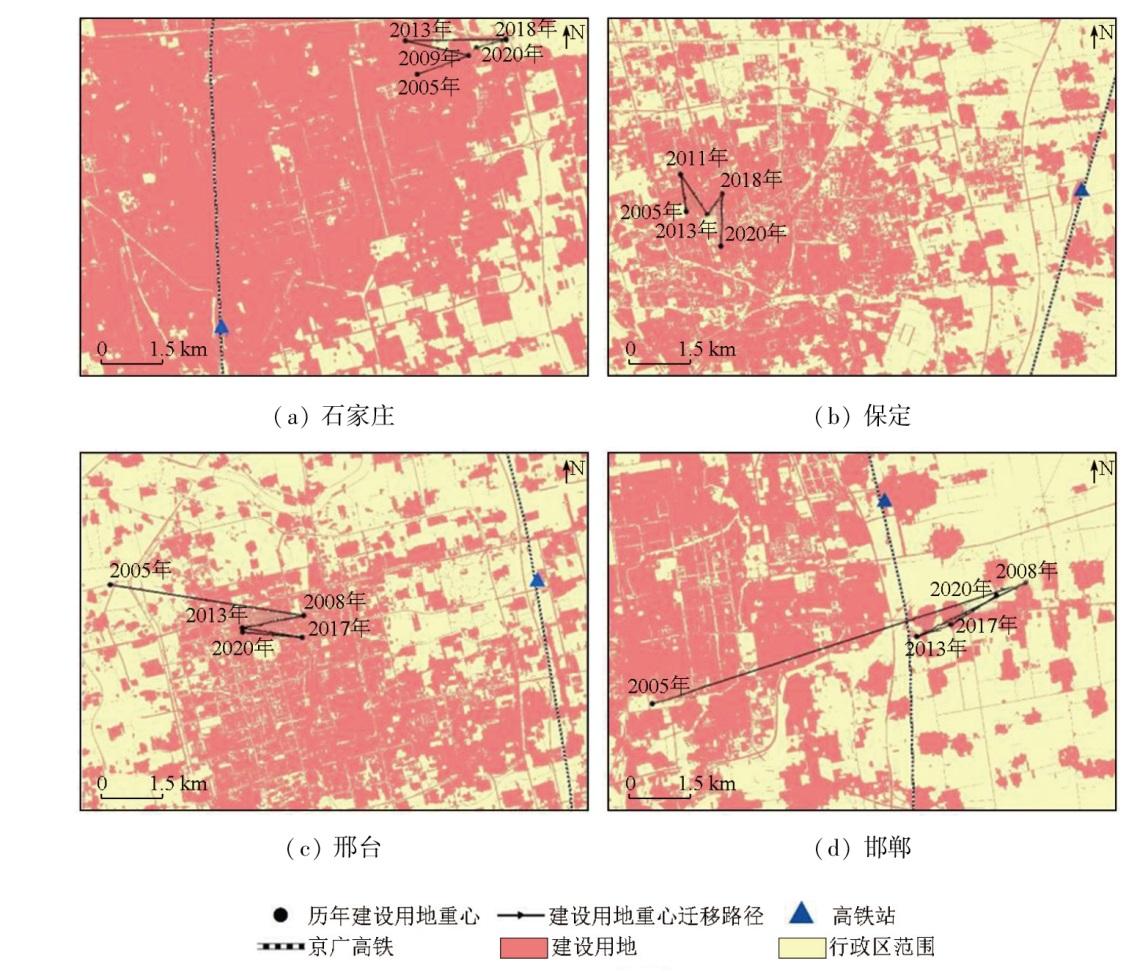
| 建设用地重心迁 移距离 | 反映城市建设用地重心迁移情况 | |
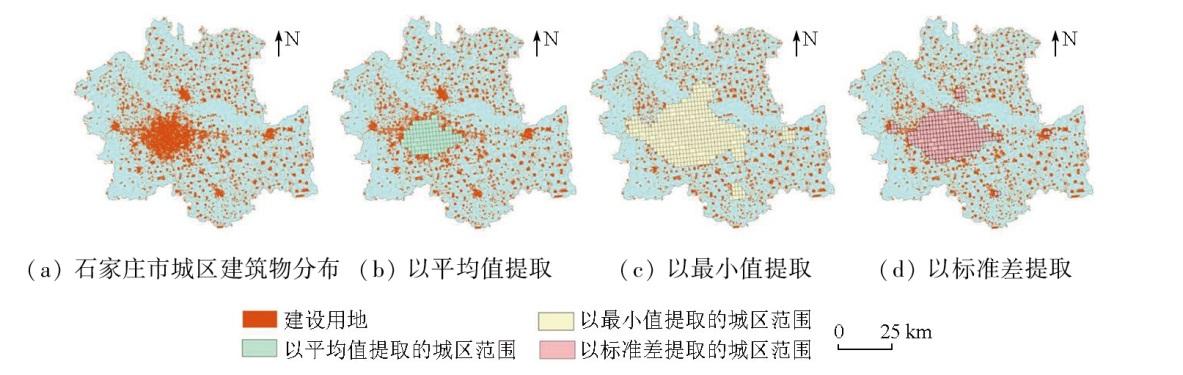
| 夜间灯光数据 | 城区扩张方向性 指数 | 反映城区向不同方向扩张的集中程度 |
表4 研究区土地分类精度Tab.4 Land classification accuracy in the study area |
| 年份 | 高分卫星影像/景 | 准确率/% | Kappa系数 |
|---|---|---|---|
| 2005年 | 2 | 92.103 | 0.854 |
| 2009年 | 6 | 91.296 | 0.892 |
| 2013年 | 7 | 97.182 | 0.964 |
| 2017年 | 8 | 97.202 | 0.973 |
| 2020年 | 8 | 97.940 | 0.962 |
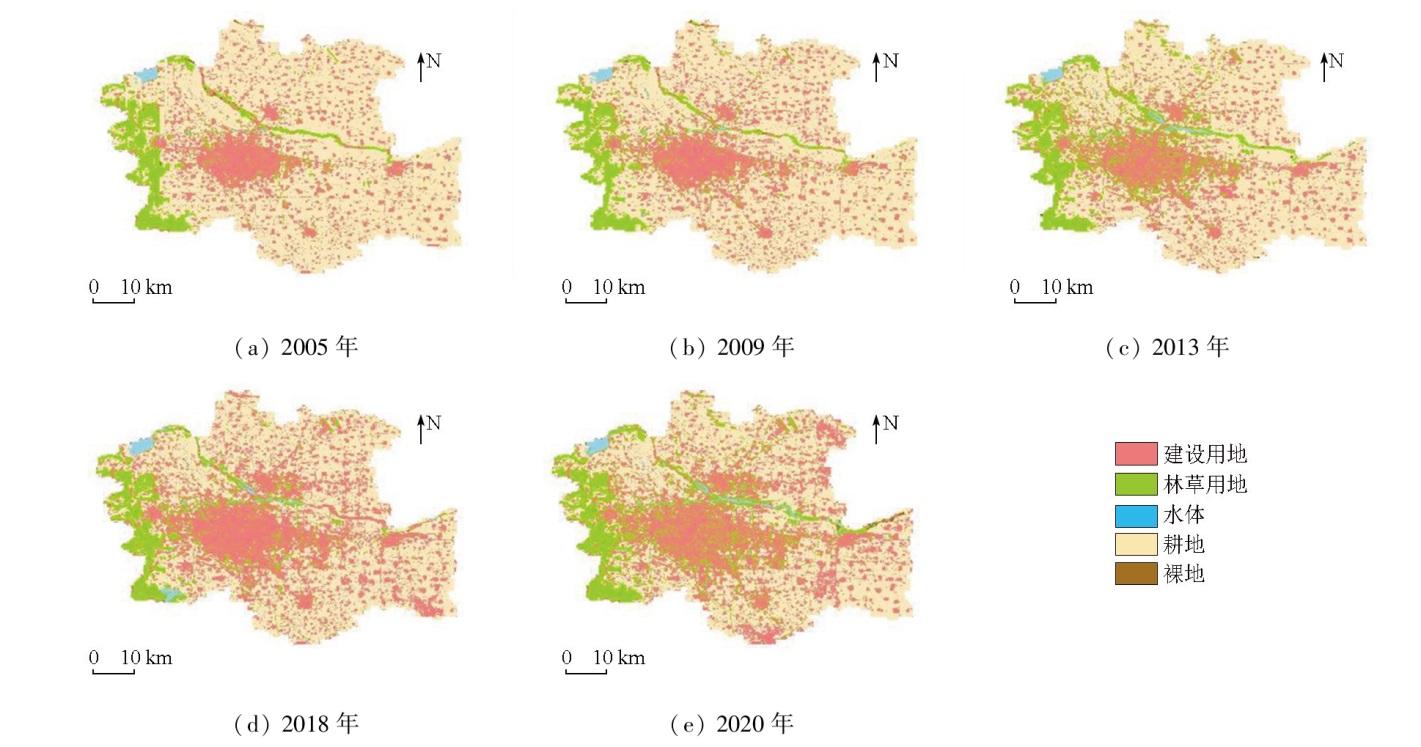
图3 石家庄市城区用地类型分类结果Fig.3 Classification results of land use types in Shijiazhuang urban area |
表5 石家庄市城区各类型用地面积变化情况Tab.5 Changes in the land area of various types in Shijiazhuang urban area(km2) |
| 年份 | 建设用地 | 林草用地 | 耕地 | 水体 | 裸地 |
|---|---|---|---|---|---|
| 2005年 | 554.89 | 228.67 | 1 497.07 | 23.34 | 4.08 |
| 2009年 | 599.21 | 237.74 | 1 429.67 | 25.20 | 3.61 |
| 2013年 | 609.36 | 354.15 | 1 298.96 | 30.00 | 2.08 |
| 2018年 | 835.41 | 258.75 | 1 164.59 | 33.21 | 2.51 |
| 2020年 | 774.83 | 387.03 | 1 093.33 | 36.10 | 4.44 |
表6 高铁沿线4市城区扩张速率与扩张强度Tab.6 Expansion rate and intensity of urban areas in the four cities along the high-speed railway |
| 城市 | 类型 | V/(km2·a-1) | R/(%·a-1) | ||||||
|---|---|---|---|---|---|---|---|---|---|
| T1 | T2 | T3 | T4 | T1 | T2 | T3 | T4 | ||
| 建设用地 | 11.080 | 2.536 | 45.210 | -30.291 | 0.020 0 | 0.004 2 | 0.074 2 | -0.036 3 | |
| 林草用地 | 2.267 | 29.103 | -19.081 | 64.140 | 0.009 9 | 0.122 4 | -0.053 9 | 0.247 9 | |
| 石家庄 | 耕地 | -16.851 | -32.677 | -26.875 | -35.631 | -0.011 3 | -0.022 9 | -0.020 7 | -0.030 6 |
| 水体 | 0.464 | 1.200 | 0.642 | 1.446 | 0.019 9 | 0.047 6 | 0.021 4 | 0.043 5 | |
| 裸地 | -0.118 | -0.383 | 0.086 | 0.967 | -0.028 9 | -0.106 2 | 0.041 3 | 0.386 0 | |
| 建设用地 | 6.970 | 18.337 | 18.428 | -5.385 | 0.016 7 | 0.040 0 | 0.037 2 | -0.009 2 | |
| 林草用地 | 14.282 | 8.452 | -75.213 | 209.186 | 0.044 0 | 0.020 6 | -0.176 2 | 4.117 0 | |
| 保定 | 耕地 | -21.887 | -25.867 | -11.311 | -33.231 | -0.015 0 | -0.019 5 | -0.008 9 | -0.027 3 |
| 水体 | 0.960 | -0.854 | -1.006 | 1.501 | 0.119 8 | -0.062 0 | -0.083 4 | 0.213 5 | |
| 裸地 | -0.029 | -0.187 | 0.022 | 0.496 | -0.017 0 | -0.122 1 | 0.018 6 | 0.391 5 | |
| 建设用地 | 6.362 | 16.189 | 1.129 | 5.064 | 0.022 5 | 0.053 7 | 0.003 0 | 0.013 1 | |
| 林草用地 | 71.906 | 5.923 | 25.032 | 4.877 | 0.075 4 | 0.005 1 | 0.020 9 | 0.003 8 | |
| 邢台 | 耕地 | -39.563 | -22.341 | -31.744 | -4.909 | -0.030 7 | -0.019 1 | -0.030 0 | -0.005 3 |
| 水体 | 1.068 | 0.694 | 3.035 | -3.139 | 0.123 9 | 0.058 7 | 0.198 4 | -0.114 4 | |
| 裸地 | -4.033 | -0.240 | 2.546 | -1.815 | -0.216 6 | -0.036 7 | 0.478 4 | -0.117 0 | |
| 建设用地 | 2.534 | 7.840 | 7.112 | 6.661 | 0.007 4 | 0.029 5 | 0.023 3 | 0.020 0 | |
| 林草用地 | 20.297 | 7.419 | 8.745 | 14.973 | 8.039 9 | 0.118 2 | 0.087 6 | 0.111 0 | |
| 邯郸 | 耕地 | -24.705 | -15.070 | -17.215 | -22.359 | -0.017 8 | -0.015 6 | -0.019 3 | -0.027 2 |
| 水体 | 0.049 | 0.286 | 1.140 | 0.720 | 0.006 0 | 0.046 2 | 0.149 6 | 0.059 1 | |
| 裸地 | 0.209 | -0.064 | 0.017 | 0.050 | 0.356 9 | -0.059 8 | 0.023 1 | 0.061 0 | |
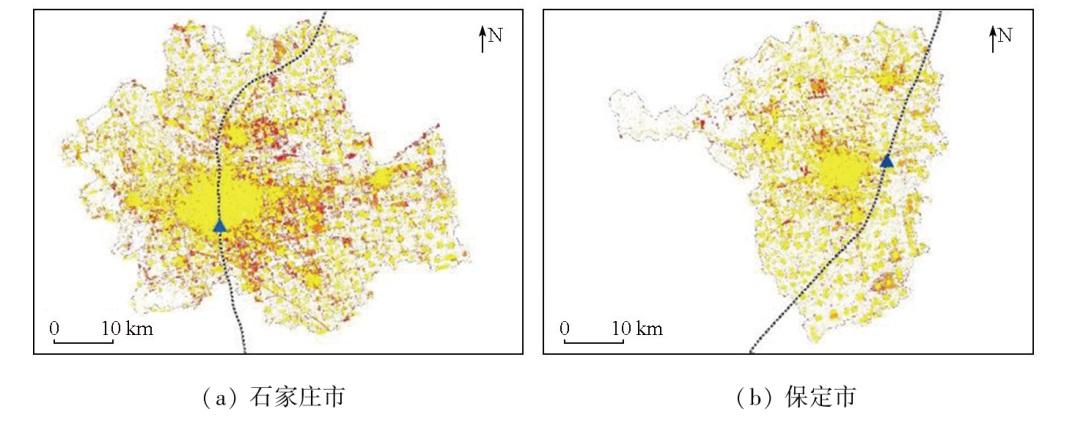
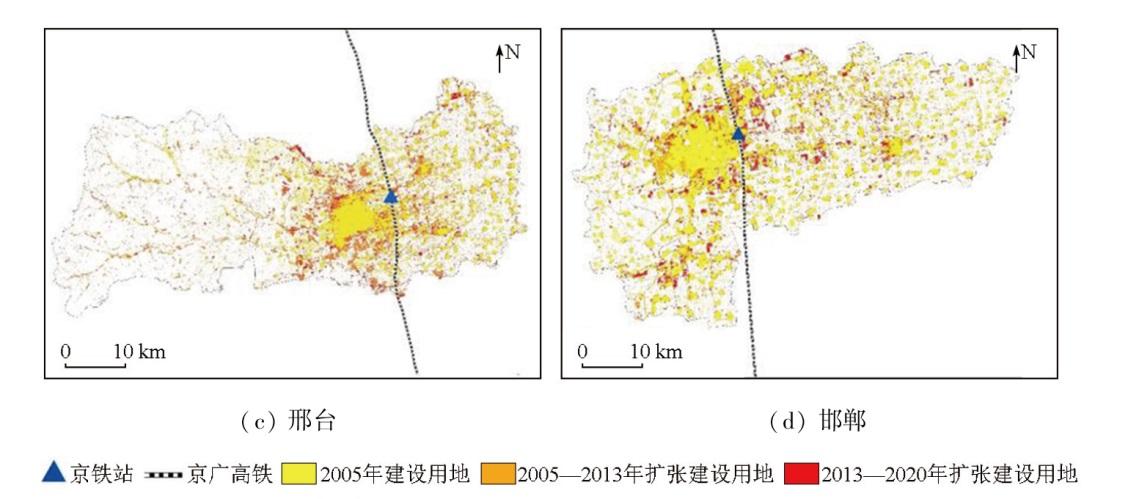
图4-1 高铁沿线4市城区建设用地扩张情况Fig.4-1 Expansion of construction land in urban areas of the four cities along the high-speed railway |
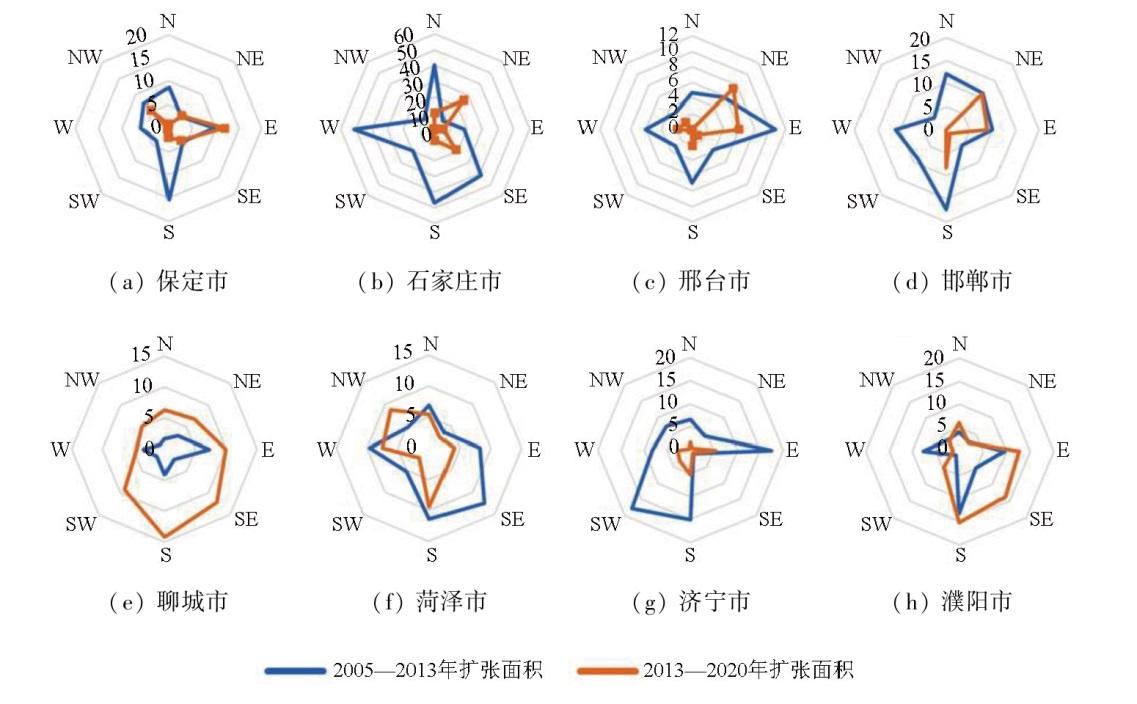
图6 研究区8座城市城区各方向扩张面积分布(单位:km2)Fig.6 Distribution of expansion areas in various directions in urban areas of the eight cities in the study area |
表7 研究区8座城市城区扩张方向性指数情况Tab.7 The directional index of expansion in urban areas of the eight cities in the study area |
| 组别 | 城市 | 方向性指数 | 平均值 |
|---|---|---|---|
| 实验组 | 保定 | 3.91 | 6.12 |
| 石家庄 | 13.37 | ||
| 邢台 | 2.64 | ||
| 邯郸 | 4.54 | ||
| 对照组 | 聊城 | 2.70 | 3.68 |
| 菏泽 | 3.03 | ||
| 济宁 | 4.18 | ||
| 濮阳 | 4.80 |
表8 DID模型变量选取情况Tab.8 Variable selection of DID model |
| 变量类型 | 名称 | 单位 | 含义 |
|---|---|---|---|
| 因变量 | 城区面积 | km2 | 反映城市城区面积 |
| 自变量 | 时间 | — | 京广高铁开通前后5个年份 |
| 控制变量 | GDP | 亿元 | 代表城市经济水平 |
| 人口数 | 人 | 代表城市规模 | |
| 第二产业产值 | 亿元 | 弥补夜间灯光无法探测的工业区经济活动 |
表9 京广高铁河北段开通对沿线4市城区面积影响的回归结果Tab.9 Regression results of the impact of the opening of the Beijing-Guangzhou high-speed railway on urban areas of the four cities along the Hebei section |
| 时间 | 组别 | 系数 | 标准误差 | t | p |
|---|---|---|---|---|---|
| 事件发生前 | 对照组(Control) | 0.408 | — | — | — |
| 实验组(Treated) | 0.571 | — | — | — | |
| Diff(T-C) | 0.162 | 0.102 | 1.586 | 0.125 | |
| 事件发生后 | 对照组(Control) | 0.096 | — | — | — |
| 实验组(Treated) | -0.020 | — | — | — | |
| Diff(T-C) | -0.116 | 0.076 | -1.515 | 0.142 | |
| Diff(T-C)(未加入控制变量) | -0.132 | 0.073 | -1.814 | 0.080*① | |
| Diff-in-Diff | -0.278 | 0.113 | -2.457 | 0.022** |
①**和*分别代表5%和10%的显著性水平。 |
| [1] |
中国城市规划设计研究院. GB/T 50280—98 城市规划基本术语标准[S]. 北京: 国家市场监督管理总局,1998.
China Academy of Urban Planning and Design. GB/T 50280—98 standard for basic terminology of urban planning[S]. Beijing: State Administration for Market Regulation,1998.
|
| [2] |
|
| [3] |
|
| [4] |
覃成林, 杨晴晴. 高速铁路发展与城市生产性服务业集聚[J]. 经济经纬, 2016, 33(3):1-6.
|
| [5] |
李廷智, 杨晓梦, 赵星烁, 等. 高速铁路对城市和区域空间发展影响研究综述[J]. 城市发展研究, 2013, 20(2):71-79.
|
| [6] |
唐可月. 高速铁路对沿线站点城市经济发展的影响——以哈大高铁和郑西高铁为例[J]. 北京交通大学学报(社会科学版), 2020, 19(4):45-61.
|
| [7] |
于策, 李远富, 林芳, 等. 基于GIS的津保铁路对沿线城市可达性影响分析[J]. 铁道运输与经济, 2017, 39(5):18-22.
|
| [8] |
张喆, 王晓梦, 姜雨皓, 等. 中老泰铁路建设对云南省及沿线国家空间联系格局的影响——基于城市流网络的分析[J]. 世界地理研究, 2019, 28(3):43-53.
|
| [9] |
|
| [10] |
|
| [11] |
|
| [12] |
|
| [13] |
|
| [14] |
|
| [15] |
戴学珍, 徐敏, 李杰. 京沪高速铁路对沿线城市效率和空间公平的影响[J]. 经济地理, 2016, 36(3):72-77,108.
|
| [16] |
蒋华雄, 蔡宏钰, 孟晓晨. 高速铁路对中国城市产业结构的影响研究[J]. 人文地理, 2017, 32(5):132-138.
|
| [17] |
李响, 刘心怡, 李卫东, 等. 京沪高铁开通对房地产就业的影响——基于DID模型[J]. 综合运输, 2022, 44(3):24-28,54.
|
| [18] |
程婉静, 莫东序, 梁心悦, 等. 中国神黄铁路运煤专线开通对地区产业结构的影响——基于DID模型的实证研究[J]. 煤炭经济研究, 2020, 40(1):4-10.
|
| [19] |
黄振宇, 吴立春. 京沪高铁对沿线城市经济的影响——基于空间经济学理论的实证分析[J]. 宏观经济研究, 2020(2):165-175.
|
| [20] |
吴嘉贤, 刘修岩. 高铁开通与中国农村减贫——来自遥感数据的证据[J]. 世界经济文汇, 2022(1):1-17.
|
| [21] |
|
| [22] |
张永庆, 刘聪. 高铁建设对江苏沿线区域发展影响研究——基于双重差分模型的估计[J]. 物流科技, 2021, 44(1):85-88.
|
| [23] |
|
| [24] |
刘长龙, 常军, 刘娜, 等. 高速铁路的建设对沿线区域土地利用变化影响研究——以京沪高铁山东段为例[J]. 西安理工大学学报, 2020, 36(3):367-375,423.
|
| [25] |
徐盼, 张晓祥, 晏王波, 等. 城市交通干线对盐城城市发展影响的空间分析[J]. 地球信息科学学报, 2013, 15(1):29-37.
|
| [26] |
|
| [27] |
仲晓雅, 闫庆武, 李桂娥. 中国长时间序列夜间灯光数据集的研发(2000—2020)[J]. 全球变化数据学报(中英文), 2022, 6(3):416-424,593-601.
|
| [28] |
|
| [29] |
邓刘洋, 沈占锋, 柯映明. 城市建成区遥感影像边界提取与扩张分析[J]. 地球信息科学学报, 2018, 20(7):996-1003.
|
| [30] |
陈美招, 张炜康, 郑荣宝. 高铁开通促进了沿线城镇经济活动吗——来自双源夜间灯光证据[J]. 中国地质大学学报(社会科学版), 2021, 21(6):119-133.
|
/
| 〈 |
|
〉 |