
Remote Sensing for Natural Resources >
Spatiotemporal variations of geological disaster risk and obstacle factor diagnosis: A case study of the western Sichuan region
Received date: 2024-04-07
Revised date: 2024-07-24
Online published: 2026-06-03
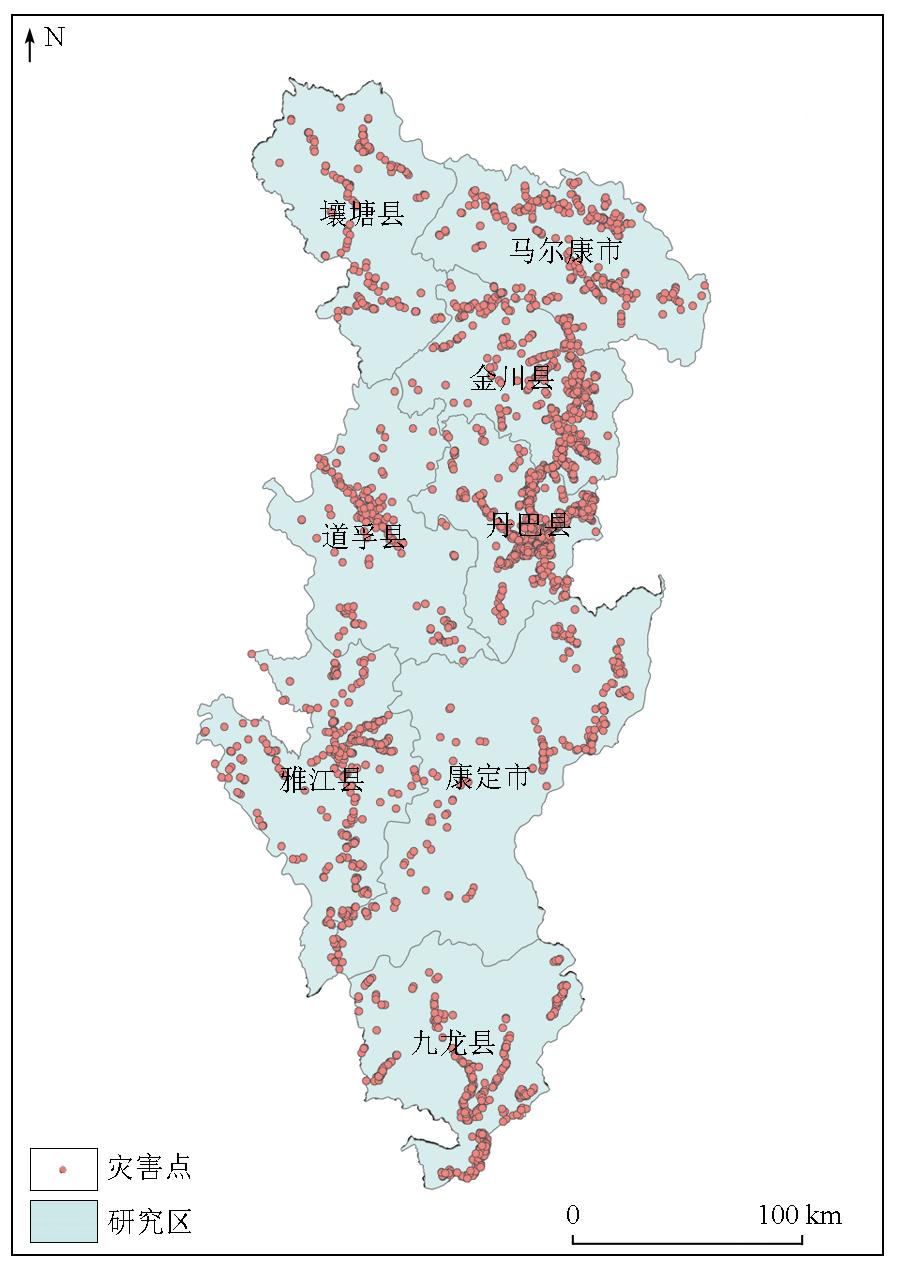
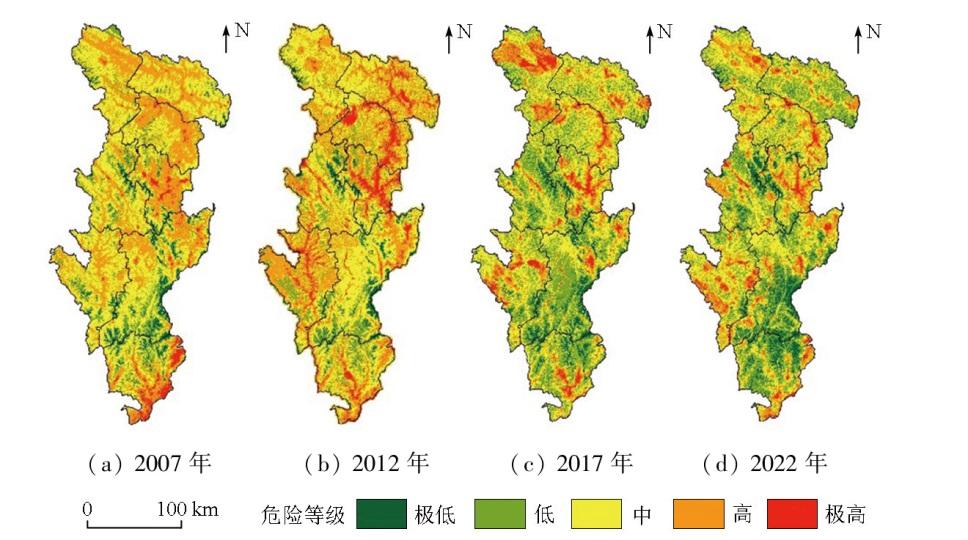
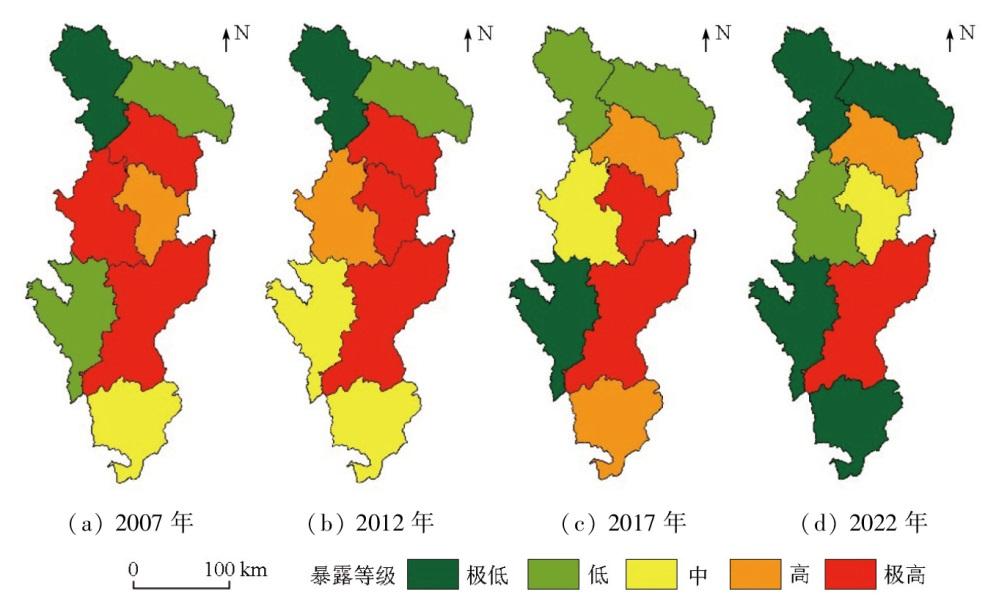
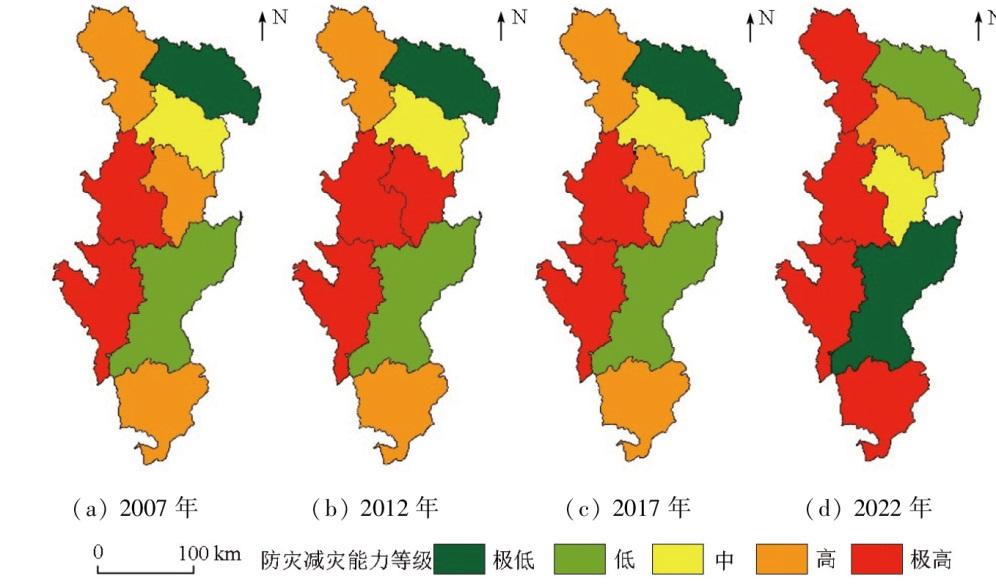
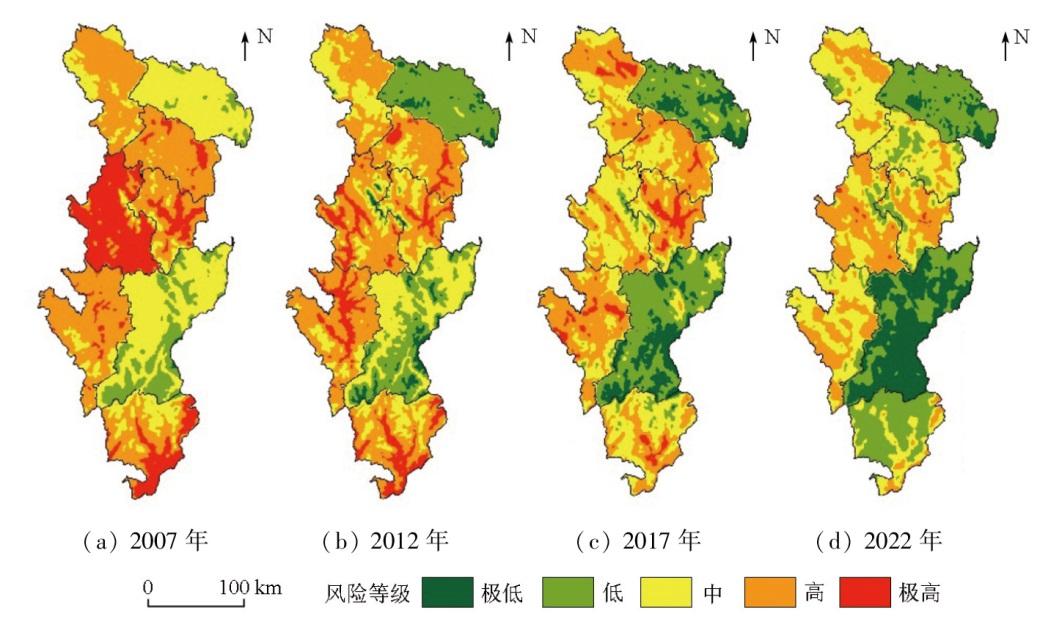
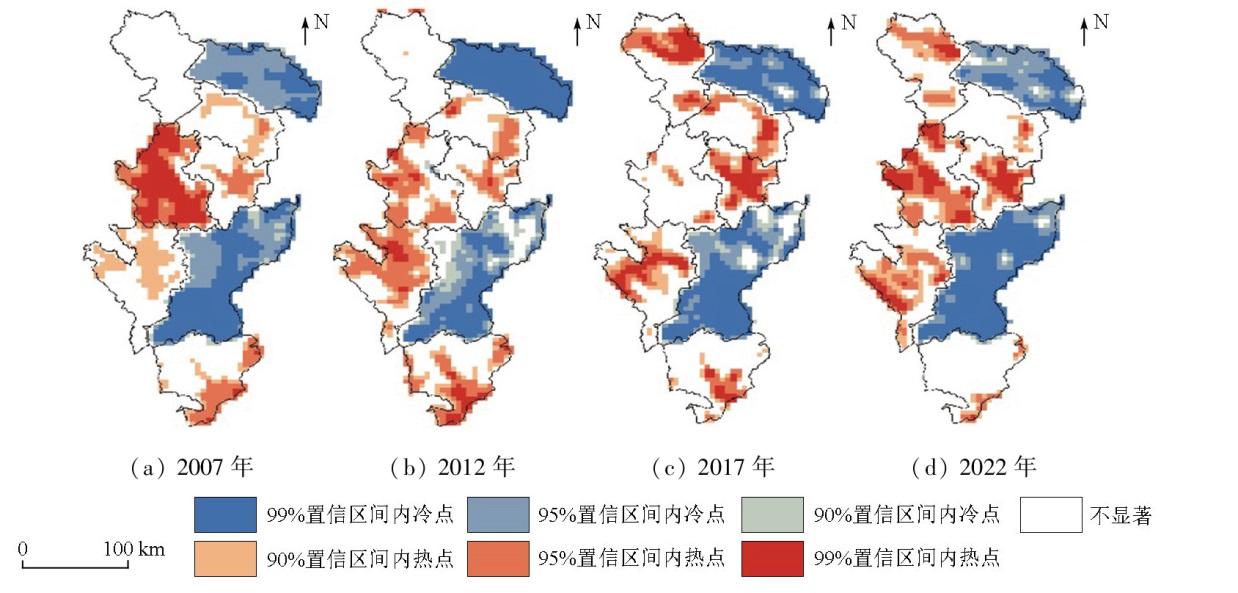
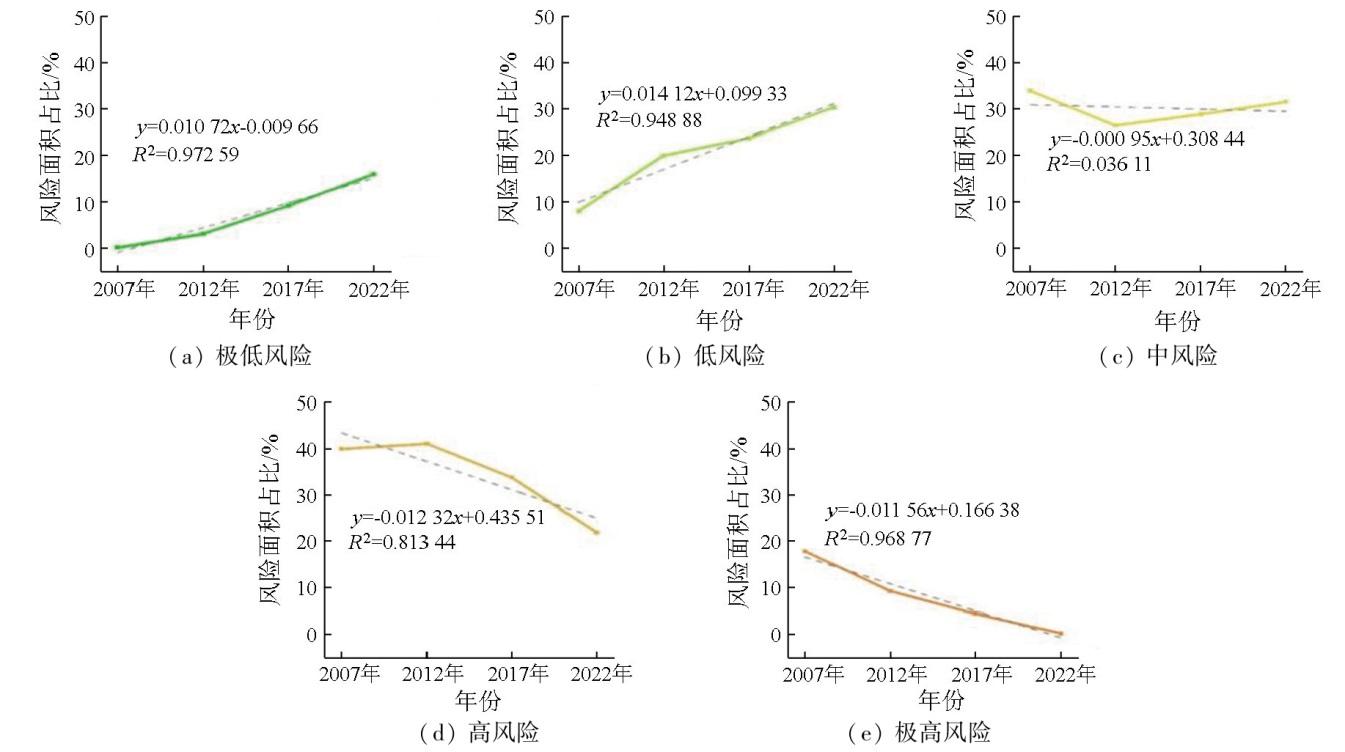
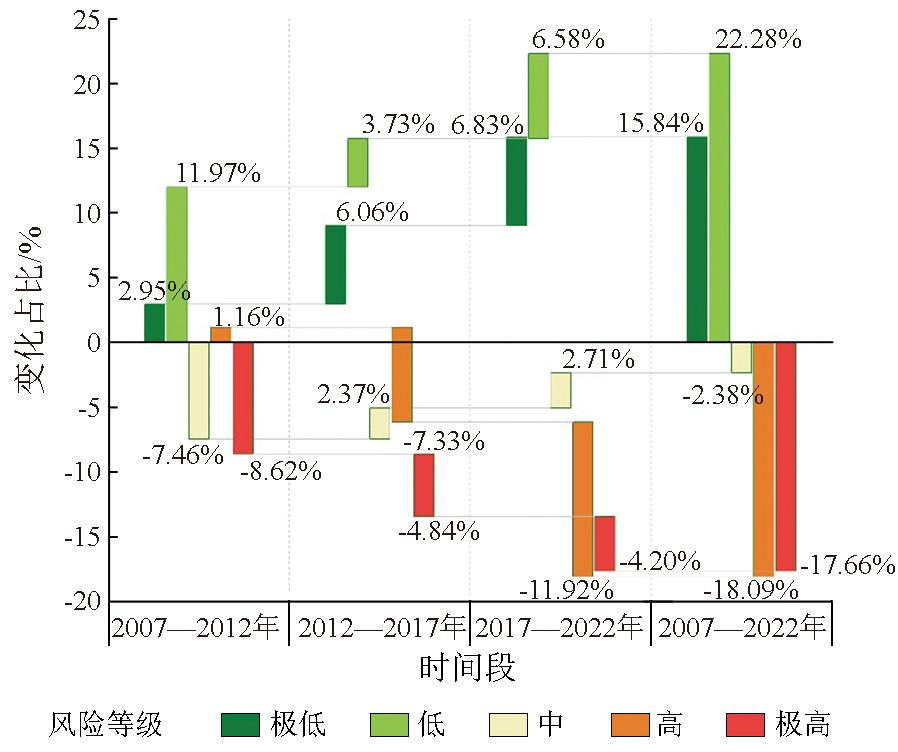
Geological disasters, influenced by natural and human factors, directly threaten the safety of people’s lives and property. Exploring the spatiotemporal variations and development mechanisms of geological disaster risk can enhance disaster prevention and mitigation. This study examined 31 factors such as topography, rainfall, and social economy from the perspectives of nature and humanity. Based on the four-factor risk theory, this study investigated the variations of geological disaster risk in the western Sichuan region using methods like the analytic hierarchy process, principal component analysis, information value model, entropy weight method, and hot/cold spot analysis. Employing the obstacle degree model, this study explored the degrees of influence of various factors on geological disaster risk in the western Sichuan region. The results indicate that from 2007 to 2022, the geological disaster risk in the western Sichuan region was generally characterized by higher levels in the west and lower levels in the east. Kangding and Maerkang were the concentrated distribution areas of perennial cold spots. The area of extremely low and low risk levels increased by 8 871.1 km2 and 12 478.6 km2 respectively at growth rates of 1.056%/a and 1.485%/a respectively. The area of high and extremely high risk levels decreased by 10 127.8 km2 and 9 880.1 km2 respectively at growth rates of -0.02484 km2/a. The degrees of influence of various factors on risk levels exhibited temporal heterogeneity. The dominant obstacle factors (obstacle degree: above 5 %) were concentrated in risk and disaster prevention and mitigation indicators. Factors including rainfall, topography, and medical resources contributed significantly to geological disaster risk.
YANG Hengjun , YANG Xin , ZHOU Xiong . Spatiotemporal variations of geological disaster risk and obstacle factor diagnosis: A case study of the western Sichuan region[J]. Remote Sensing for Natural Resources, 2025 , 37(4) : 140 -151 . DOI: 10.6046/zrzyyg.2024119
表1 地质灾害风险评价因子表Tab.1 Geological hazard risk assessment factors |
| 目标层 | 准则层 | 因子层 |
|---|---|---|
| 风险 评价 | 危险性 | 高程 |
| 坡度 | ||
| 坡向 | ||
| 起伏度 | ||
| 地震峰值加速度 | ||
| 年均降雨量 | ||
| 地层岩性 | ||
| 土地利用类型 | ||
| 道路 | ||
| 水系 | ||
| 距断层距离 | ||
| 植被覆盖度 | ||
| 风险 评价 | 脆弱性 | 农业人口占比 |
| 第一产业占比 | ||
| 耕地面积占比 | ||
| 粮食产量 | ||
| 农林牧渔产值 | ||
| 规模以上工业企业数量 | ||
| 暴露性 | 人口数量及密度 | |
| 地区生产总值 | ||
| 农田面积占比 | ||
| 建筑面积占比 | ||
| 林地面积占比 | ||
| 草地面积占比 | ||
| 防灾减灾能力 | 地方财政支出 | |
| 居民人均可支配收入 | ||
| 每千人医院数量 | ||
| 每千人床位数量 | ||
| 每千人医生数量 | ||
| 每千人护士数量 | ||
| 每千人卫生技术人员数量 |
表2 危险性评价因子信息量值(I)与权重(W)Tab.2 Information value(I) and weight(W) of risk assessment factors |
| 因子 | 分级 | 2007年 | 2012年 | 2017年 | 2022年 | ||||
|---|---|---|---|---|---|---|---|---|---|
| I | W | I | W | I | W | I | W | ||
| 高程/m | [0,1 500) | 0.344 | 0.037 | 0.939 | 0.049 | 0.427 | 0.092 | 0.376 | 0.028 |
| [1 500,2 500) | 0.346 | 0.960 | 0.416 | 0.366 | |||||
| [2 500,3 500) | 0.273 | 0.877 | 0.367 | 0.324 | |||||
| [3 500,4 500) | 0.134 | 0.696 | 0.264 | 0.233 | |||||
| [4 500,+∞) | 0.236 | 0.223 | 0.135 | 0.118 | |||||
| 坡度/(°) | [0,15) | 0.166 | 0.108 | 0.104 | 0.110 | 0.132 | 0.049 | 0.113 | 0.101 |
| [15,25) | 0.125 | 0.083 | 0.097 | 0.084 | |||||
| [25,35) | 0.067 | 0.045 | 0.057 | 0.051 | |||||
| [35,45) | 0.071 | 0.045 | 0.062 | 0.049 | |||||
| [45,90) | 0.111 | 0.059 | 0.062 | 0.057 | |||||
| 坡向/(°) | [0,45) | 0.073 | 0.09 | 0.061 | 0.091 | 0.044 | 0.058 | 0.029 | 0.063 |
| [45,135) | 0.076 | 0.099 | 0.062 | 0.041 | |||||
| [135,225) | 0.059 | 0.076 | 0.053 | 0.035 | |||||
| [225,315) | 0.036 | 0.061 | 0.030 | 0.020 | |||||
| [315,360) | 0.029 | 0.026 | 0.020 | 0.013 | |||||
| 起伏度/m | [0,30) | 0.118 | 0.106 | 0.572 | 0.110 | 0.110 | 0.110 | 0.103 | 0.101 |
| [30,70) | 0.044 | 0.519 | 0.050 | 0.047 | |||||
| [70,200) | 0.063 | 0.524 | 0.041 | 0.038 | |||||
| [200,300) | 0.074 | 0.103 | 0.071 | 0.067 | |||||
| [300,+∞) | 0.074 | 0.577 | 0.071 | 0.067 | |||||
| 地震峰值加速度/(m·s-2) | 0.10 g | 0.074 | 0.099 | 0.142 | 0.092 | 0.121 | 0.082 | 0.113 | 0.089 |
| 0.15 g | 0.077 | 0.147 | 0.118 | 0.105 | |||||
| 0.20 g | 0.043 | 0.078 | 0.036 | 0.031 | |||||
| 0.30 g | 0.019 | 0.042 | 0.061 | 0.058 | |||||
| 0.40 g | 0.064 | 0.065 | 0.101 | 0.092 | |||||
| 年均降雨量/mm | [0,700) | 0.417 | 0.115 | 0.910 | 0.109 | 0.355 | 0.055 | 0.155 | 0.104 |
| [700,750) | 0.289 | 0.534 | 0.079 | 0.187 | |||||
| [750,800) | 0.257 | 0.529 | 0.064 | 0.129 | |||||
| [800,850) | 0.461 | 0.439 | 0.022 | 0.104 | |||||
| [850,+∞) | 0.604 | 0.496 | 0.044 | 0.261 | |||||
| 地层岩性 | 坚硬岩 | 0.132 | 0.074 | 0.715 | 0.102 | 0.094 | 0.091 | 0.108 | 0.090 |
| 较坚硬岩 | 0.067 | 0.684 | 0.087 | 0.103 | |||||
| 较软岩 | 0.174 | 0.814 | 0.172 | 0.203 | |||||
| 软岩 | 0.105 | 0.127 | 0.109 | 0.128 | |||||
| 极软岩 | 0.105 | 0.605 | 0.065 | 0.078 | |||||
| 道路/m | [0,100) | 0.697 | 0.065 | 0.367 | 0.055 | 0.375 | 0.109 | 0.300 | 0.097 |
| [100,200) | 0.588 | 0.313 | 0.273 | 0.174 | |||||
| [200,300) | 0.548 | 0.236 | 0.240 | 0.138 | |||||
| [300,400) | 0.469 | 0.272 | 0.208 | 0.142 | |||||
| [400,+∞) | 0.339 | 0.179 | 0.173 | 0.153 | |||||
| 水系/m | [0,100) | 0.683 | 0.064 | 0.481 | 0.091 | 0.429 | 0.110 | 0.123 | 0.092 |
| [100,200) | 0.589 | 0.430 | 0.325 | 0.137 | |||||
| [200,300) | 0.501 | 0.373 | 0.282 | 0.119 | |||||
| [300,400) | 0.448 | 0.361 | 0.284 | 0.146 | |||||
| [400,+∞) | 0.336 | 0.231 | 0.196 | 0.061 | |||||
| 距断层距离/m | [0,500) | 0.138 | 0.086 | 0.073 | 0.051 | 0.094 | 0.102 | 0.077 | 0.083 |
| [500,1 000) | 0.118 | 0.072 | 0.091 | 0.064 | |||||
| [1 000,2 000) | 0.097 | 0.041 | 0.054 | 0.049 | |||||
| [2 000,3 000) | 0.114 | 0.057 | 0.057 | 0.037 | |||||
| [3 000,+∞) | 0.062 | 0.039 | 0.053 | 0.042 | |||||
| 植被覆盖度 | [0,0.2) | 0.130 | 0.096 | 0.031 | 0.058 | 0.031 | 0.051 | 0.021 | 0.081 |
| [0.2,0.4) | 0.111 | 0.129 | 0.173 | 0.050 | |||||
| [0.4,0.6) | 0.176 | 0.193 | 0.181 | 0.030 | |||||
| [0.6,0.8) | 0.164 | 0.190 | 0.182 | 0.051 | |||||
| [0.8,1] | 0.054 | 0.152 | 0.200 | 0.021 | |||||
| 土地利用类型 | 裸地 | 0.178 | 0.058 | 0.273 | 0.082 | 0.175 | 0.091 | 0.251 | 0.070 |
| 草原 | 0.331 | 1.023 | 0.340 | 0.441 | |||||
| 森林 | 0.335 | 1.032 | 0.361 | 0.443 | |||||
| 水域 | 0.219 | 1.338 | 0.288 | 0.501 | |||||
| 耕地 | 0.495 | 1.295 | 0.528 | 0.665 | |||||
| 城镇 | 0.457 | 0.984 | 0.500 | 0.713 | |||||
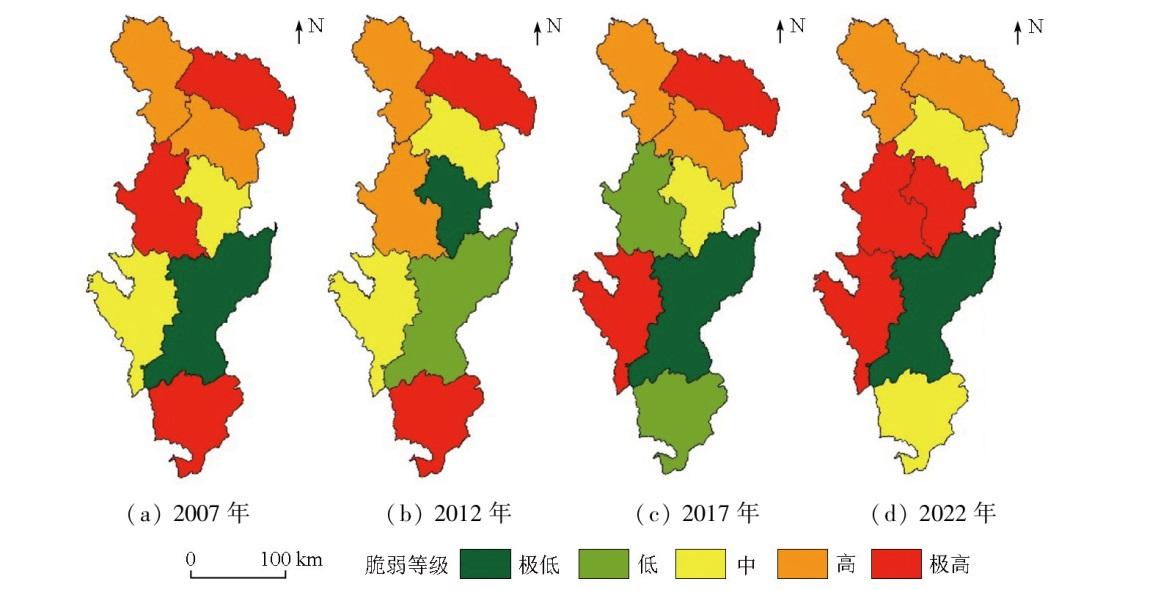
表3 脆弱性、暴露性和防灾减灾能力指标权重Tab.3 Weight of indicators for vulnerability, exposure, and disaster prevention and mitigation capability |
| 指标 | 时间 | 道孚县 | 雅江县 | 丹巴县 | 九龙县 | 壤塘县 | 金川县 | 康定市 | 马尔康市 |
|---|---|---|---|---|---|---|---|---|---|
| 防灾减 灾能力 | 2007年 | 1.536 | 1.605 | 1.506 | 1.371 | 1.471 | 1.351 | 0.999 | 0.891 |
| 2012年 | 1.733 | 1.731 | 1.704 | 1.673 | 1.620 | 1.613 | 1.246 | 0.906 | |
| 2017年 | 1.691 | 1.695 | 1.630 | 1.661 | 1.600 | 1.545 | 1.110 | 0.951 | |
| 2022年 | 1.726 | 1.698 | 1.518 | 1.654 | 1.708 | 1.616 | 0.983 | 1.084 | |
| 脆弱性 | 2007年 | 0.996 | 0.817 | 0.749 | 0.962 | 0.829 | 0.880 | 0.681 | 0.922 |
| 2012年 | 0.898 | 0.885 | 0.662 | 0.947 | 0.934 | 0.843 | 0.684 | 0.994 | |
| 2017年 | 0.828 | 0.941 | 0.837 | 0.812 | 0.915 | 0.877 | 0.652 | 1.008 | |
| 2022年 | 1.325 | 1.102 | 1.211 | 0.960 | 1.092 | 0.858 | 0.781 | 0.969 | |
| 暴露性 | 2007年 | 1.060 | 0.767 | 1.001 | 0.895 | 0.674 | 1.115 | 1.076 | 0.828 |
| 2012年 | 0.834 | 0.780 | 1.103 | 0.820 | 0.679 | 0.886 | 1.108 | 0.699 | |
| 2017年 | 0.759 | 0.656 | 0.983 | 0.779 | 0.669 | 0.964 | 1.033 | 0.739 | |
| 2022年 | 0.857 | 0.747 | 1.000 | 0.753 | 0.747 | 1.100 | 1.259 | 0.804 |
表4 层次分析法结果Tab.4 Results of analytic hierarchy process |
| 危险性 | 防灾减 灾能力 | 脆弱性 | 暴露性 | Wi | |
|---|---|---|---|---|---|
| 危险性 | 1 | 3 | 4 | 5 | 0.520 0 |
| 防灾减灾能力 | 1/3 | 1 | 3 | 4 | 0.268 2 |
| 脆弱性 | 1/4 | 1/3 | 1 | 3 | 0.140 9 |
| 暴露性 | 1/5 | 1/4 | 1/3 | 1 | 0.070 9 |
表5 危险等级面积占比Tab.5 Proportion of area by risk levels |
| 危险 等级 | 2007年 | 2012年 | 2017年 | 2022年 | ||||||||
|---|---|---|---|---|---|---|---|---|---|---|---|---|
| 灾害点/ 个 | 灾害点 占比/% | 区域面积 占比/% | 灾害点/ 个 | 灾害点 占比/% | 区域面积 占比/% | 灾害点/ 个 | 灾害点 占比/% | 区域面积 占比/% | 灾害点/ 个 | 灾害点 占比/% | 区域面积 占比/% | |
| 极低 | 0 | 0.00 | 4.51 | 0 | 0.00 | 2.86 | 0 | 0.00 | 6.48 | 2 | 0.07 | 8.57 |
| 低 | 2 | 0.53 | 13.07 | 0 | 0.00 | 10.90 | 98 | 3.62 | 32.48 | 114 | 3.78 | 29.87 |
| 中 | 37 | 9.76 | 41.62 | 42 | 3.14 | 38.64 | 608 | 22.45 | 38.49 | 543 | 18.02 | 36.33 |
| 高 | 175 | 46.17 | 37.82 | 428 | 31.96 | 39.33 | 839 | 30.98 | 16.66 | 1 080 | 35.84 | 20.07 |
| 极高 | 165 | 43.54 | 2.98 | 869 | 64.90 | 8.27 | 1 163 | 42.95 | 5.90 | 1 274 | 42.28 | 5.16 |
表6 障碍度诊断主要因子Tab.6 Main factors for obstacle assessment(%) |
| 指标 | 因子 | 2007年 | 2012年 | 2017年 | 2022年 |
|---|---|---|---|---|---|
| 危险性 | 地震峰值加速度 | 7.21 | 6.24 | 7.06 | 7.04 |
| 年均降雨量 | 7.46 | 6.55 | 7.88 | 6.68 | |
| 土地利用类型 | 5.60 | 5.56 | 5.17 | 5.85 | |
| 起伏度 | 7.25 | 8.01 | 7.92 | 8.02 | |
| 坡度 | 6.33 | 6.18 | 6.43 | 6.67 | |
| 坡向 | — | 6.05 | 6.03 | — | |
| 防灾减 灾能力 | 地方财政总支出 | 5.12 | — | 5.19 | 5.77 |
| 每千人病床张数 | 5.48 | 5.49 | — | 5.44 | |
| 每千人卫生技术人员数 | — | 5.53 | 5.30 | — | |
| 每千人护士数 | 6.80 | 7.72 | 7.27 | 7.27 |
| [1] |
中华人民共和国自然资源部. 2022年中国自然资源统计公报[R/OL]. 2023(2023-04-12). https://gi.mnr.gov.cn/202304/t20230412_2781113.html.
Ministry of Natural Resources of the People’s Republic of China. Statistical bulletin of China’s natural resources in 2022[R/OL]. 2023(2023-04-12). https://gi.mnr.gov.cn/202304/t20230412_2781113.html.
|
| [2] |
齐信, 唐川, 陈州丰, 等. 地质灾害风险评价研究[J]. 自然灾害学报, 2012, 21(5):33-40.
|
| [3] |
甄艳, 鲁小丫, 蒲慧龙, 等. 都江堰虹口乡地质灾害风险评价[J]. 测绘科学, 2016, 41(11):66-71,97.
|
| [4] |
杨淞月, 翁茂芝, 田华, 等. 湖北省鹤峰县城区滑坡地质灾害风险评价[J]. 安全与环境工程, 2021, 28(1):144-155.
|
| [5] |
唐亚明, 张茂省, 李林, 等. 滑坡易发性危险性风险评价例析[J]. 水文地质工程地质, 2011, 38(2):125-129.
|
| [6] |
徐庆方, 何开寿, 胡励耘, 等. 基于危险源识别的山区地质灾害风险定量评价——以贵州省茅台镇为例[J]. 安全与环境工程, 2023, 30(5):152-165.
|
| [7] |
周超, 常鸣, 徐璐, 等. 贵州省典型城镇矿山地质灾害风险评价[J]. 武汉大学学报(信息科学版), 2020, 45(11):1782-1791.
|
| [8] |
刘纪平, 梁恩婕, 徐胜华, 等. 顾及样本优化选择的多核支持向量机滑坡灾害易发性分析评价[J]. 测绘学报, 2022, 51(10):2034-2045.
|
| [9] |
|
| [10] |
艾力, 杨冰玉, 郭丽. 基于不同模型和单元的滑坡易发性评价比较[J]. 地理空间信息, 2020, 18(6):117-121.
|
| [11] |
周保, 隋嘉, 孙皓, 等. 基于多源遥感数据的青海省地质灾害评价[J]. 自然灾害学报, 2022, 31(4):231-240.
|
| [12] |
舒和平, 马金珠, 张鹏, 等. 不同降雨频率单沟泥石流灾害风险评价[J]. 兰州大学学报(自然科学版), 2014, 50(5):653-658.
|
| [13] |
|
| [14] |
颜阁, 梁收运, 赵红亮. 基于GIS的斜坡单元划分方法改进与实现[J]. 地理科学, 2017, 37(11):1764-1770.
|
| [15] |
|
| [16] |
赵萍, 赵思逸, 孙雨, 等. 基于斜坡单元和语义分割的皖南地区滑坡灾害易发性评估[J]. 地质科学, 2024, 59(2):562-574.
|
| [17] |
唐川, 马国超. 基于地貌单元的小区域地质灾害易发性分区方法研究[J]. 地理科学, 2015, 35(1):91-98.
|
| [18] |
张群, 易靖松, 张勇, 等. 西南山区县域单元的地质灾害风险评价——以怒江流域泸水市为例[J]. 自然灾害学报, 2022, 31(5):212-221.
|
| [19] |
温鑫, 范宣梅, 陈兰, 等. 基于信息量模型的地质灾害易发性评价:以川东南古蔺县为例[J]. 地质科技通报, 2022, 41(2):290-299.
|
| [20] |
卢晓宁, 洪佳, 王玲玲, 等. 复杂地形地貌背景区干旱风险评价[J]. 农业工程学报, 2015, 31(1):162-169.
|
| [21] |
陈骏炜, 张继权, 阿鲁思, 等. 基于PSO-AHP方法的山区泥石流灾害风险评价——以吉林省蛟河市为例[J]. 东北师大学报(自然科学版), 2019, 51(3):152-160.
|
| [22] |
周斌, 邹强, 蒋虎, 等. 川西高原气候变化特征及泥石流动态危险性响应研究[J]. 自然灾害学报, 2022, 31(4):241-255.
|
| [23] |
李宏艳, 张琰茹, 付国, 等. 焦化污染区春季VOCs的污染特征及其控制策略[J]. 中国环境科学, 2024, 44(3):1234-1243.
|
| [24] |
温亚楠, 张志华, 慕号伟, 等. 动态多源数据驱动模式下的滑坡灾害空间预测[J]. 自然灾害学报, 2021, 30(3):83-92.
|
| [25] |
|
/
| 〈 |
|
〉 |