
Remote Sensing for Natural Resources >
Investigating land use and carbon storage changes in Jinan metropolitan circle based on the InVEST-PLUS coupled model
Received date: 2024-04-07
Revised date: 2024-07-21
Online published: 2026-06-03
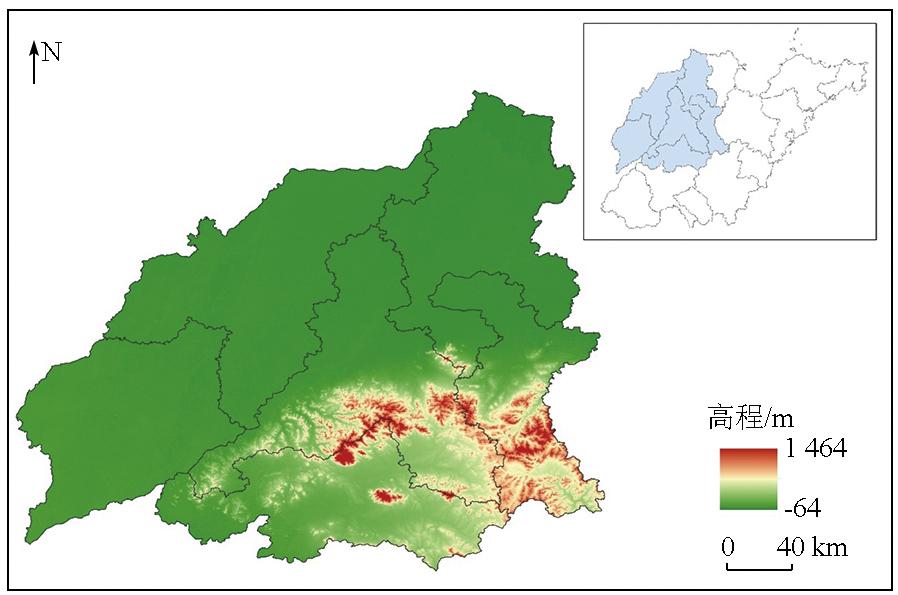
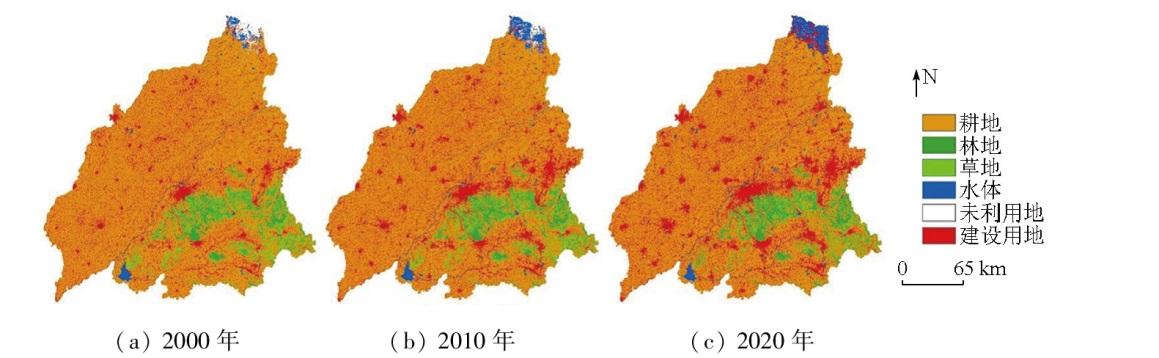
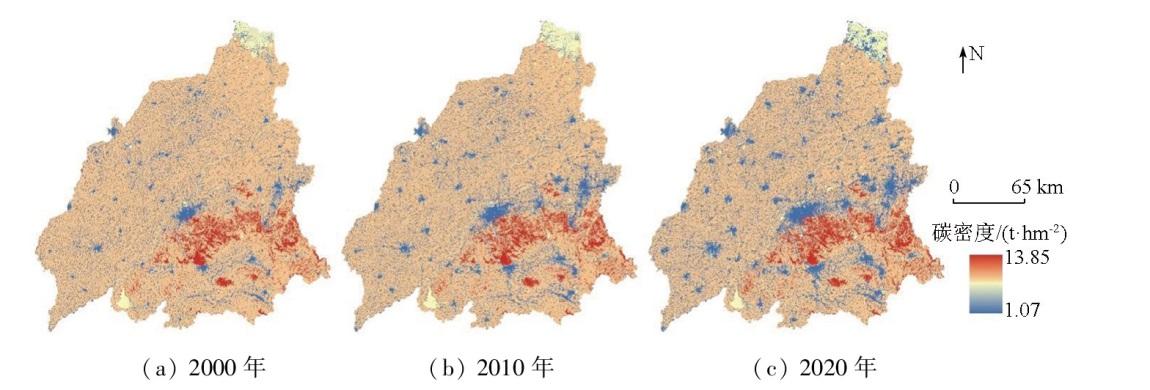
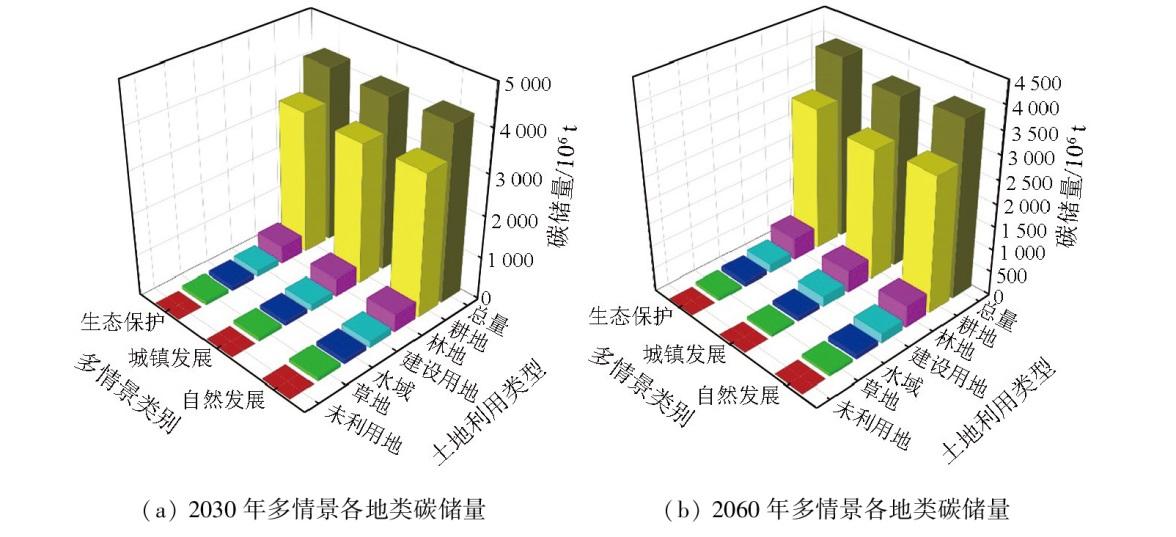
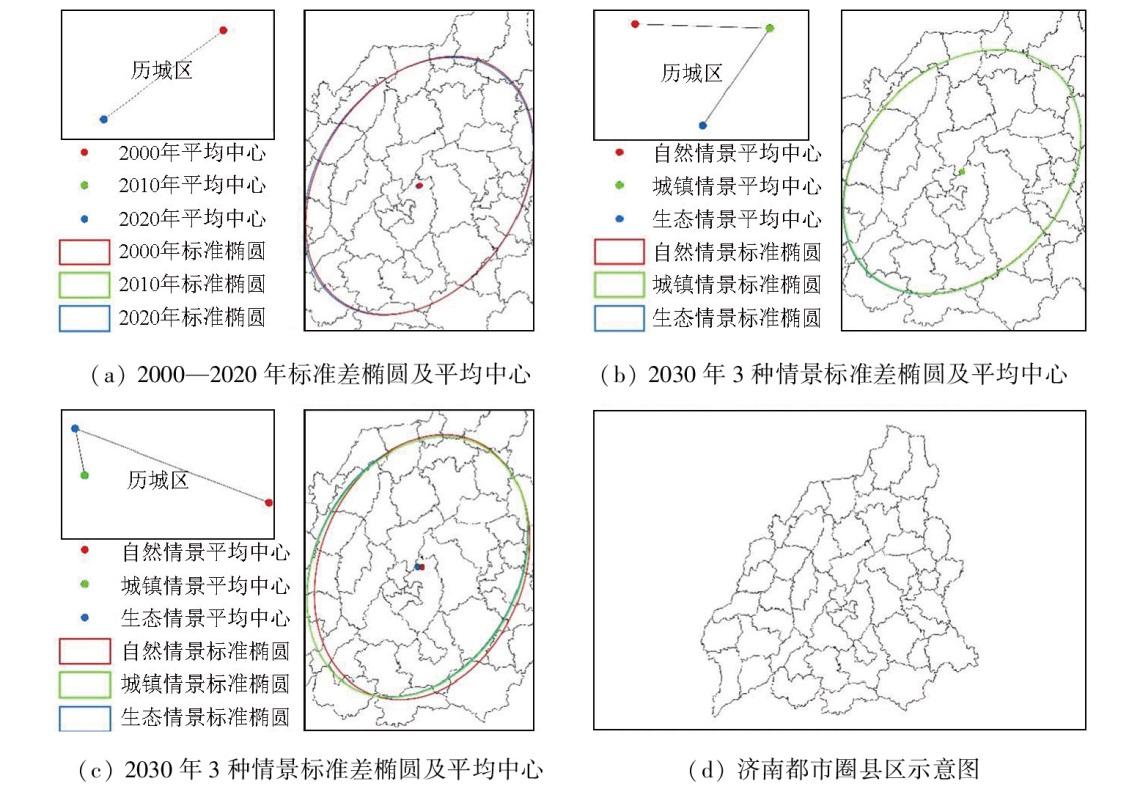
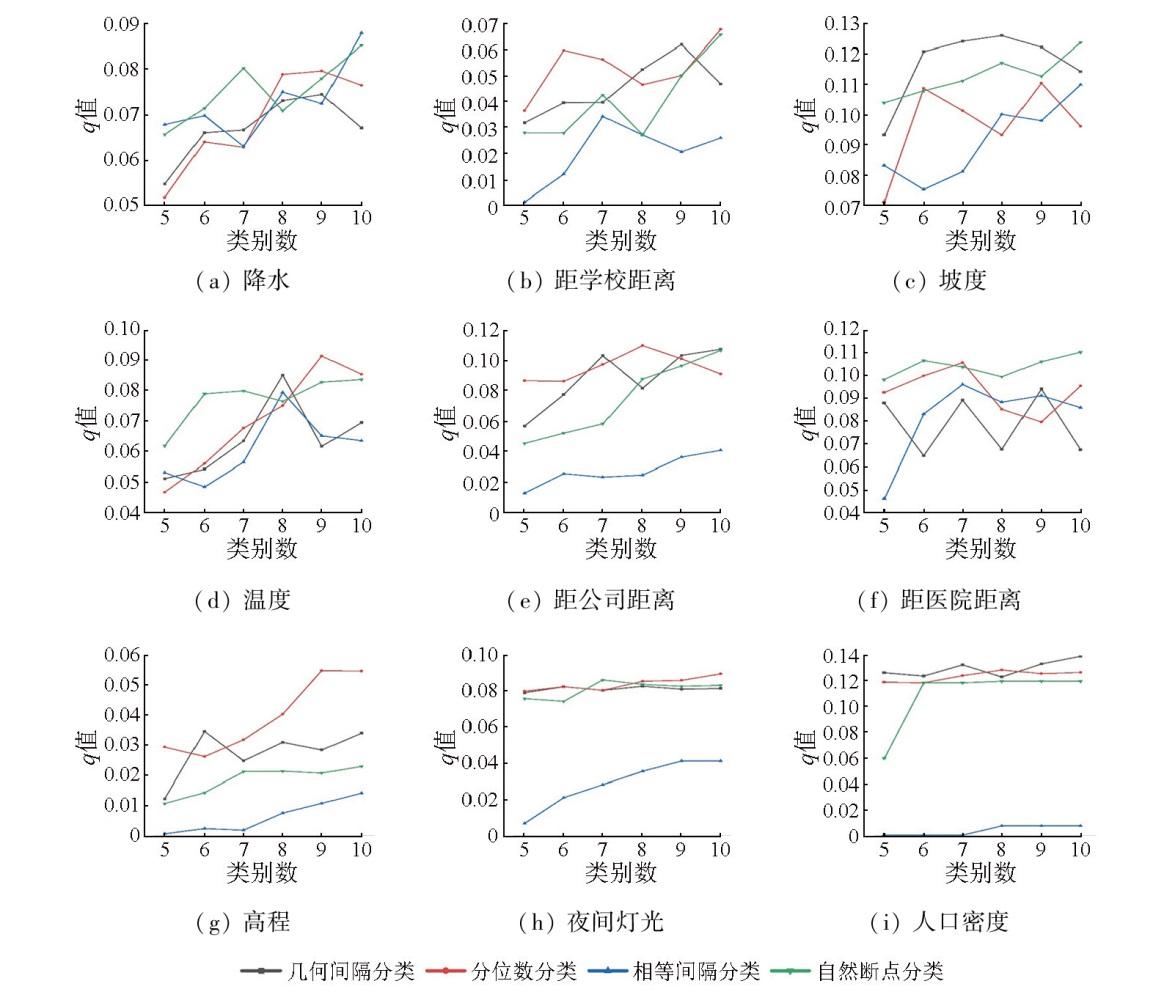
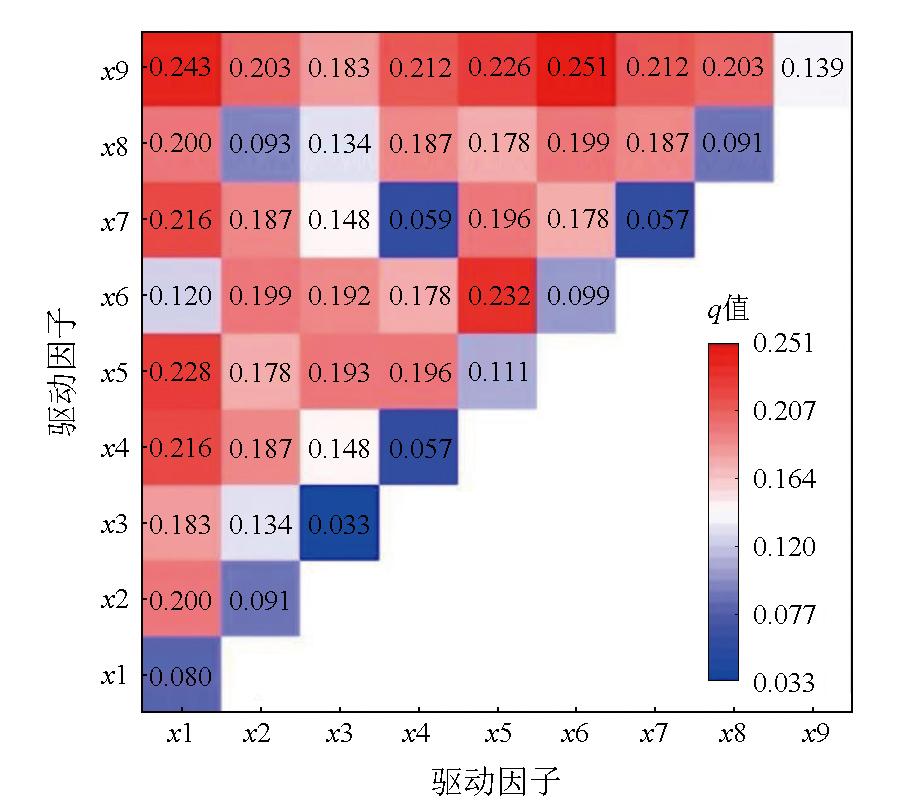
Exploring land use evolution and its impact on carbon storage is significant for mitigating climate change and promoting green and low-carbon development in metropolitan circles. Under the carbon peak and neutrality goals, this study implemented dual-constraint transition matrix optimization using point-of-interest (POI) data and the patch-generating land use simulation (PLUS) model, followed by the coupling with the integrated valuation of ecosystem services and trade-offs (InVEST) model. Based on the InVEST-PLUS coupled model, this study analyzed the land use evolution in the Jinan metropolitan circle from 2000 to 2020 and its impact on ecosystem carbon storage. Considering natural development, urban development, and ecological conservation as three distinct scenarios, this study simulated and predicted the land use change in the Jinan metropolitan circle in 2030 and 2060. Moreover, this study estimated the corresponding ecosystem carbon storage and analyzed the shift of the carbon storage center. Finally, this study explored the factors driving the spatial differentiation of carbon storage using the optimal parameters-based geographical detector (OPGD). The results indicate that from 2000 to 2020, the Jinan metropolitan circle saw a continued decrease in arable land, grassland, and unused land; a fluctuating increase in forest land; and a rapid increase in water area and construction land. The carbon storage and land use pattern in the Jinan metropolitan circle showed similar distributions characterized by higher values in the southeast and lower values in the northwest, with the main body of the Yellow River as the dividing line. The carbon storage in arable land served as the primary source of carbon storage in the Jinan metropolitan circle since it represented over 80 % of the total carbon storage. The simulation results reveal decreased carbon storage under the three scenarios, primarily due to the conversion from arable land in high carbon-density areas to construction land in low carbon-density areas. The ecological conservation scenario shows the highest total estimated carbon storage, which is 4 226.86×10⁶ t in 2030 and 3 967.94×10⁶ t in 2060. The carbon storage center in the Jinan metropolitan circle displays a certain shift in different development periods and scenarios due to land use change. However, the carbon storage center remains located in Licheng District, suggesting that the development of the Jinan metropolitan circle is relatively comprehensive and balanced. Various driving factors manifest significant impacts on the spatial distribution of carbon storage in the Jinan metropolitan circle. Notably, population density shows the greatest explanatory power for the spatial differentiation of carbon storage. Additionally, the interactions of various factors enhance their explanatory power for carbon storage.
XING Xiaotian , WANG Qi , ZHAO Jiajun , LIU Pudong , ZHANG Jingyuan . Investigating land use and carbon storage changes in Jinan metropolitan circle based on the InVEST-PLUS coupled model[J]. Remote Sensing for Natural Resources, 2025 , 37(4) : 118 -130 . DOI: 10.6046/zrzyyg.2024117
表1 数据来源及说明Tab.1 Data source and description |
| 类型 | 数据 | 分辨率 | 数据来源 |
|---|---|---|---|
| 土地利 用数据 | 土地利用 | 30 m | 中国科学院资源环境科学与数据中心(https://www.resdc.cn/) |
| 自然环 境数据 | 土壤类型 气温 降水 | 1 km | 国家地球系统科学数据中心(https://www.geodata.cn/) |
| 高程 坡度 | 30 m | 地理空间数据云(http://www.gscloud.cn/home) | |
| 社会经 济数据 | 距政府机构距离 距学校距离 距车站距离 距医院距离 距公园距离 | 地理遥感生态网(http://www.gisrs.cn/) | |
| 距铁路距离 距高速距离 距国道省道距离 | OpenStreetMap(https://www.openstreetmap.org/) | ||
| 人口密度 GDP | 1 km | 中国科学院资源环境科学与数据中心(https://www.resdc.cn/) | |
| 夜间灯光数据 | 500 m | ||
| 其他 数据 | 行政区划 | 国家基础地理信息中心(http://www.ngcc.cn/) |
表2 济南都市圈土地类型碳密度值Tab.2 Carbon density values of land types in Jinan metropolitan circle |
| 地类 | Cabove | Cbelow | Csoil | Cdead |
|---|---|---|---|---|
| 耕地 | 5.82 | 1.16 | 93.18 | 0.58 |
| 林地 | 20.15 | 4.03 | 127.69 | 2.02 |
| 草地 | 2.18 | 0.44 | 100.00 | 0.22 |
| 水域 | 0.62 | 0.12 | 81.35 | 0.06 |
| 建设用地 | 0.10 | 0.02 | 74.83 | 0.01 |
| 未利用地 | 0.10 | 0.02 | 11.74 | 0.01 |
表3 多情景土地转移矩阵Tab.3 Multi-scenario land transfer matrix |
| 地类 | 自然发展情景 | 城镇发展情景 | 生态保护情景 | |||||||||||||||
|---|---|---|---|---|---|---|---|---|---|---|---|---|---|---|---|---|---|---|
| 耕地 | 林地 | 草地 | 水域 | 建设 用地 | 未利 用地 | 耕地 | 林地 | 草地 | 水域 | 建设 用地 | 未利 用地 | 耕地 | 林地 | 草地 | 水域 | 建设 用地 | 未利 用地 | |
| 耕地 | 1 | 1 | 1 | 1 | 1 | 0 | 1 | 1 | 1 | 1 | 1 | 0 | 1 | 1 | 1 | 1 | 1 | 0 |
| 林地 | 1 | 1 | 1 | 0 | 1 | 0 | 1 | 1 | 1 | 0 | 1 | 0 | 0 | 1 | 0 | 0 | 0 | 0 |
| 草地 | 1 | 1 | 1 | 1 | 1 | 1 | 1 | 1 | 1 | 1 | 1 | 1 | 0 | 1 | 1 | 0 | 0 | 0 |
| 水域 | 1 | 1 | 1 | 1 | 1 | 1 | 1 | 1 | 1 | 1 | 1 | 1 | 0 | 1 | 1 | 1 | 0 | 0 |
| 建设用地 | 1 | 0 | 0 | 1 | 1 | 1 | 0 | 0 | 0 | 0 | 1 | 0 | 1 | 1 | 1 | 1 | 1 | 1 |
| 未利用地 | 1 | 0 | 1 | 1 | 1 | 1 | 1 | 0 | 1 | 1 | 1 | 1 | 1 | 1 | 1 | 1 | 1 | 1 |
表4 济南都市圈2000—2020年各地类面积及比例Tab.4 Area and proportion of various areas in Jinan metropolitan circle from 2000 to 2020 |
| 地类 | 2000年 | 2010年 | 2020年 | 面积变化 值/km2 | 面积变化 比例/% | |||
|---|---|---|---|---|---|---|---|---|
| 面积/km2 | 比例/% | 面积/km2 | 比例/% | 面积/km2 | 比例/% | |||
| 耕地 | 39 360.75 | 74.57 | 37 599.50 | 71.24 | 35 890.50 | 68.00 | -3 470.25 | 39.54 |
| 林地 | 2 444.50 | 4.63 | 2 420.25 | 4.59 | 2 700.00 | 5.12 | 255.50 | 2.91 |
| 草地 | 1 563.25 | 2.96 | 1 425.75 | 2.70 | 1 061.25 | 2.01 | -502.00 | 5.72 |
| 水域 | 687.25 | 1.30 | 1 152.00 | 2.18 | 1 337.25 | 2.53 | 650.00 | 7.41 |
| 建设用地 | 8 257.25 | 15.64 | 9 897.50 | 18.75 | 11 740.75 | 22.24 | 3 483.50 | 39.69 |
| 未利用地 | 468.50 | 0.89 | 286.50 | 0.54 | 51.75 | 0.10 | -416.75 | 4.75 |
表5 济南都市圈2000—2020年地物类型碳储量Tab.5 Carbon reserves of urban enclosure types in Jinan metropolitan circle from 2000 to 2020(106 t) |
| 地类 | 2000年 | 2010年 | 2020年 |
|---|---|---|---|
| 耕地 | 3 965.20 | 3 787.77 | 3 615.61 |
| 林地 | 376.18 | 372.45 | 415.50 |
| 草地 | 160.76 | 146.62 | 109.14 |
| 水域 | 56.46 | 94.64 | 109.86 |
| 建设用地 | 98.01 | 117.48 | 139.36 |
| 未利用地 | 35.12 | 21.48 | 3.88 |
| 合计 | 4 691.73 | 4 540.44 | 4 393.35 |
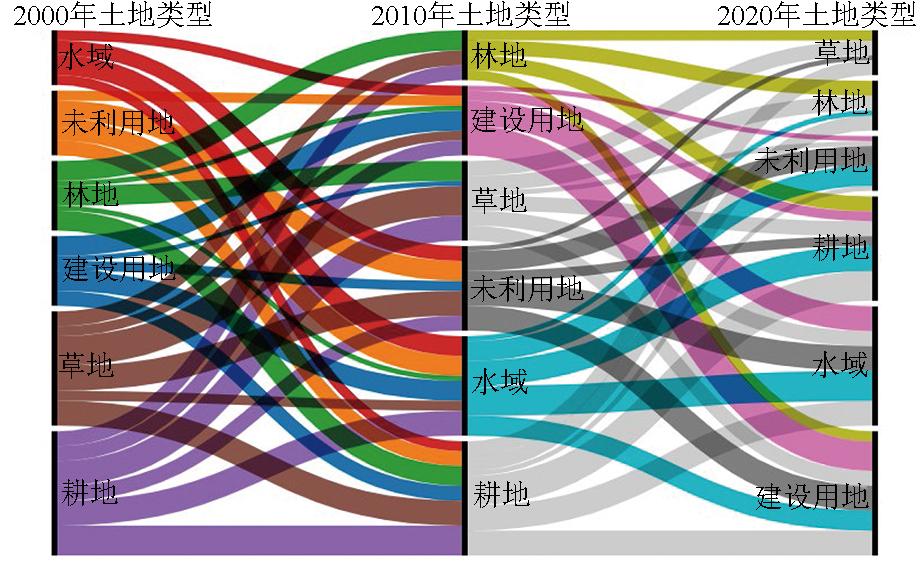
表6 济南都市圈2000—2020年碳储量变化情况Tab.6 Changes of carbon reserves caused by land use type transformation in Jinan metropolitan circle from 2000 to 2020 |
| 土地利用类型转换 | 面积/km2 | 碳储量变 化/106 t | 合计/106 t | ||
|---|---|---|---|---|---|
| 转出 | 转入 | 转出面积 | 转入面积 | ||
| 耕地 | 林地 | 266.50 | 14.16 | -293.06 | |
| 草地 | 247.50 | 0.52 | |||
| 水域 | 309.50 | -5.75 | |||
| 建设用地 | 3 397.00 | -301.89 | |||
| 未利用地 | 4.00 | -0.10 | |||
| 林地 | 耕地 | 280.00 | 235.50 | -12.52 | -17.00 |
| 草地 | 20.00 | -1.02 | |||
| 水域 | 0.25 | -0.02 | |||
| 建设用地 | 24.25 | -3.44 | |||
| 草地 | 耕地 | 769.50 | 426.00 | -0.89 | 6.34 |
| 林地 | 269.00 | 13.73 | |||
| 水域 | 2.25 | -0.05 | |||
| 建设用地 | 70.25 | -6.39 | |||
| 未利用地 | 2.00 | -0.06 | |||
| 水域 | 耕地 | 94.00 | 49.25 | 0.92 | -1.92 |
| 建设用地 | 40.00 | -2.81 | |||
| 未利用地 | 4.75 | -0.03 | |||
| 建设 用地 | 耕地 | 180.25 | 30.00 | 2.67 | 13.22 |
| 水域 | 149.00 | 10.47 | |||
| 未利用地 | 1.25 | 0.08 | |||
| 未利 用地 | 耕地 | 428.75 | 13.50 | 0.35 | -5.96 |
| 水域 | 283.00 | 2.03 | |||
| 建设用地 | 132.25 | -8.34 | |||
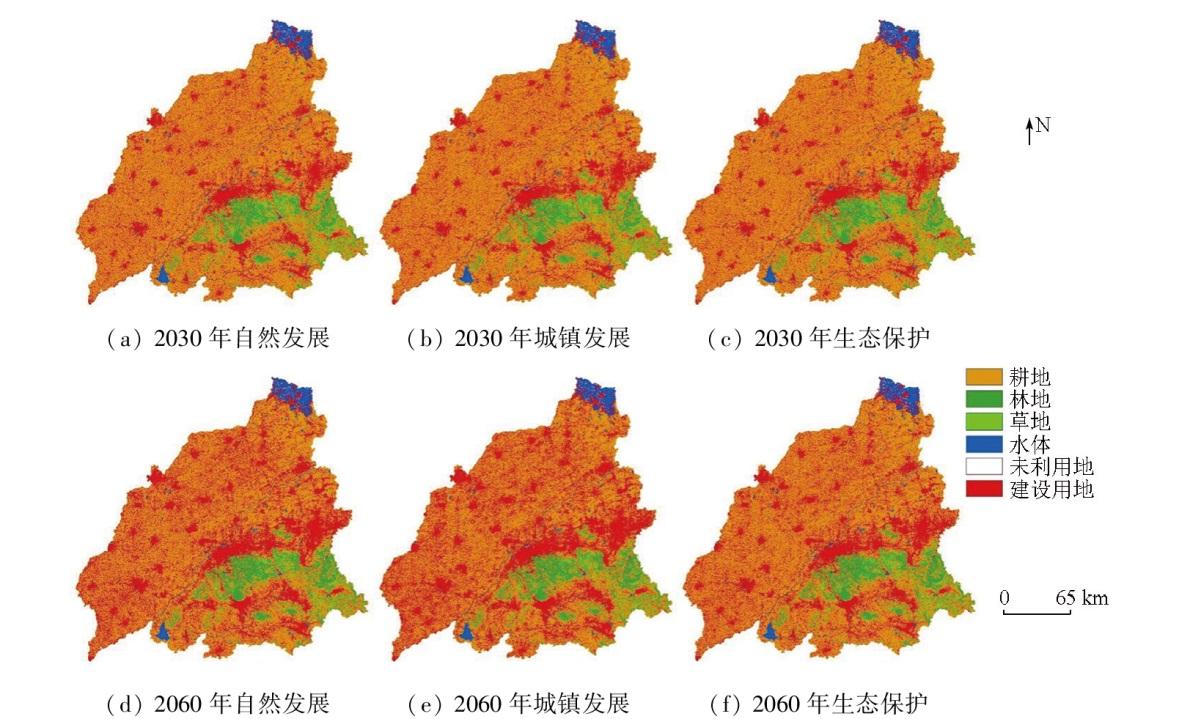
图5 2030年和2060年济南都市圈土地利用各地类空间分布及面积Fig.5 Spatial distribution and area of land use in Jinan metropolitan circle in 2030 and 2060 |
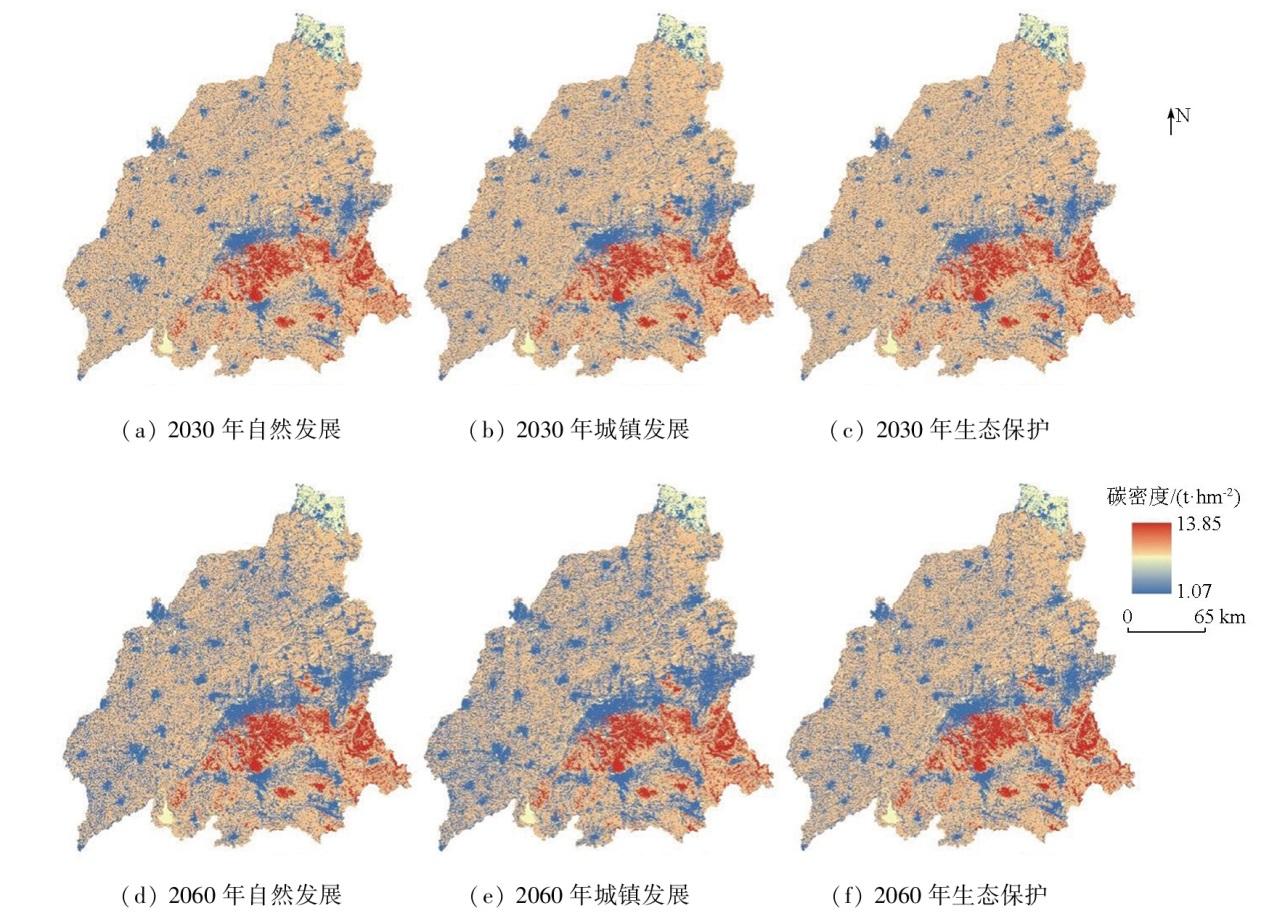
图7 2030年和2060年济南都市圈多情景碳密度分布Fig.7 Multi-scenario carbon density distribution in Jinan metropolitan area in 2030 and 2060 |
| [1] |
孙汇颖, 宫巧巧, 刘庆果, 等. 基于土地利用变化的山东省生境质量时空演变特征[J]. 土壤通报, 2022, 53(5):1019-1028.
|
| [2] |
龙文芹, 职露, 郭娅迪, 等. 西洞庭湖自然保护区2000—2020年间碳储量时空演变及成因分析[J]. 自然资源遥感, 2024, 36(4):185-192.doi:10.6046/zrzyyg.2023265.
|
| [3] |
|
| [4] |
|
| [5] |
杨潋威, 赵娟, 朱家田, 等. 基于PLUS和InVEST模型的西安市生态系统碳储量时空变化与预测[J]. 自然资源遥感, 2022(4):175-182.doi:10.6046/zrzyyg.2021348.
|
| [6] |
|
| [7] |
杨元合, 石岳, 孙文娟, 等. 中国及全球陆地生态系统碳源汇特征及其对碳中和的贡献[J]. 中国科学(生命科学), 2022, 52(4):534-574.
|
| [8] |
方精云, 于贵瑞, 任小波, 等. 中国陆地生态系统固碳效应——中国科学院战略性先导科技专项 “应对气候变化的碳收支认证及相关问题” 之生态系统固碳任务群研究进展[J]. 中国科学院院刊, 2015, 30(6):848-857.
|
| [9] |
贾天朝, 胡西武, 张娜娜. 三江源国家公园生态安全评价及障碍因子研究[J]. 河北环境工程学院学报, 2023, 33(1):48-54.
|
| [10] |
李佳珂, 邵战林. 基于PLUS和InVEST模型的乌鲁木齐市碳储量时空演变与预测[J]. 干旱区研究, 2024, 41(3):499-508.
|
| [11] |
王子昊, 王冰, 张宇飞, 等. 基于PLUS-InVEST模型的呼和浩特市多情景土地利用变化动态模拟及碳储量评估[J]. 农业资源与环境学报, 2024, 41(2):292-304.
|
| [12] |
|
| [13] |
|
| [14] |
李梓涵, 于慧, 巩飞, 等. 基于PLUS-InVEST模型的生态脆弱区生境质量时空演变分析[J]. 湖北农业科学, 2024, 63(2):254-260.
|
| [15] |
|
| [16] |
|
| [17] |
傅楷翔, 贾国栋, 余新晓, 等. 耦合PLUS-InVEST-Geodector模型的新疆地区碳储量时空变化及驱动机制分析[J]. 环境科学, 2024, 45(9):5416-5430.
|
| [18] |
许澳康, 胡梦珺, 石晶, 等. 石羊河流域生态系统碳储量时空变化及多情景模拟[J]. 中国环境科学, 2024, 44(6):3365-3375.
|
| [19] |
卢震. 未来蓝图“过审” 济南都市圈乘风而起[N]. 济南日报,2024-01-30(1).
|
| [20] |
李凯, 侯鹰, 付奇, 等. 都市圈 “三生空间” 协同变化及其对生态系统服务的影响[J]. 水土保持研究, 2023, 30(3):430-439.
|
| [21] |
冯一凡, 李翅, 冯君明. 基于GTWR模型的济南都市圈生态系统服务价值对城市扩张时空响应[J]. 北京林业大学学报, 2024, 46(1):104-118.
|
| [22] |
|
| [23] |
丁岳, 王柳柱, 桂峰, 等. 基于InVEST模型和PLUS模型的环杭州湾生态系统碳储量[J]. 环境科学, 2023, 44(6):3343-3352.
|
| [24] |
于芝琳, 赵明松, 高迎凤, 等. 基于InVEST-PLUS模型的淮北市碳储量时空演变及预测[J]. 环境科学, 2024, 45(6):3270-3283.
|
| [25] |
方精云, 黄耀, 朱江玲, 等. 森林生态系统碳收支及其影响机制[J]. 中国基础科学, 2015, 17(3):20-25,F0002.
|
| [26] |
边蕊, 赵安周, 刘宪锋, 等. 关中平原城市群土地利用变化对碳储量的影响[J]. 环境科学, 2024, 45(6):3260-3269.
|
| [27] |
秦慧颖. 山东省土地利用情景模拟与生态系统服务预测[D]. 济南: 山东大学, 2022.
|
| [28] |
|
| [29] |
林彤, 杨木壮, 吴大放, 等. 基于InVEST-PLUS模型的碳储量空间关联性及预测 ——以广东省为例[J]. 中国环境科学, 2022, 42(10):4827-4839.
|
| [30] |
梁甜, 黄茜, 杨霏, 等. 基于InVEST-PLUS模型的三峡库区(重庆段)生境质量演变及预测[J]. 长江流域资源与环境, 2023, 32(10):2184-2195.
|
| [31] |
|
| [32] |
毛永发, 周启刚, 王陶, 等. 耦合PLUS-InVEST-Geodector模型的三峡库区碳储量时空变化及其定量归因[J]. 长江流域资源与环境, 2023, 32(5):1042-1057.
|
| [33] |
邵壮, 陈然, 赵晶, 等. 基于FLUS与InVEST模型的北京市生态系统碳储量时空演变与预测[J]. 生态学报, 2022, 42(23):9456-9469.
|
| [34] |
国务院关于《山东省国土空间规划(2021—2035年)》的批复[J]. 中华人民共和国国务院公报, 2023(29):19-20.
Reply of the “Land and Spatial Planning of Shandong Province (2021-2035)”[J]. Gazette of the State Council of the People’s Republic of China, 2023(29):19-20.
|
| [35] |
济南市人民政府关于印发《济南市新型城镇化规划(2021—2035年)》的通知[J]. 济南市人民政府公报, 2022(15):2-34.
The New Urbanization Plan of Jinan City (2021-2035)[J]. Gazette of Jinan Municipality People’s Government, 2022(15):2-34.
|
| [36] |
雒舒琪, 胡晓萌, 孙媛, 等. 耦合PLUS-InVEST模型的多情景土地利用变化及其对碳储量影响[J]. 中国生态农业学报, 2023(2):300-314.
|
| [37] |
李俊, 杨德宏, 吴锋振, 等. 基于PLUS与InVEST模型的昆明市土地利用变化动态模拟与碳储量评估[J]. 水土保持通报, 2023, 43(1):378-387.
|
| [38] |
|
| [39] |
王劲峰, 徐成东. 地理探测器:原理与展望[J]. 地理学报, 2017, 72(1):116-134.
|
| [40] |
石晶, 石培基, 王梓洋, 等. 基于PLUS-InVEST模型的酒泉市生态系统碳储量时空演变与预测[J]. 环境科学, 2024, 45(1):300-313.
|
| [41] |
李琛, 吴映梅, 高彬嫔, 等. 高原湖泊乡村聚落空间分异及驱动力探测——以环洱海地区为例[J]. 经济地理, 2022, 42(4):220-229.
|
| [42] |
王锴, 朴世龙, 何悦, 等. 中国陆地生态系统碳汇稳定性的空间分布特征及驱动机制[J]. 中国科学(地球科学), 2023, 53(2):216-226.
|
/
| 〈 |
|
〉 |
