
Remote Sensing for Natural Resources >
Exploring the ecological effects of land use changes in mining areas under different mining modes based on the Google Earth Engine
Received date: 2024-01-20
Revised date: 2024-10-12
Online published: 2026-06-03
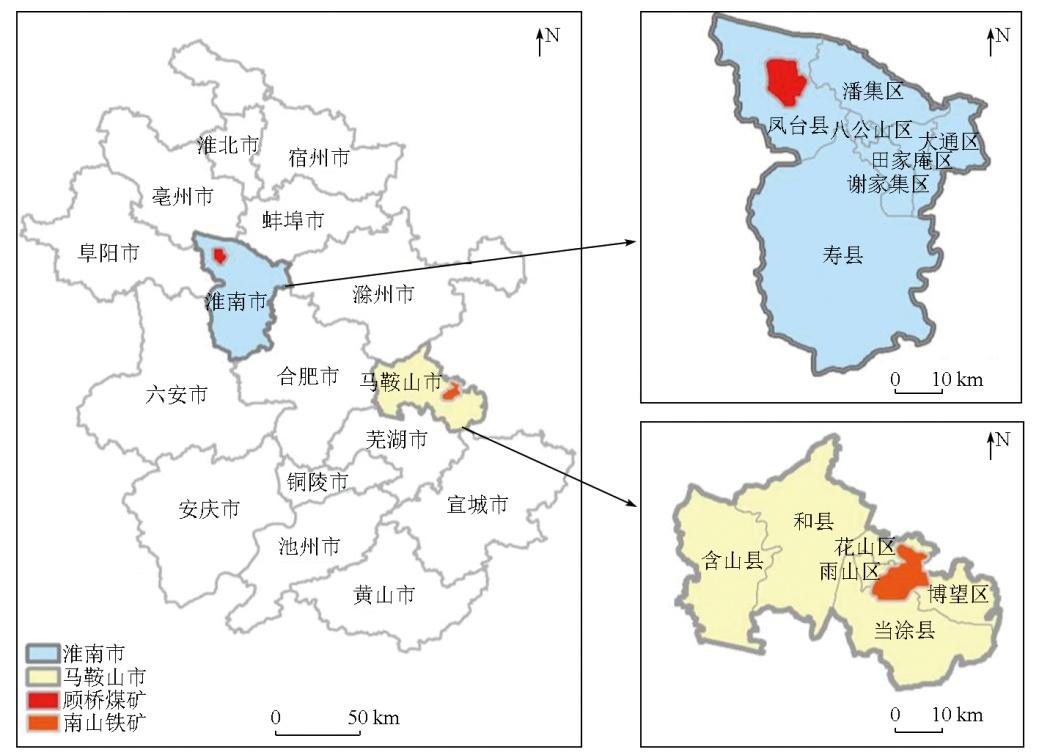
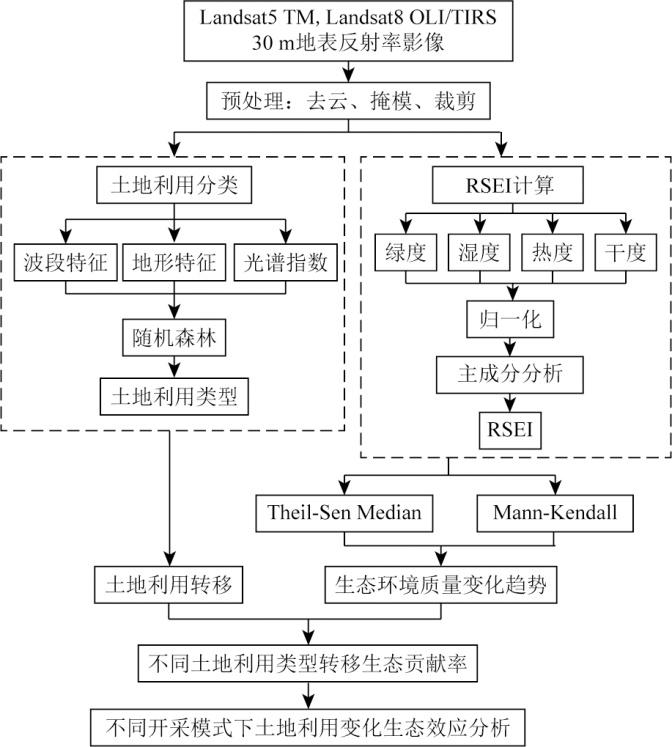
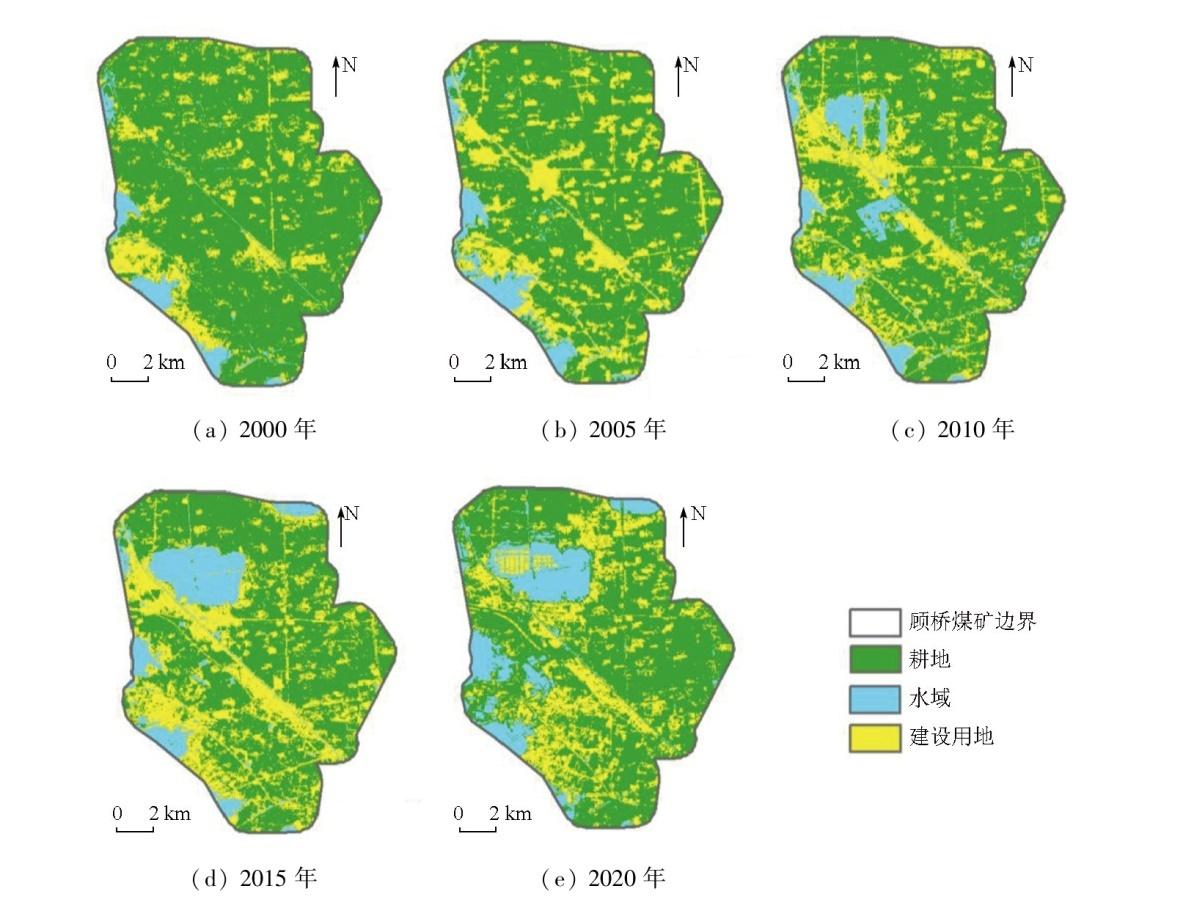
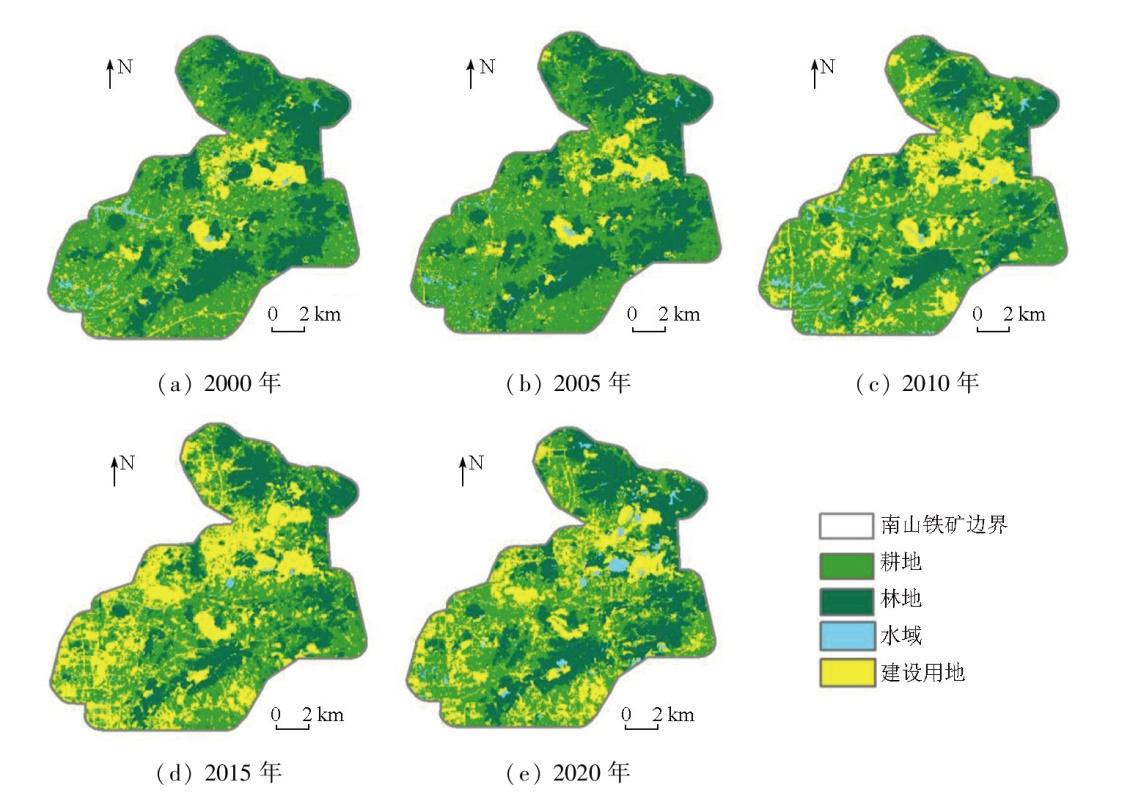
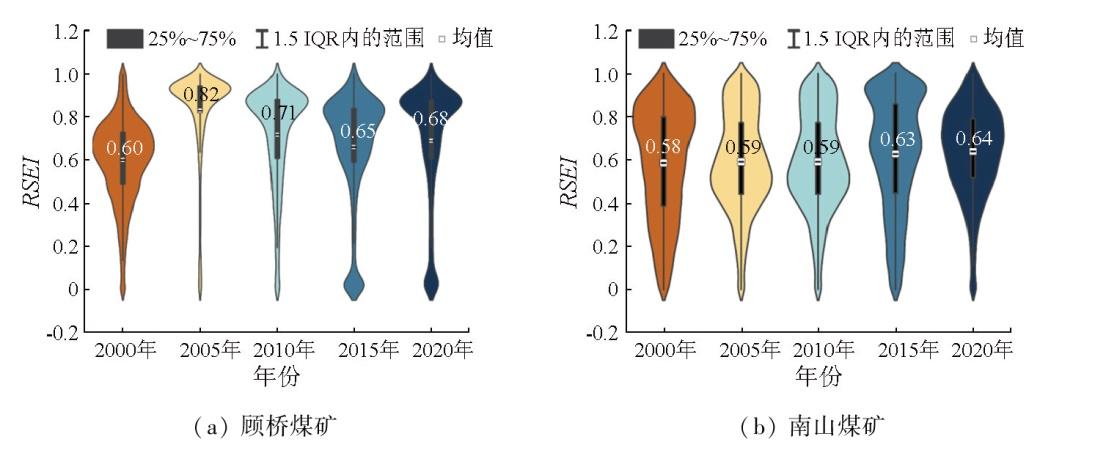
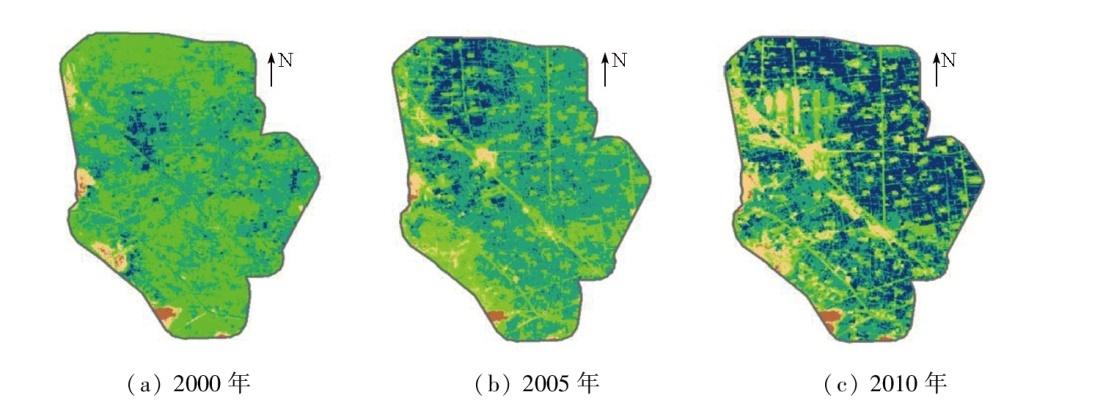
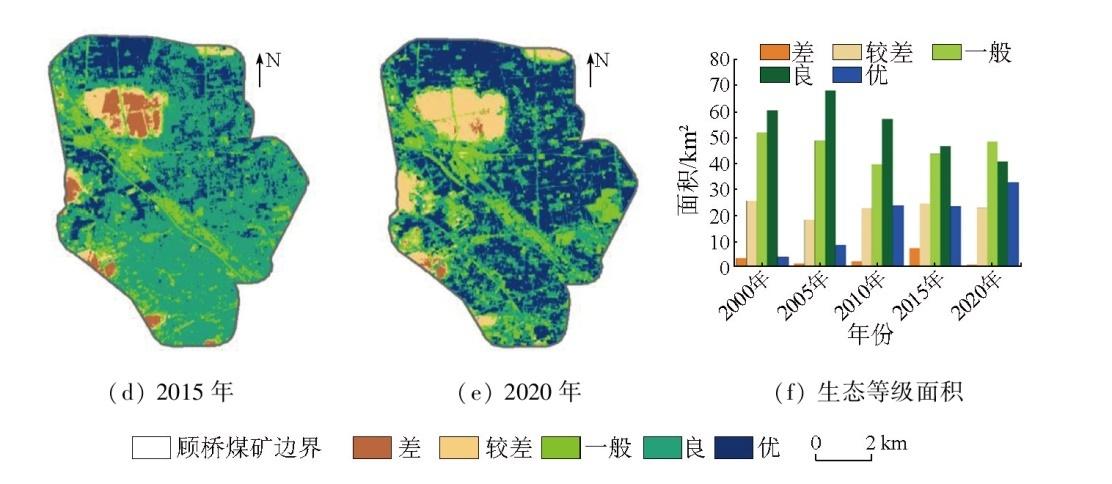
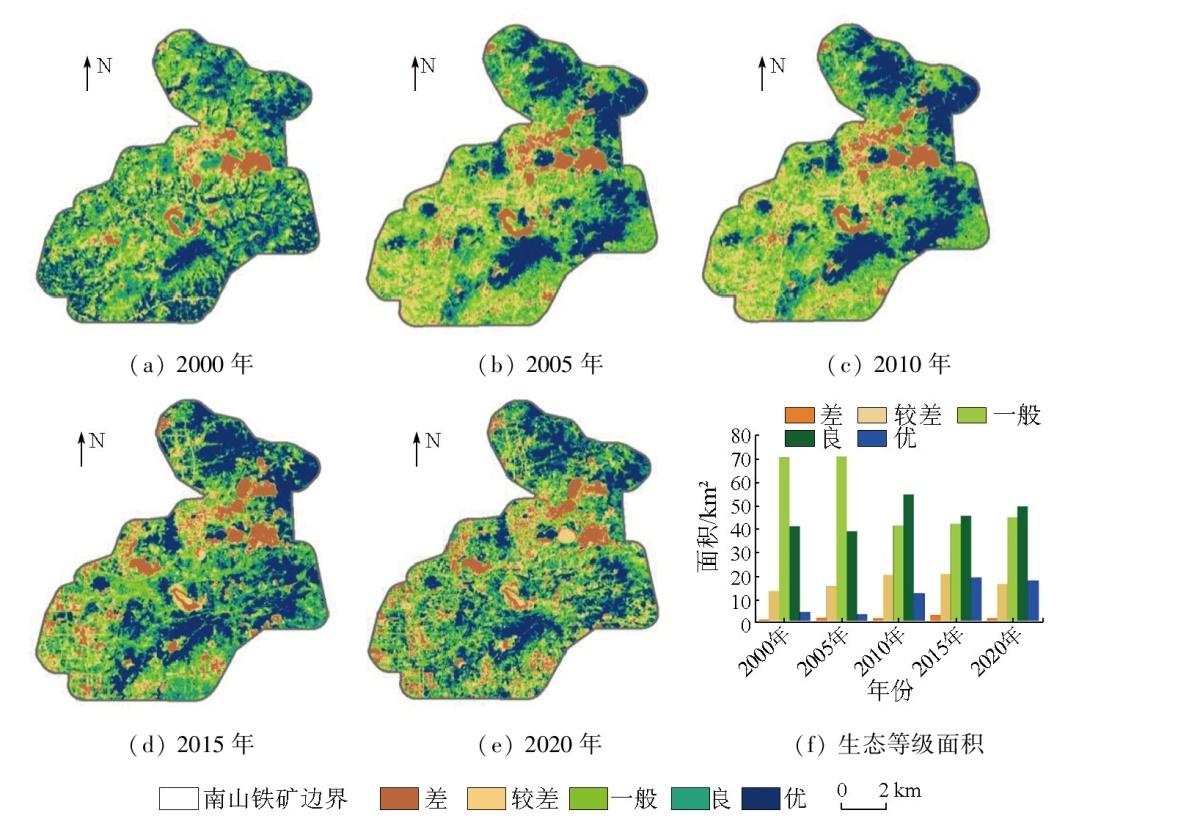
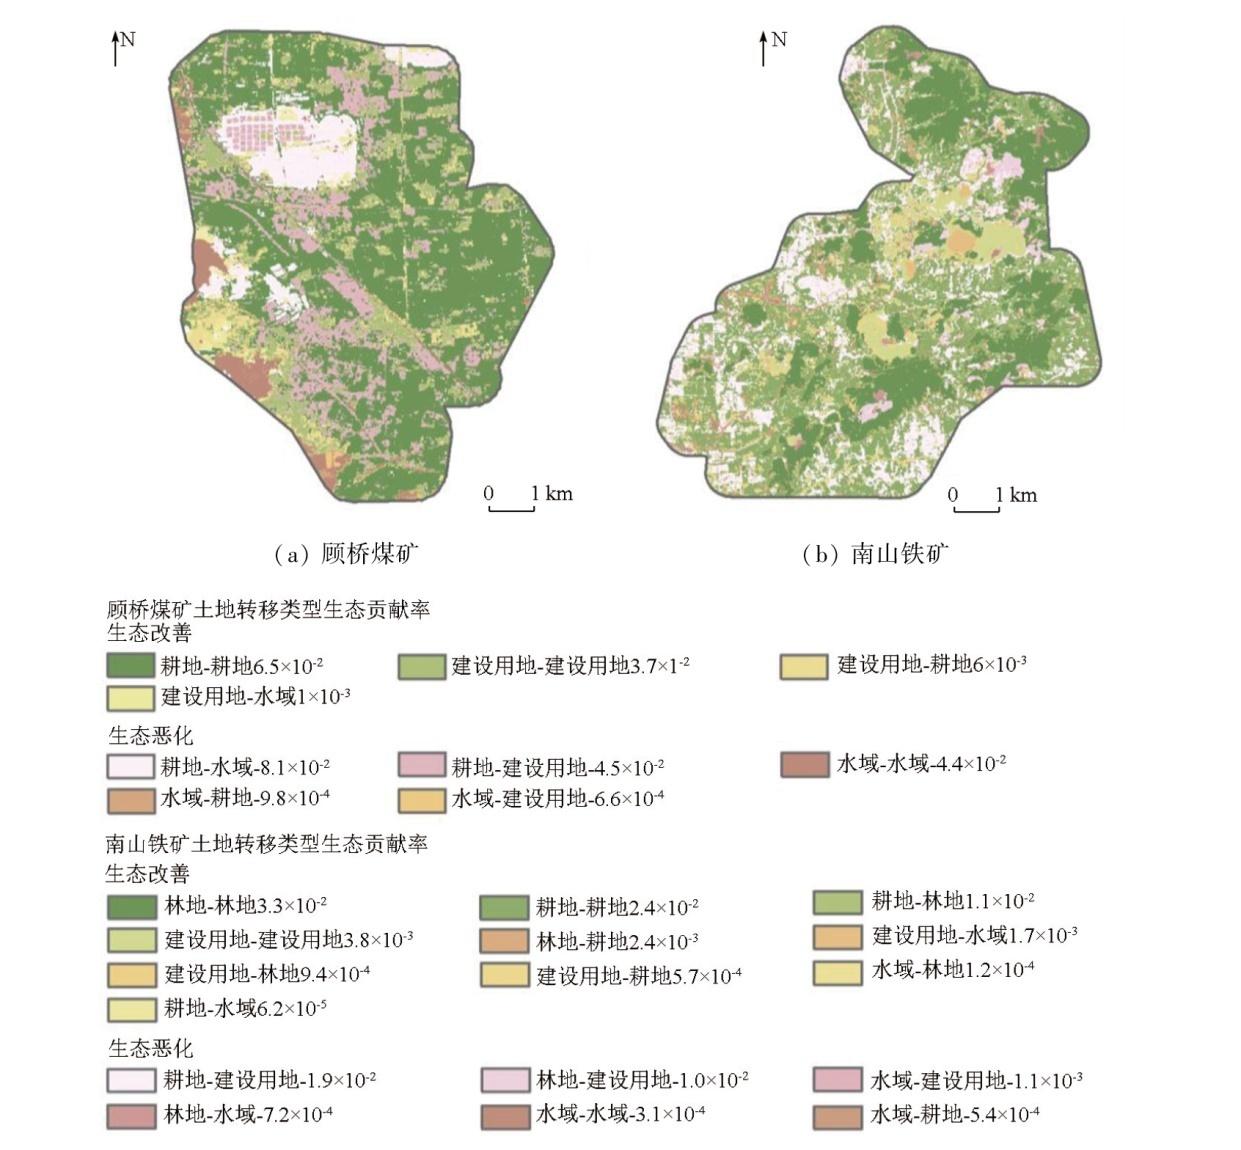
To investigate the ecological and environment effects of land-use changes under different mining modes, this study utilized the Google Earth Engine (GEE) cloud computing platform to construct a remote sensing ecological index (RSEI) by integrating the greenness, heat, dryness, and wetness indicators. The RSEI was utilized to assess the ecological quality of two mining areas with different mining modes: the Guqiao Coal Mine in Huainan City (underground mining) and the Nanshan Iron Mine in Ma’anshan City (open-pit mining). Through a comparative analysis of relevant data from 2000 to 2020, this study analyzed the dynamic evolutionary patterns between land use changes and ecological quality in the two mining areas. The results indicate that cultivated land occupied the largest proportion in both mining areas. The underground mining area was characterized by a significantly expanded water area, whereas the open-pit mining area featured reduced cultivated and forest lands and increased construction land. Both mining areas exhibited overall good-to-fair ecological quality. Specifically, the RSEI values for the Guqiao Coal Mine were 0.60, 0.82, 0.71, 0.65, and 0.68, while those for the Nanshan Iron Mine were 0.58, 0.59, 0.59, 0.63, and 0.64. Among various land use types, construction land and water bodies displayed relatively poor ecological conditions, whereas forest and cultivated lands exhibited more favorable conditions. The underground mining area showed surface subsidence and the transition of cultivated land to water areas, leading to deteriorating ecological quality. In contrast, the open-pit mining area showed soil stripping, shrinking forest and cultivated lands, and construction land expansion, contributing significantly to the declining ecological quality.
LIN Xinyuan , CHENG Yangjian , XIE Wei , LI Chuanqing , NIE Wen . Exploring the ecological effects of land use changes in mining areas under different mining modes based on the Google Earth Engine[J]. Remote Sensing for Natural Resources, 2025 , 37(3) : 54 -64 . DOI: 10.6046/zrzyyg.2024038
表3 顾桥煤矿和南山铁矿特征变量重要性Tab.3 The importance of characteristic variables in Guqiao Coal Mine and Nanshan Iron Mine |
| 特征变量 | 顾桥煤矿 | 南山铁矿 | ||||||||
|---|---|---|---|---|---|---|---|---|---|---|
| 2000年 | 2005年 | 2010年 | 2015年 | 2020年 | 2000年 | 2005年 | 2010年 | 2015年 | 2020年 | |
| Bblue | 4.62 | 4.81 | 6.73 | 5.93 | 5.82 | 6.22 | 6.20 | 2.64 | 5.47 | 4.67 |
| Bgreen | 7.44 | 7.21 | 4.74 | 5.21 | 5.12 | 6.40 | 6.72 | 5.32 | 6.43 | 4.12 |
| Bred | 5.47 | 6.65 | 3.82 | 5.49 | 9.88 | 6.00 | 6.36 | 2.49 | 4.14 | 4.48 |
| BNIR | 4.80 | 9.20 | 8.55 | 14.68 | 14.25 | 2.65 | 2.36 | 5.33 | 3.52 | 3.88 |
| BSWIR1 | 3.12 | 4.09 | 7.05 | 5.40 | 10.18 | 3.54 | 1.79 | 2.37 | 2.78 | 5.43 |
| BSWIR2 | 8.46 | 10.61 | 8.70 | 7.49 | 11.46 | 8.05 | 1.46 | 5.14 | 5.39 | 5.32 |
| NDVI | 3.68 | 6.35 | 6.73 | 1.70 | 6.11 | 3.28 | 1.58 | 5.29 | 1.08 | 3.39 |
| NDBI | 6.01 | 6.46 | 8.21 | 5.37 | 8.69 | 5.58 | 5.46 | 5.34 | 6.44 | 4.86 |
| MNDWI | 6.32 | 3.62 | 8.20 | 6.56 | 7.67 | 2.88 | 6.99 | 2.46 | 2.32 | 5.19 |
| Slope | 1.45 | 5.09 | 1.69 | 0.52 | 4.80 | 2.01 | 1.97 | 3.23 | 6.33 | 3.03 |
| Elevation | 4.22 | 4.49 | 4.22 | 2.92 | 1.51 | 3.38 | 3.16 | 5.38 | 4.05 | 3.08 |
表4 顾桥煤矿各土地利用类型面积Tab.4 Area of each land use type in Guqiao Coal Mine(km2) |
| 年份 | 耕地 | 水域 | 建设用地 |
|---|---|---|---|
| 2000年 | 114.54 | 7.82 | 25.24 |
| 2005年 | 100.22 | 11.22 | 36.16 |
| 2010年 | 95.50 | 15.65 | 36.46 |
| 2015年 | 83.69 | 18.89 | 45.02 |
| 2020年 | 89.15 | 21.70 | 36.75 |
表5 南山铁矿各土地利用类型面积Tab.5 Area of each land use type in Nanshan Iron Mine(km2) |
| 年份 | 耕地 | 林地 | 水域 | 建设用地 |
|---|---|---|---|---|
| 2000年 | 100.98 | 66.59 | 6.36 | 24.85 |
| 2005年 | 98.40 | 74.14 | 3.38 | 22.86 |
| 2010年 | 104.56 | 40.75 | 8.95 | 44.53 |
| 2015年 | 80.90 | 48.30 | 2.78 | 66.79 |
| 2020年 | 78.32 | 62.02 | 5.96 | 52.48 |
表6 顾桥煤矿和南山铁矿4个指标PC1载荷Tab.6 PC1 loadings for the four indicators in Guqiao Coal Mine and Nanshan Iron Mine |
| 指标 | 顾桥煤矿 | 南山铁矿 | ||||||||
|---|---|---|---|---|---|---|---|---|---|---|
| 2000年 | 2005年 | 2010年 | 2015年 | 2020年 | 2000年 | 2005年 | 2010年 | 2015年 | 2020年 | |
| NDVI | 0.585 | 0.654 | 0.790 | 0.647 | 0.672 | 0.501 | 0.733 | 0.783 | 0.704 | 0.712 |
| WET | 0.310 | 0.298 | 0.191 | 0.252 | 0.251 | 0.341 | -0.447 | 0.058 | 0.148 | 0.206 |
| LST | -0.123 | -0.227 | 0.034 | -0.060 | -0.203 | -0.406 | 0.058 | -0.416 | -0.087 | -0.252 |
| NDBSI | -0.739 | -0.657 | -0.581 | -0.718 | -0.667 | -0.684 | 0.508 | -0.459 | -0.689 | -0.622 |
| 特征值 | 0.049 | 0.037 | 0.056 | 0.029 | 0.031 | 0.048 | 0.007 | 0.042 | 0.026 | 0.048 |
| 贡献率/% | 70.95 | 77.89 | 74.18 | 71.22 | 76.94 | 75.98 | 79.60 | 82.70 | 77.81 | 85.07 |
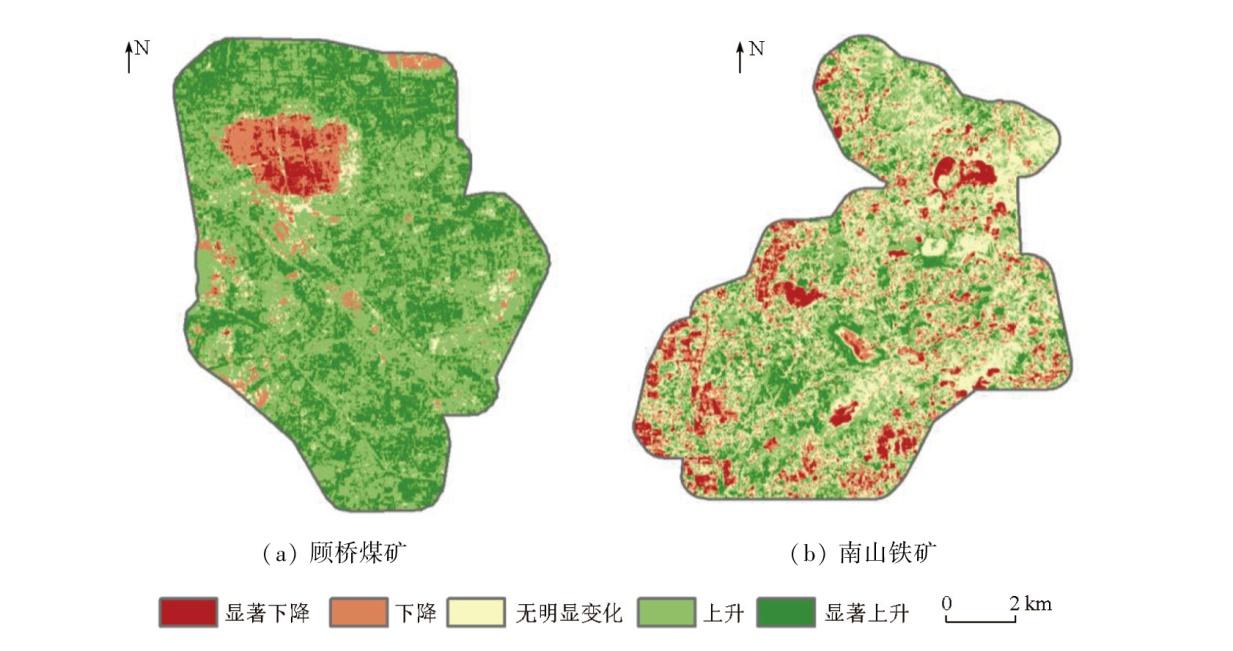
表7 2000—2020年顾桥煤矿和南山铁矿RSEI趋势变化面积占比Tab.7 Area proportion of different RSEI trend in Guqiao Coal Mine and Nanshan Iron Mine from 2000 to 2020 |
| 趋势等级 | 顾桥煤矿 | 南山铁矿 | ||
|---|---|---|---|---|
| 面积/km2 | 占比/% | 面积/km2 | 占比/% | |
| 显著下降 | 5.46 | 3.7 | 22.67 | 10.9 |
| 下降 | 6.94 | 4.7 | 36.18 | 18.2 |
| 无明显变化 | 2.95 | 2.0 | 43.73 | 22.0 |
| 上升 | 120.59 | 81.7 | 76.33 | 38.4 |
| 显著上升 | 11.66 | 7.9 | 19.87 | 10.5 |
| [1] |
刘英, 许萍萍, 毕银丽, 等. 新疆戈壁煤矿露天开采对生态环境扰动定量分析[J]. 煤炭学报, 2023, 48(2):959-974.
|
| [2] |
王晓辉, 耿宜佳. 淮南煤矿区土地利用变化分析[J]. 安徽农业科学, 2015, 43(36):295-298.
|
| [3] |
张敏. 大型露天煤矿区土地利用时空演变特征及生态影响研究[D]. 北京: 中国地质大学(北京), 2021.
|
| [4] |
朱冬雨, 陈涛, 牛瑞卿, 等. 利用移动窗口遥感生态指数分析矿区生态环境[J]. 武汉大学学报(信息科学版), 2021, 46(3):341-347.
|
| [5] |
王双明, 杜华栋, 王生全. 神木北部采煤塌陷区土壤与植被损害过程及机理分析[J]. 煤炭学报, 2017, 42(1):17-26.
|
| [6] |
范立民, 向茂西, 彭捷, 等. 西部生态脆弱矿区地下水对高强度采煤的响应[J]. 煤炭学报, 2016, 41(11):2672-2678.
|
| [7] |
汪云甲. 矿区生态扰动监测研究进展与展望[J]. 测绘学报, 2017, 46(10):1705-1716.
|
| [8] |
徐涵秋. 城市遥感生态指数的创建及其应用[J]. 生态学报, 2013, 33(24):7853-7862.
|
| [9] |
|
| [10] |
|
| [11] |
|
| [12] |
|
| [13] |
国家质量监督检验检疫总局, 中国国家标准化管理委员会. GB/T 21010—2017 土地利用现状分类[S]. 北京: 中国标准出版社, 2017.
General Administration of Quality Supervision,Inspection and Quarantine of the People’s Republic of China, Standardization Administration of the People’s Republic of China. GB/T 21010—2017 Current land use classification[S]. Beijing: Standards Press of China, 2017.
|
| [14] |
姚金玺, 王浪, 李建忠, 等. 青海诺木洪地区多源遥感及多特征组合地物分类[J]. 农业工程学报, 2022, 38(3):247-256.
|
| [15] |
|
| [16] |
|
| [17] |
|
| [18] |
|
| [19] |
|
| [20] |
|
| [21] |
|
| [22] |
杨保华, 杨清华, 陈剑虹. 关于《生态环境状况评价技术规范(试行)》中土地退化指数的权重及计算方法的探讨[J]. 生态与农村环境学报, 2011, 27(3):103-107.
|
| [23] |
黄望望, 姜春露, 陈星, 等. 淮南新集矿区主要充水含水层水化学特征及成因[J]. 地球与环境, 2020, 48(4):432-442.
|
| [24] |
何庆. 露天煤矿复垦区生态系统服务功能评价与权衡研究[D]. 杨凌: 西北农林科技大学, 2023.
|
| [25] |
李晓文, 方创琳, 黄金川, 等. 西北干旱区城市土地利用变化及其区域生态环境效应——以甘肃河西地区为例[J]. 第四纪研究, 2003, 23(3):280-290,348-349.
|
| [26] |
宗慧琳, 张晓伦, 袁希平, 等. 利用GEE进行1990—2022年小江流域生态环境质量时空格局与演变趋势分析[J]. 环境科学, 2024, 45(7):4122-4136.
|
| [27] |
雷少刚, 卞正富. 西部干旱区煤炭开采环境影响研究[J]. 生态学报, 2014, 34(11):2837-2843.
|
| [28] |
刘硕, 李小光, 宋建伟, 等. 长山沟露天矿集中区土地利用时空变化的遥感监测与分析[J]. 水土保持通报, 2021, 41(4):121-127,2.
|
/
| 〈 |
|
〉 |