
Remote Sensing for Natural Resources >
Data quality assessment of the AMS-3000 wide-field three-linear-array stereoscopic aerial survey system
Received date: 2023-12-14
Revised date: 2024-04-24
Online published: 2026-06-03
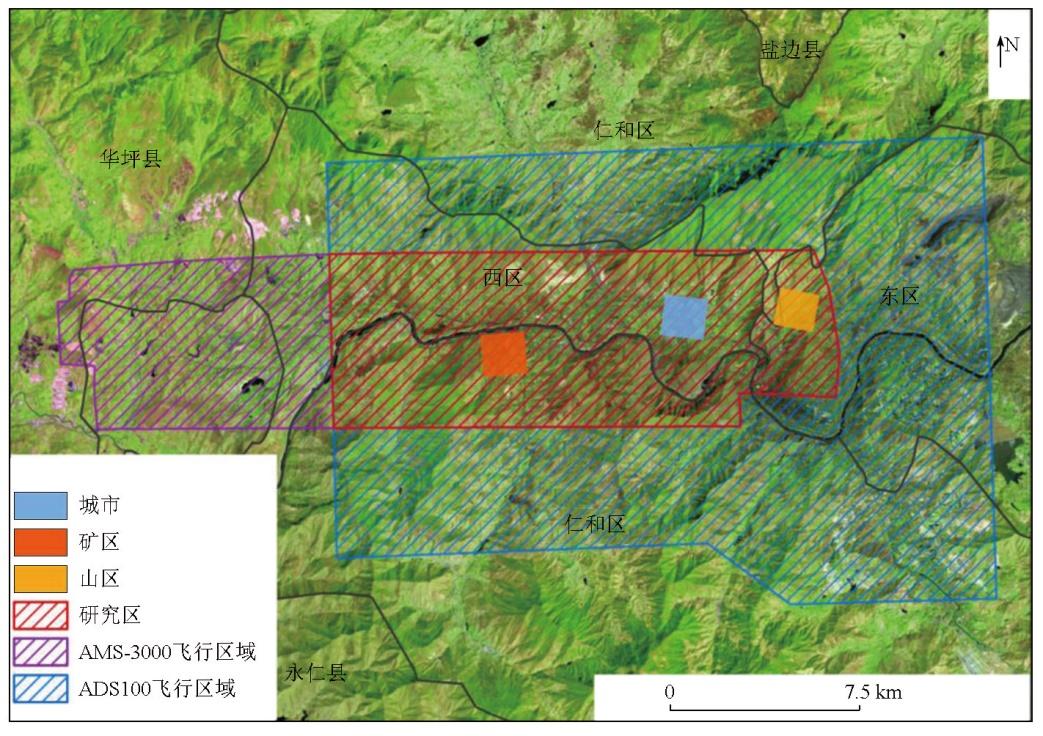
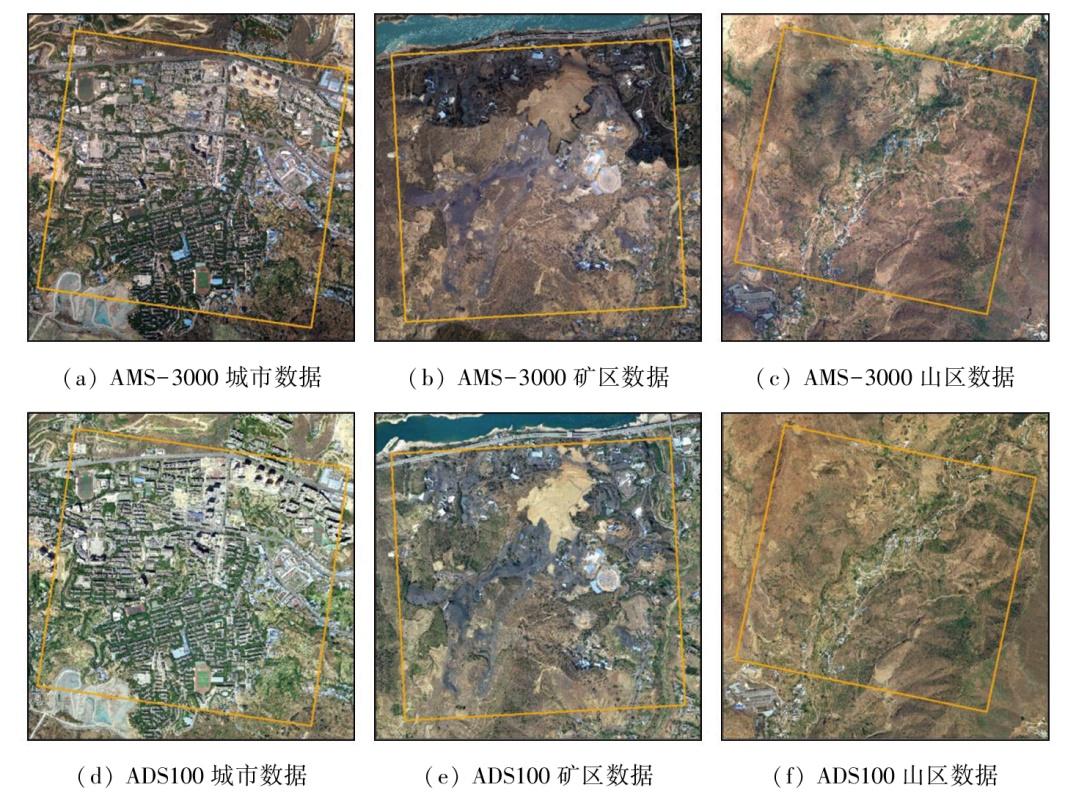
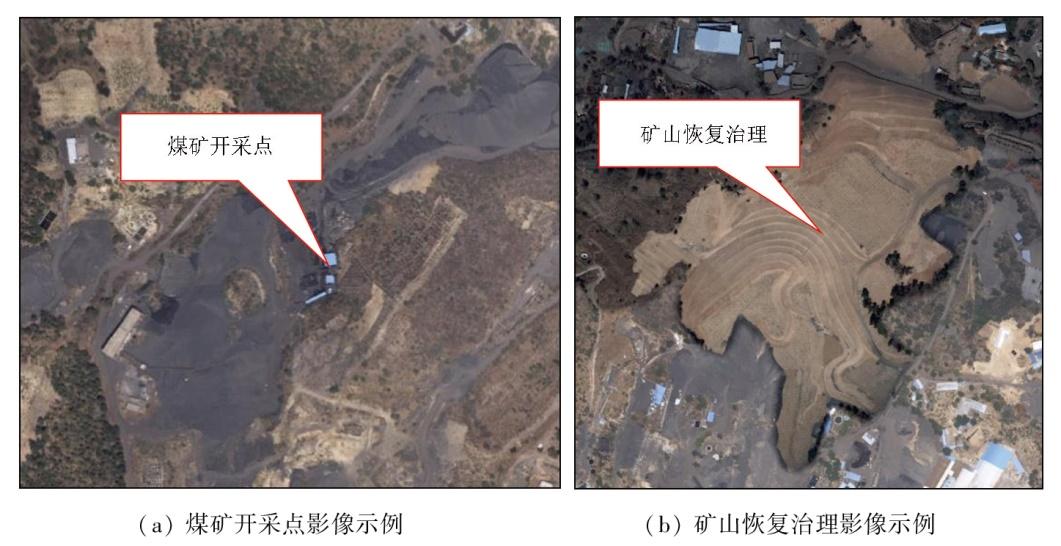
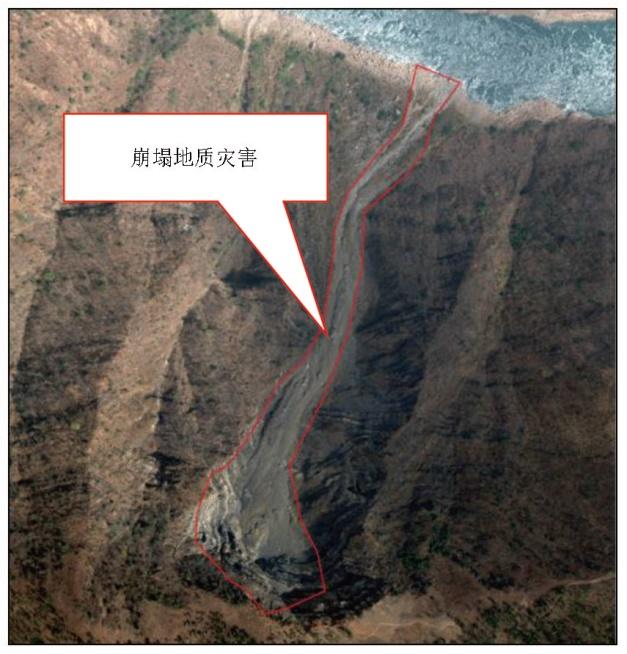
The AMS-3000 wide-field three-linear-array stereoscopic aerial survey system (hereafter referred to as the AMS-3000 system) is China’s first independently developed airborne linear-array aerial survey system. It can obtain panchromatic and R-, G-, and B-band multispectral images. However, the data quality of these images lacks quantitative assessments and analyses. Focusing on the area along the Jinsha River within western Panzhihua City, Sichuan Province, this study assessed the spectral quality of the data obtained from the AMS-3000 system in terms of grayscale, texture, and energy features, and noise level. Moreover, this study compared the AMS-3000 system with the internationally recognized ADS100 aerial photography system and assessed the geometric accuracy of the AMS-3000 system using the 1∶2 000-scale terrain data. Additionally, this study analyzed the effectiveness of the AMS-3000 system in the geological industry by applying it to the investigation of the mineral resource exploitation status and geologic hazards. Overall, this study serves as a reference for the application promotion and improvement of the AMS-3000 system.
LI Tianqi , ZHANG Xian , JIN Dingjian , GAO Zihong , HAN Yachao , XU Ning , GAO Han , LI Gongxin . Data quality assessment of the AMS-3000 wide-field three-linear-array stereoscopic aerial survey system[J]. Remote Sensing for Natural Resources, 2025 , 37(3) : 142 -151 . DOI: 10.6046/zrzyyg.2023382
表1 AMS-3000与ADS100主要指标参数Tab.1 Main indicator parameters of AMS-3000 and ADS100 |
| 指标 | AMS-3000 | ADS100(有效测绘区域) |
|---|---|---|
| 波段 | PAN,R,G,B | PAN,R,G,B,NIR |
| 焦距/mm | 130 | 62.5 |
| 基高比 | 0.89 | 0.78 |
| 交汇角/(°) | 21,27 | 14,27 |
| 立体成像角度/(°) (前视,后视,前、后视) | 21,27,48 | 26,19,45 |
| 像素/个 | 32 768 | 16 000 |
| 2 000 m航高像素 分辨率/m | 0.077 | 0.16 |
| 横向视场角/(°) | 64 | 60 |
| 2 000 m航高成图 比例尺 | 1∶1 000 | 1∶2 000 |
| 质量/kg | 72 | 50 |
表2 AMS-3000和ADS100数据灰度特征对比Tab.2 Comparison of grayscale information in AMS-3000 and ADS100 data |
| 灰度特征 | 波段 | 城市 | 矿区 | 山区 | |||
|---|---|---|---|---|---|---|---|
| AMS-3000 | ADS100 | AMS-3000 | ADS100 | AMS-3000 | ADS100 | ||
| [最小值, 最大值] | R | [3,253] | [0,255] | [1,255] | [1,255] | [9,253] | [0,255] |
| G | [9,253] | [1,255] | [8,255] | [1,255] | [13,253] | [1,255] | |
| B | [5,253] | [1,255] | [5,255] | [1,255] | [9,253] | [2,255] | |
| 均值 | R | 83.572 588 | 83.242 540 | 78.393 797 | 67.800 800 | 99.149 108 | 75.454 545 |
| G | 81.181 100 | 93.193 296 | 74.290 586 | 73.540 674 | 89.084 684 | 69.066 834 | |
| B | 63.295 291 | 89.235 888 | 58.081 662 | 76.013 724 | 68.293 584 | 60.238 720 | |
| 标准差 | R | 52.323 057 | 53.552 480 | 39.828 969 | 40.636 635 | 41.832 207 | 33.027 923 |
| G | 44.248 676 | 49.221 029 | 32.615 564 | 35.067 013 | 31.444 863 | 24.655 547 | |
| B | 40.835 132 | 47.381 074 | 28.465 731 | 31.483 471 | 24.778 054 | 18.606 961 | |
表3 AMS-3000和ADS100数据纹理特征对比Tab.3 Comparison of texture information in AMS-3000 and ADS100 data |
| 纹理特征 | 波段 | 城市 | 矿区 | 山区 | |||
|---|---|---|---|---|---|---|---|
| AMS-3000 | ADS100 | AMS-3000 | ADS100 | AMS-3000 | ADS100 | ||
| 同质性 | R | 0.494 340 | 0.462 353 | 0.569 834 | 0.524 927 | 0.402 981 | 0.456 152 |
| G | 0.519 803 | 0.463 152 | 0.614 883 | 0.562 582 | 0.462 169 | 0.527 081 | |
| B | 0.589 533 | 0.544 028 | 0.685 704 | 0.654 352 | 0.554 611 | 0.674 007 | |
| 对比度 | R | 12.800 055 | 13.759 801 | 5.134 182 | 5.540 763 | 10.659 980 | 6.292 375 |
| G | 10.022 243 | 11.853 681 | 3.739 602 | 3.996 770 | 6.581 586 | 3.885 167 | |
| B | 7.698 285 | 7.150 093 | 2.608 960 | 2.311 272 | 3.644 220 | 1.610 590 | |
| 角二阶矩 | R | 0.230 291 | 0.209 421 | 0.265 584 | 0.232 212 | 0.161 592 | 0.177 437 |
| G | 0.239 672 | 0.204 768 | 0.292 180 | 0.246 072 | 0.180 039 | 0.211 315 | |
| B | 0.291 734 | 0.248 043 | 0.354 139 | 0.313 351 | 0.222 764 | 0.318 608 | |
| 熵 | R | 1.708 204 | 1.776 137 | 1.582 664 | 1.691 923 | 1.942 928 | 1.870 011 |
| G | 1.670 413 | 1.786 373 | 1.488 344 | 1.626 877 | 1.859 003 | 1.730 920 | |
| B | 1.498 315 | 1.618 479 | 1.296 948 | 1.392 717 | 1.685 434 | 1.365 261 | |
表4 AMS-3000和ADS100数据能量特征对比Tab.4 Comparison of energy information in AMS-3000 and ADS100 data |
| 能量特征 | 波段 | 城市 | 矿区 | 山区 | |||
|---|---|---|---|---|---|---|---|
| AMS-3000 | ADS100 | AMS-3000 | ADS100 | AMS-3000 | ADS100 | ||
| 细节能量 | R | 7.538 428 | 7.877 600 | 2.820 369 | 3.096 583 | 5.798 322 | 3.503 917 |
| G | 5.951 535 | 6.834 283 | 2.013 087 | 2.278 667 | 3.519 743 | 2.048 597 | |
| B | 4.547 111 | 4.235 989 | 1.363 186 | 1.312 545 | 1.932 782 | 0.872 410 | |
| 边缘能量 | R | 1.676 443 | 0.819 110 | 0.746 305 | 0.584 681 | 1.956 013 | 1.358 207 |
| G | 1.509 385 | 0.924 938 | 0.730 304 | 0.547 750 | 1.509 776 | 0.808 992 | |
| B | 1.242 619 | 0.924 938 | 0.495 589 | 0.384 763 | 0.728 511 | 0.291 373 | |
表5 AMS-3000和ADS100数据噪声方差对比Tab.5 Comparison of noise level in AMS-3000 and ADS100 data |
| 区域 | 波段 | 硬质铺装地 | 植被 | 土壤 | |||
|---|---|---|---|---|---|---|---|
| AMS-3000 | ADS100 | AMS-3000 | ADS100 | AMS-3000 | ADS100 | ||
| 非阴影区 | R | 38.888 514 | 31.233 256 | 13.925 392 | 12.723 567 | 35.683 666 | 26.081 087 |
| G | 34.505 191 | 31.579 201 | 13.402 149 | 14.200 166 | 25.386 520 | 25.170 174 | |
| B | 27.489 724 | 24.708 639 | 12.019 379 | 8.166 513 | 17.625 233 | 21.232 276 | |
| 阴影区 | R | 7.067 904 | 10.868 610 | 10.274 748 | 5.3230 767 | 7.342 963 | 6.019 994 |
| G | 7.117 442 | 9.729 526 | 10.505 827 | 5.1982 205 | 6.661 557 | 6.044 159 | |
| B | 6.359 533 | 6.350 836 | 10.797 800 | 7.7845 438 | 6.296 068 | 5.399 476 | |
| [1] |
|
| [2] |
许强, 郭晨, 董秀军. 地质灾害航空遥感技术应用现状及展望[J]. 测绘学报, 2022, 51(10):2020-2033.
|
| [3] |
姚园, 许永森, 丁亚林, 等. 大视场三线阵航空测绘相机光学系统设计[J]光学精密工程, 2018, 26(9):2335-2344.
|
| [4] |
朱芳芳. 基于ADS100影像的城市建筑物信息提取[D]. 兰州: 兰州交通大学, 2020.
|
| [5] |
|
| [6] |
王涛, 张艳, 张永生, 等. 国产机载大视场三线阵CCD相机GNSS偏心矢量和IMU视轴偏心角标定技术[J]. 测绘学报, 2018, 47(11):1474-1486.
|
| [7] |
王涛, 张艳, 张永生, 等. 国产机载大视场三线阵CCD相机几何标定[J]. 遥感学报, 2020, 24(6):739-751.
|
| [8] |
张峰, 桑夺坤. 徕卡ADS100相机使用运-5飞行平台在1∶500地形图测绘中的应用[J]. 测绘通报, 2015(8): 133-134.
|
| [9] |
吴兴, 张霞, 孙雪剑, 等. SPARK卫星高光谱数据辐射质量评价[J]. 遥感技术与应用, 2018, 33(2): 233-240.
|
| [10] |
刘睿, 孙九林, 王卷乐, 等. 环境与灾害监测预报小卫星CCD 数据质量评价[J]. 地球科学进展, 2011, 26 (9):971-979.
|
| [11] |
覃帮勇. 高光谱遥感数据质量评价体系及方法研究[D]. 北京: 中国科学院大学, 2014.
|
| [12] |
周雨霁, 田庆久. EO-1 Hyperion高光谱数据的质量评价[J]. 地球信息科学, 2008, 10(5):678-683.
|
| [13] |
曹春旭. 资源一号02C卫星数据质量评价[D]. 北京: 中国地质大学(北京), 2014.
|
| [14] |
王崇倡, 薛荣荣, 赵世湖, 等. GF-5卫星高光谱影像数据质量评价与分析[J]. 地理与地理信息科学, 2021, 37(1):33-38,125.
|
| [15] |
张立福, 王飒, 颜军, 等. 珠海一号高光谱数据辐射质量评价[J]. 遥感学报, 2023, 27(8):1925-1935.
|
| [16] |
孙韬, 王鹏波, 方俊永, 等. 天绘一号03星三线阵/多光谱载荷影像质量评价[J]. 遥感学报, 2016, 20(6):1335-1341.
|
| [17] |
田艳琴, 郭平, 卢汉清. 基于灰度共生矩阵的多波段遥感图像纹理特征的提取[J]. 计算机科学, 2004, 31(12):162-163,195.
|
| [18] |
薄华, 马缚龙, 焦李成. 图像纹理的灰度共生矩阵计算问题的分析[J]. 电子学报, 2006, 34(1):155-158,134.
|
| [19] |
刘丽, 匡纲要. 图像纹理特征提取方法综述[J]. 中国图象图形学报, 2009, 14(4):622-635.
|
| [20] |
|
| [21] |
姚成, 赵晋陵. 泰国THEOS遥感影像质量评价[J]. 安徽农业大学学报, 2015, 42(2):316-321.
|
| [22] |
|
| [23] |
徐文, 龙小祥, 李庆鹏. “高分二号”卫星相机影像辐射质量评价[J]. 航天返回与遥感, 2015, 36(4):1-9.
|
| [24] |
徐文, 龙小祥, 李庆鹏, 等. “高分四号”卫星影像辐射与几何精度评价[J]. 航天返回与遥感, 2016, 37(4):16-25.
|
| [25] |
马晶, 王荣彬, 高娟, 等. 一种遥感影像的自动噪声评价方法[J]. 遥感信息, 2012, 27(3):78-82.
|
| [26] |
王春媛. 遥感图像几何校正及目标识别技术研究[D]. 哈尔滨: 哈尔滨工业大学, 2014.
|
| [27] |
魏丹丹, 甘甫平, 尚坤, 等. CBERS-04星PAN/MUX图像几何定位精度评价[J]. 无线电工程, 2018, 48(5):401-405.
|
| [28] |
国家测绘局. CH/T 9008.1—2010基础地理信息数字成果1∶500、1∶1 000、1∶2 000数字线划图[S]. 北京: 国家测绘局, 2010.
State Bureau of Surveying and Mapping. CH/T 9008.1-2010 Digital products of fundamental geographic information 1∶500,1∶1 000,1∶2 000 digital line graphs[S]. Beijing: State Bureau of Surveying and Mapping, 2010.
|
| [29] |
国家测绘局. CH/T 9008.2—2010基础地理信息数字成果1∶500、1∶1 000、1∶2 000数字高程模型[S]. 北京: 国家测绘局, 2010.
State Bureau of Surveying and Mapping. CH/T 9008.2-2010 Digital products of fundamental geographic information 1∶500,1∶1 000,1∶2 000 digital line graphs[S]. Beijing: State Bureau of Surveying and Mapping, 2010.
|
| [30] |
国家测绘局. CH/T 9008.3—2010基础地理信息数字成果1∶500、1∶1 000、1∶2 000数字正射影像图[S]. 北京: 国家测绘局, 2010.
State Bureau of Surveying and Mapping. CH/T 9008.3-2010 Digital products of fundamental geographic information 1∶500,1∶1 000,1∶2 000 digital line graphs[S]. Beijing: State Bureau of Surveying and Mapping, 2010.
|
| [31] |
|
| [32] |
|
/
| 〈 |
|
〉 |