
Remote Sensing for Natural Resources >
A comparative study of water body classification of wetlands based on hyperspectral images from the ZY1-02D satellite: A case study of the Baiyangdian wetland
Received date: 2023-11-14
Revised date: 2023-12-26
Online published: 2026-06-03
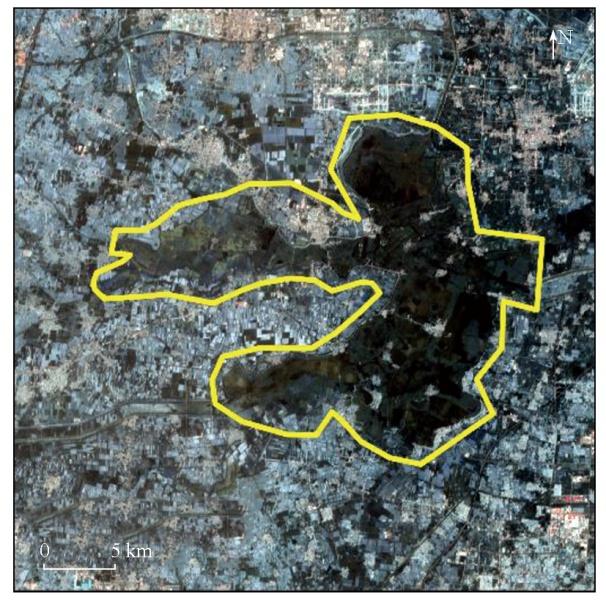
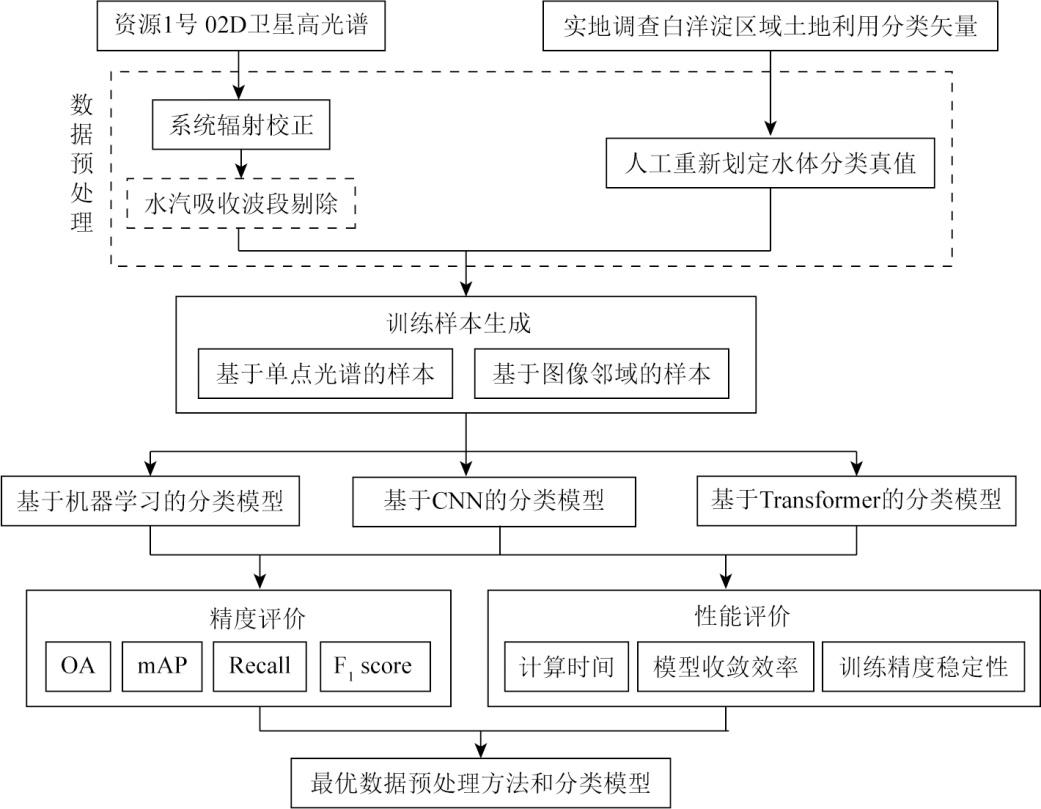
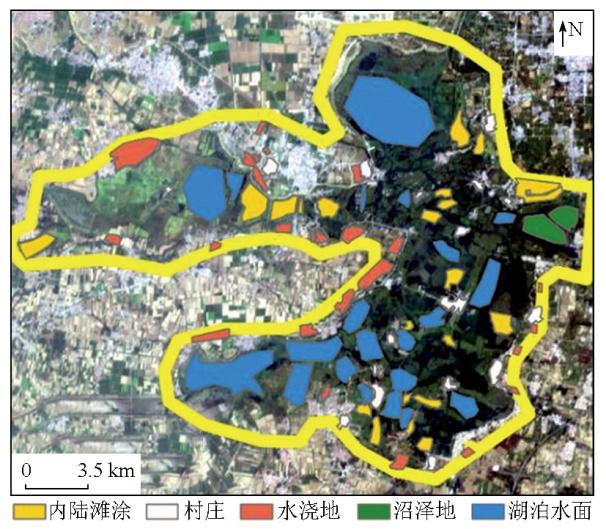
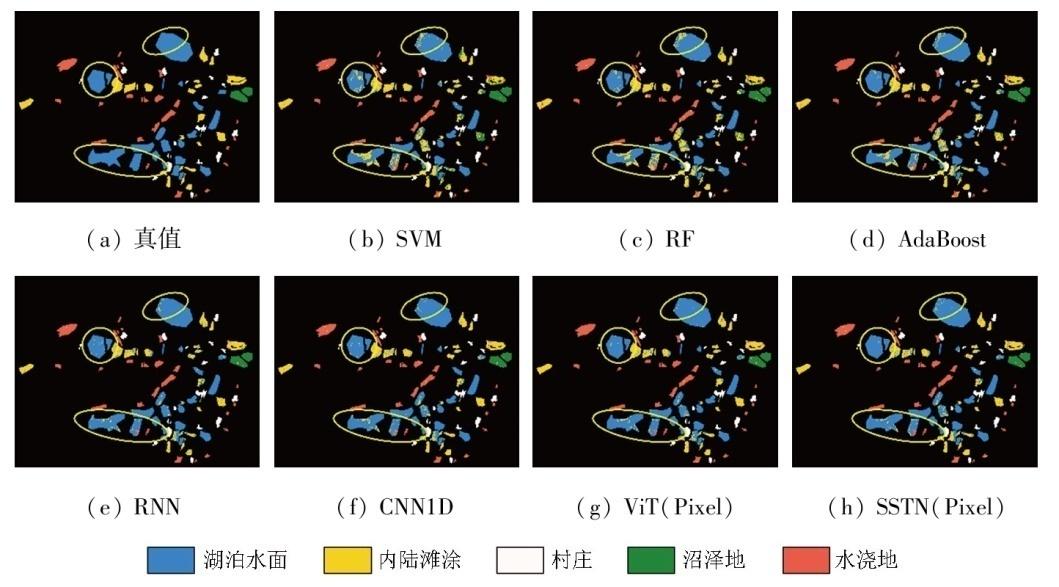
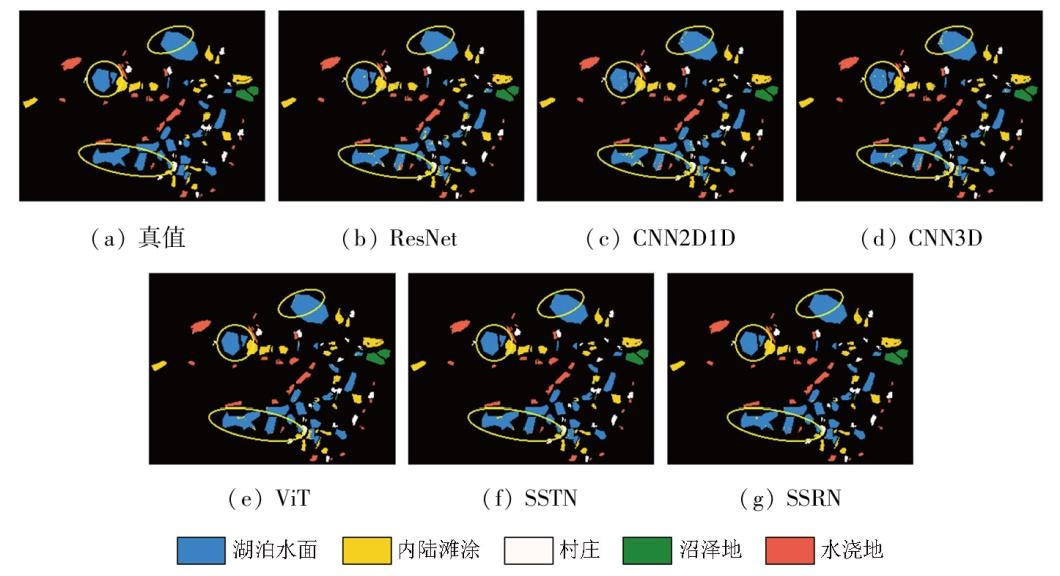
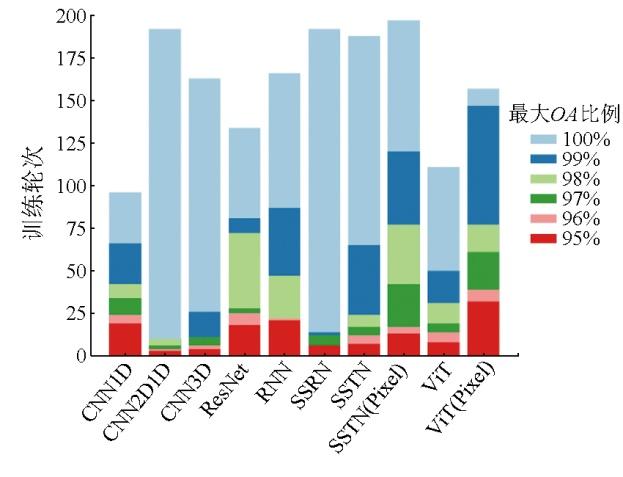
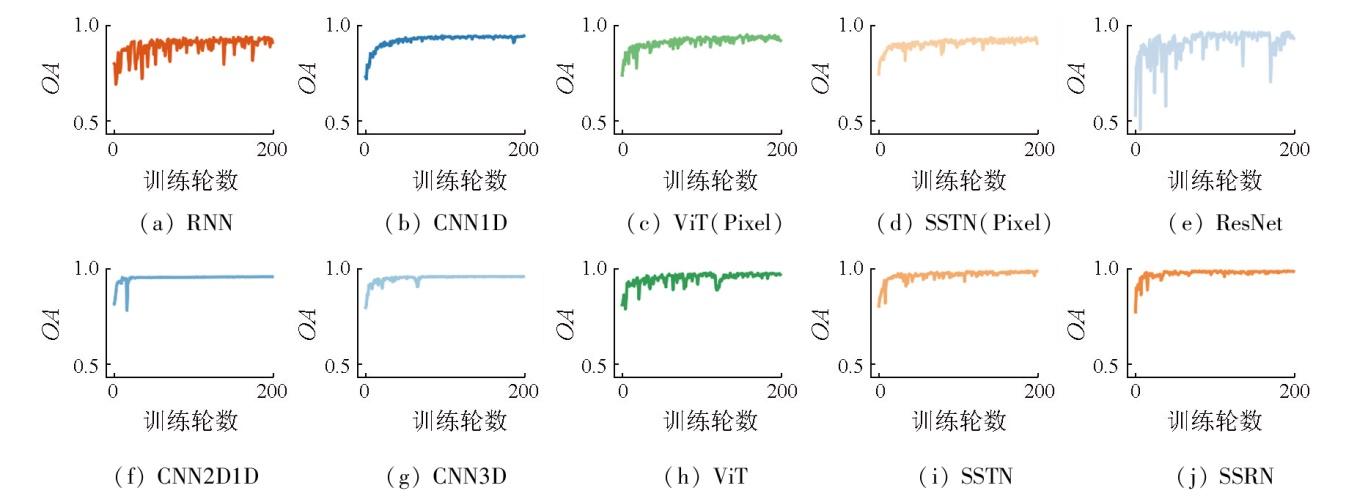
Water bodies serve as one of the three major elements in maintaining wetlands. Their dynamic monitoring can effectively protect wetland ecosystems. Conventional methods for monitoring water bodies in wetlands employ field surveys or manual interpretation of remote sensing images, which are costly and inefficient, and inapplicable to continuous dynamic monitoring. In recent years, using methods like machine and deep learning to extract water body features from satellite remote sensing images has developed into an effective means for monitoring water bodies in wetlands. Based on the hyperspectral images from the ZY1-02D satellite, this study classified the water bodies in the Baiyangdian wetland using machine learning, convolutional and transformer neural networks. The accuracy and computational efficiency of water body classification under different spectral preprocessing methods and different image neighborhood sizes in training were compared to explore the optimal data preprocessing method and classification model for water bodies in wetlands. The results indicate that deep learning significantly outperformed machine learning in classification accuracy and computational efficiency. In particular, the spectral-spatial residual network (SSRN) model based on the convolutional neural network achieved the highest classification accuracy (OA: 99.09 %, Recall: 99.62 %, F1-score: 0.99) under conditions of all spectral bands and a 9×9 neighborhood size. Besides, despite a low signal-to-noise ratio, the atmospheric water vapor absorption band contained significant information, assisting in improving the classification accuracy of water bodies in the wetland during model training and prediction. The results of this study are expected to provide methodological support for the business operation of water body classification of wetlands.
CHEN Min , PENG Shuan , WANG Tao , WU Xuefang , LIU Runpu , CHEN Yushuo , FANG Yanru , YANG Pingjian . A comparative study of water body classification of wetlands based on hyperspectral images from the ZY1-02D satellite: A case study of the Baiyangdian wetland[J]. Remote Sensing for Natural Resources, 2025 , 37(3) : 133 -141 . DOI: 10.6046/zrzyyg.2023340
表1 ZY1-02D卫星高光谱图像参数Tab.1 Parameters of hyperspectral sensor on ZY1-02D |
| 参数名称 | VNIR波段 | SWIR波段 |
|---|---|---|
| 波长范围/nm | 395~1 040 | 1 005~2 501 |
| 幅宽/km | 60 | 60 |
| 地面分辨率/m | 30 | 30 |
| 光谱分辨率/nm | 10 | 20 |
| 波段数量 | 76 | 90 |
| 图像量化/bits | 12 | 12 |
| 相对辐射定标精度/% | 0.32 | 0.65 |
表2 训练和验证样本像素数量和面积Tab.2 Areas and counts of training and test samples |
| 土地利用类型 | 训练样本/个 | 验证样本/个 | 总面积/km2 |
|---|---|---|---|
| 湖泊水面 | 1 000 | 46 977 | 43.18 |
| 内陆滩涂 | 1 000 | 15 866 | 15.18 |
| 村庄 | 1 000 | 5 448 | 5.80 |
| 沼泽地 | 1 000 | 2 848 | 3.46 |
| 水浇地 | 1 000 | 10 956 | 10.76 |
表3 基于单点光谱的湿地分类精度Tab.3 Wetland classification accuracy based on different pixel-based methods |
| 模型 | 每类样本的分类准确率 | OA/% | mAP/% | F1 | R/% | ||||
|---|---|---|---|---|---|---|---|---|---|
| 湖泊水面/% | 内陆滩涂/% | 村庄/% | 沼泽地/% | 水浇地/% | |||||
| SVM | 97.51 | 59.66 | 99.27 | 46.75 | 92.60 | 83.90 | 89.73 | 0.82 | 89.30 |
| AdaBoost | 98.17 | 69.96 | 99.61 | 71.90 | 93.29 | 89.48 | 95.61 | 0.89 | 93.23 |
| RF | 97.72 | 61.96 | 98.43 | 57.54 | 91.51 | 85.33 | 92.67 | 0.84 | 90.06 |
| CNN1D | 97.51 | 84.76 | 99.56 | 90.11 | 96.10 | 94.54 | 98.13 | 0.95 | 95.75 |
| RNN | 95.80 | 87.08 | 99.13 | 85.68 | 96.09 | 94.03 | 97.74 | 0.94 | 94.95 |
| SSTN(Pixel) | 96.87 | 83.94 | 98.53 | 89.34 | 94.99 | 93.79 | 97.55 | 0.94 | 95.07 |
| ViT(Pixel) | 97.09 | 88.59 | 99.38 | 91.91 | 95.00 | 95.11 | 98.50 | 0.95 | 95.83 |
表4 基于邻域范围光谱的湿地分类精度Tab.4 Wetland classification accuracy using different patch-based methods |
| 模型 | 每类样本的分类准确率 | OA/% | mAP/% | F1 | R/% | ||||
|---|---|---|---|---|---|---|---|---|---|
| 湖泊水面/% | 内陆滩涂/% | 村庄/% | 沼泽/% | 水浇地/% | |||||
| ResNet | 98.68 | 90.65 | 99.85 | 96.57 | 95.88 | 96.67 | 99.14 | 0.97 | 98.06 |
| CNN2D1D | 99.03 | 87.31 | 99.56 | 93.65 | 96.44 | 96.03 | 98.90 | 0.96 | 97.83 |
| CNN3D | 98.69 | 88.45 | 99.47 | 94.83 | 96.68 | 96.20 | 98.93 | 0.97 | 97.78 |
| ViT | 99.66 | 93.22 | 98.48 | 97.50 | 99.06 | 98.11 | 99.69 | 0.98 | 98.96 |
| SSRN | 99.55 | 97.99 | 99.80 | 99.30 | 99.04 | 99.19 | 99.93 | 0.99 | 99.50 |
| SSTN | 99.47 | 97.37 | 99.80 | 99.96 | 99.14 | 99.05 | 99.83 | 0.99 | 99.41 |
表5 去除低信噪比波段后基于单点光谱和基于邻域范围光谱的湿地分类精度Tab.5 Wetland classification accuracy based on pixel-based method and patch-based method after removing low signal-to-noise ratio bands |
| 类型 | 模型 | 每类样本的分类准确率 | OA/% | mAP/% | F1 | R/% | OA-AB/% | ||||
|---|---|---|---|---|---|---|---|---|---|---|---|
| 湖泊水 面/% | 内陆滩 涂/% | 村庄/% | 沼泽/% | 水浇地/% | |||||||
| 基 于 单 点 | SVM | 96.68 | 53.85 | 96.93 | 40.63 | 92.38 | 80.30 | 84.00 | 0.79 | 86.14 | 83.90 |
| AdaBoost | 97.86 | 64.40 | 97.24 | 59.22 | 92.71 | 86.44 | 92.80 | 0.85 | 90.76 | 89.48 | |
| RF | 97.44 | 60.11 | 96.12 | 53.25 | 91.44 | 84.05 | 90.92 | 0.83 | 88.72 | 85.33 | |
| CNN1D | 97.32 | 85.21 | 99.45 | 84.85 | 95.87 | 94.30 | 98.13 | 0.94 | 95.94 | 94.54 | |
| RNN | 96.47 | 81.47 | 99.45 | 86.61 | 96.01 | 93.12 | 97.20 | 0.93 | 94.55 | 94.03 | |
| SSTN(Pixel) | 94.84 | 83.40 | 99.16 | 85.62 | 94.56 | 92.55 | 95.98 | 0.92 | 92.48 | 93.79 | |
| ViT(Pixel) | 95.95 | 88.38 | 99.00 | 79.04 | 95.53 | 93.95 | 97.75 | 0.93 | 95.01 | 95.11 | |
| 基 于 邻 域 | ResNet | 96.97 | 87.69 | 98.07 | 92.37 | 97.54 | 95.10 | 98.74 | 0.95 | 96.36 | 96.67 |
| CNN2D1D | 97.61 | 82.49 | 99.49 | 84.62 | 96.18 | 93.79 | 97.99 | 0.94 | 96.28 | 96.03 | |
| CNN3D | 95.88 | 85.54 | 98.67 | 92.54 | 94.62 | 93.75 | 97.94 | 0.94 | 95.44 | 96.20 | |
| ViT | 95.53 | 81.71 | 98.50 | 85.77 | 93.96 | 92.35 | 96.66 | 0.92 | 93.47 | 98.11 | |
| SSRN | 99.88 | 97.36 | 99.98 | 94.21 | 99.19 | 99.09 | 99.95 | 0.99 | 99.62 | 99.19 | |
| SSTN | 98.05 | 95.43 | 99.65 | 94.79 | 97.82 | 97.51 | 99.57 | 0.98 | 98.02 | 99.05 | |
表6 训练1轮所需时间Tab.6 Training time of each epoch(s) |
| 网络 | 时间 | 网络 | 时间 | 网络 | 时间 | |
|---|---|---|---|---|---|---|
| SVM | 63.36 | SSTN(Pixel) | 14.76±0.15 | SSRN | 35.19±3.02 | |
| RF | 1.01(多核),7.11(单核) | RNN | 14.93±0.50 | ViT | 35.02±5.78 | |
| AdaBoost | 98.26 | ResNet | 21.74±0.38 | SSTN | 21.29±0.40 | |
| CNN1D | 14.17±0.17 | CNN2D1D | 21.72±0.49 | |||
| ViT(Pixel) | 14.76±0.17 | CNN3D | 20.72±0.31 | |||
| [1] |
李丹, 吴保生, 陈博伟, 等. 基于卫星遥感的水体信息提取研究进展与展望[J]. 清华大学学报(自然科学版), 2020, 60(2):147-161.
|
| [2] |
朱金峰, 周艺, 王世新, 等. 1975—2018年白洋淀湿地变化分析[J]. 遥感学报, 2019, 23(5):971-986.
|
| [3] |
韦嫦, 付波霖, 覃娇玲, 等. 基于多时相Sentinel-1A的沼泽湿地水面时空动态变化监测[J]. 自然资源遥感, 2022, 34(2):251-260.doi:10.6046/zrzyyg.2021205.
|
| [4] |
伊力哈穆江·艾尼弯, 孔翠翠, 马利刚, 等. 基于中分辨率影像湿地离散水体提取研究——以新疆阿勒泰科克苏湿地为例[J]. 安徽农业科学, 2022, 50(11):50-55.
|
| [5] |
崔囤月, 王世东, 张学军. 1991—2021年雄安新区土地利用与植被覆盖变化遥感研究[J]. 自然资源遥感, 2023, 35(4):214-225.doi:10.6046/zizyyg.2022311.
|
| [6] |
梁爽, 宫兆宁, 赵文吉, 等. 基于多季相Sentinel-2影像的白洋淀湿地信息提取[J]. 遥感技术与应用, 2021, 36(4):777-790.
|
| [7] |
|
| [8] |
孙伟伟, 任凯, 肖晨超, 等. 资源一号02D卫星高光谱与多光谱融合数据滨海湿地分类应用[J]. 航天器工程, 2020, 29(6):162-168.
|
| [9] |
河北省生态环境厅. 2022河北省生态环境状况公报[R/OL]. (2022-05)[2023-11-06]. http://hbepb.hebei.gov.cn/res/hbhjt/upload/file/20230602/bd9d635a2555484786a9891052dbfa49.pdf.
Department of ecological environment of Hebei Province. 2022 Report on the State of the Ecology and Environment in HeBei Province[R/OL]. (2022-05)[2023-11-06]. http://hbepb.hebei.gov.cn/res/hbhjt/upload/file/20230602/bd9d635a2555484786a9891052dbfa49.pdf.
|
| [10] |
资源一号02D卫星总体概况及影像产品[J]. 航天器工程, 2020, 29(6):3-14.
General situation and image products of ZY-1 02D satellite[J]. Spacecraft Engineering, 2020, 29(6):3-14.
|
| [11] |
刘银年, 孙德新, 梁建, 等. 资源一号02D卫星高光谱相机在轨性能及稳定性评估[J]. 航天器工程, 2020, 29(6):93-97.
|
| [12] |
|
| [13] |
|
| [14] |
|
| [15] |
|
| [16] |
|
| [17] |
|
| [18] |
|
| [19] |
|
| [20] |
|
/
| 〈 |
|
〉 |