
Remote Sensing for Natural Resources >
Classification of wetland plant communities in the Yellow River Delta based on GEE and multisource remote sensing data
Received date: 2023-11-14
Revised date: 2024-03-06
Online published: 2026-06-03
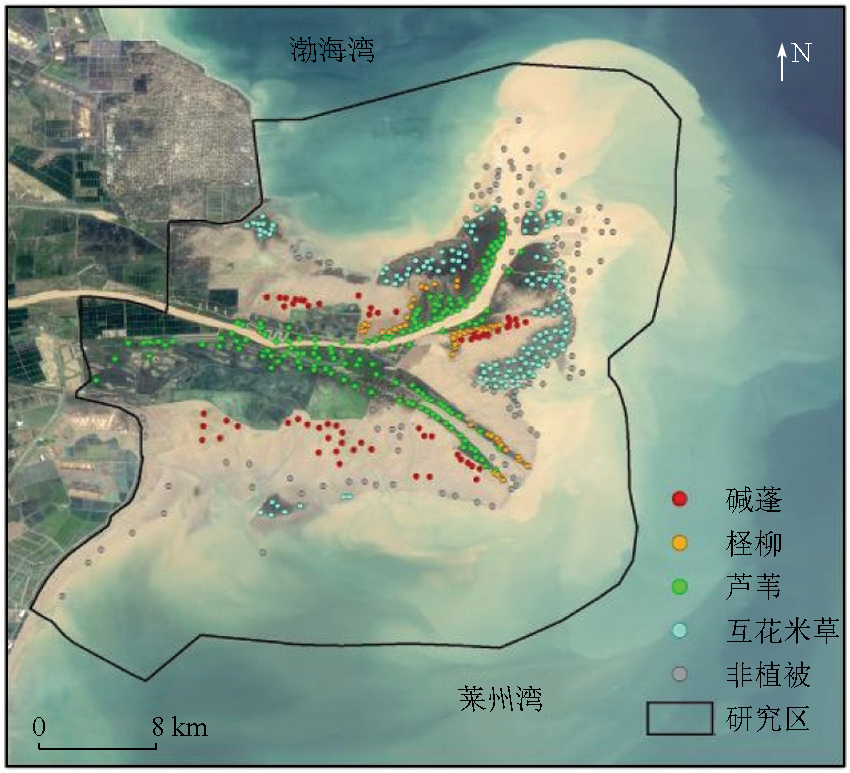
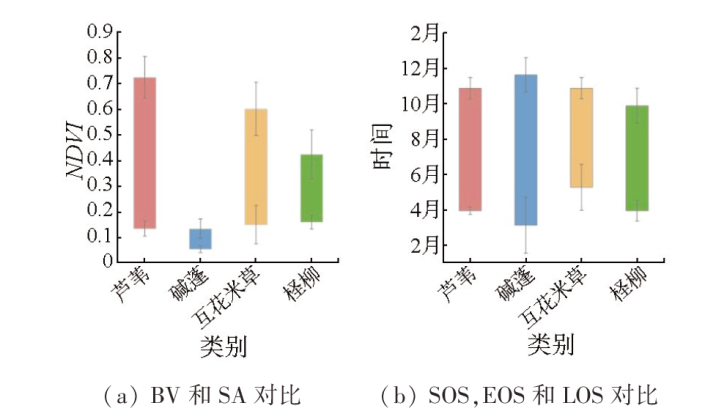
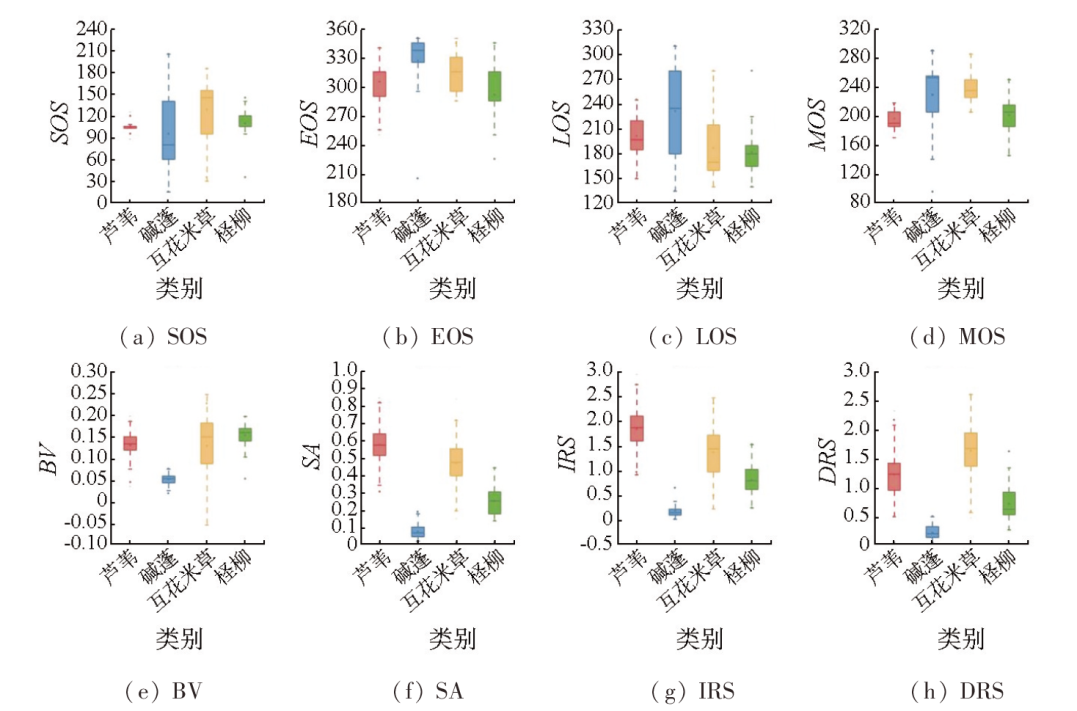
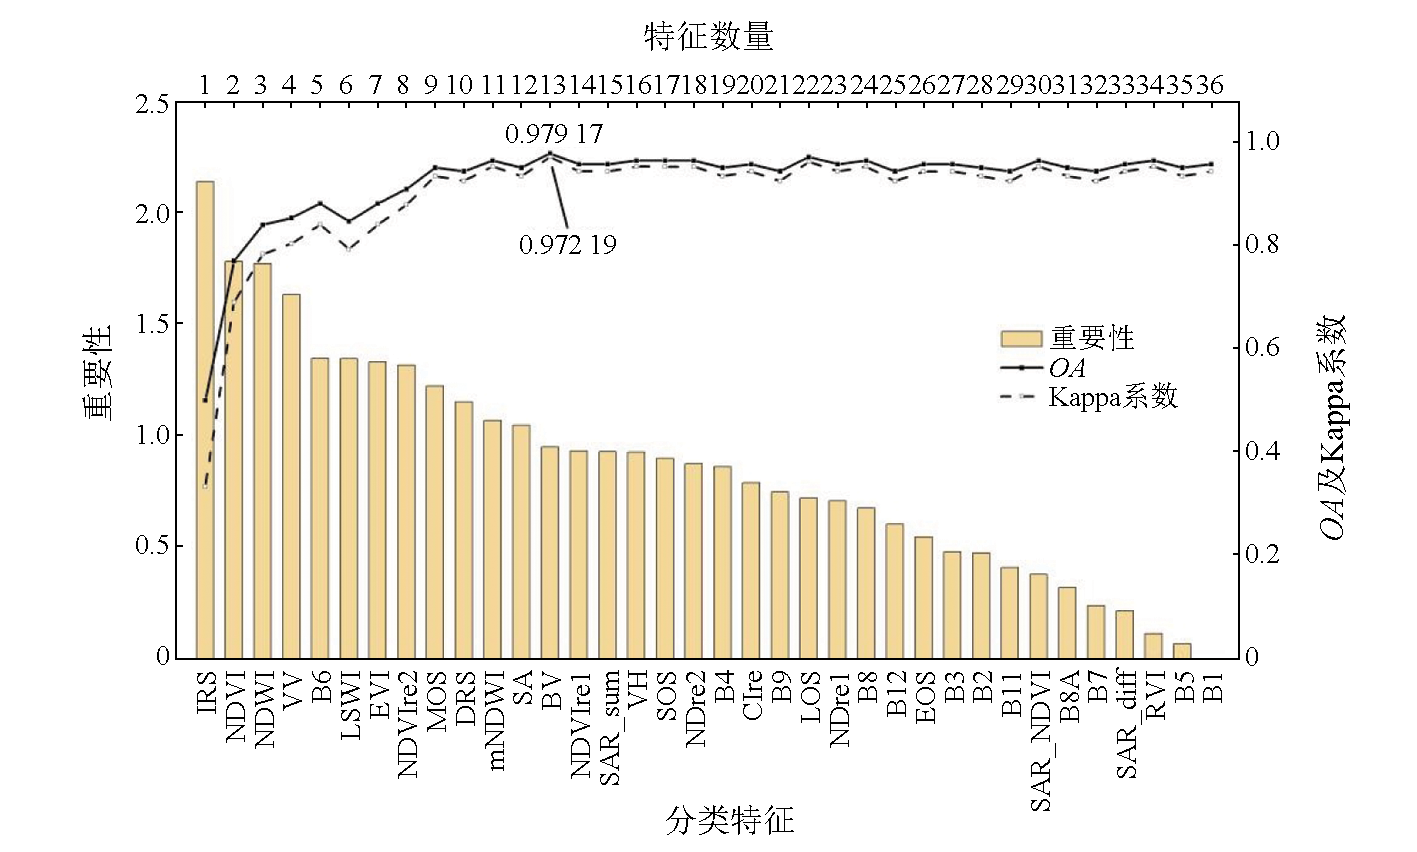
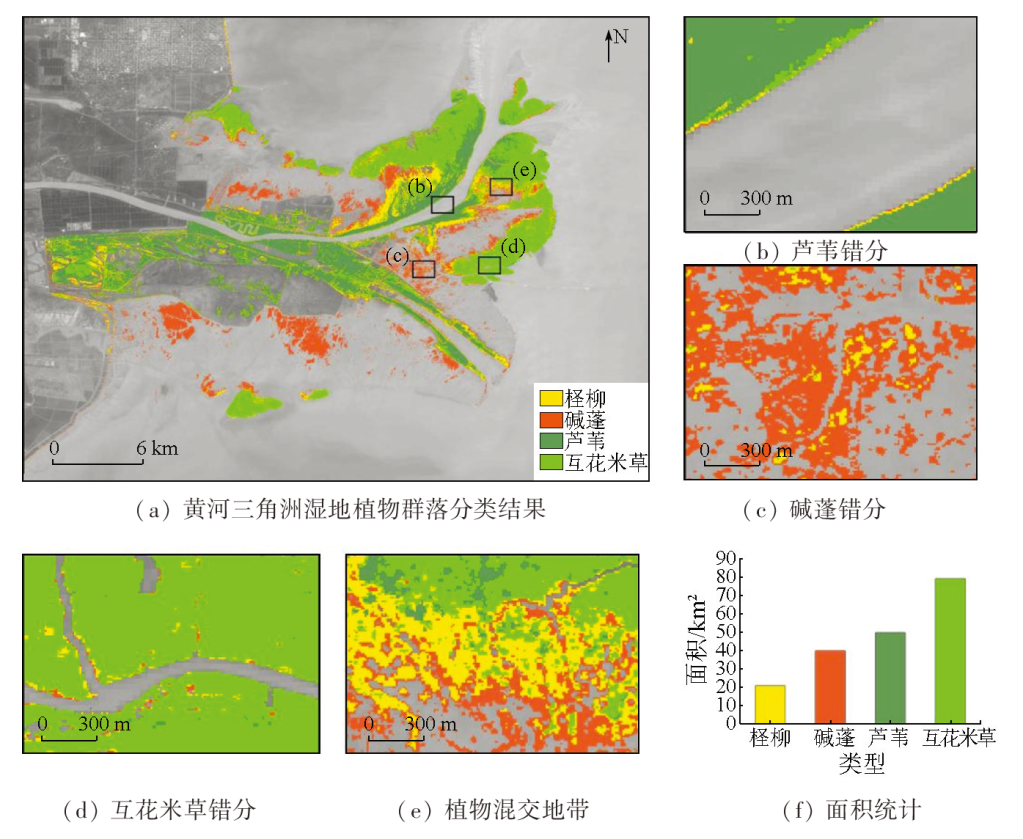
Accurately identifying plant communities in coastal wetlands is critical for strengthening the ecological quality monitoring and enhancing the ecosystem functions of coastal wetlands. With the Yellow River Delta as the study area, this study constructed a feature vector set including phenological, optical, red-edge, and radar features based on Sentinel-1/2 image data using the Google Earth Engine (GEE) platform. It classified the wetland plant communities in the Yellow River Delta in 2021 using the random forest algorithm. Moreover, it explored the effects of phenological features in classification. The results reveal an overall classification accuracy of 97.91 % and a Kappa coefficient of 0.97. In 2021, the distribution areas of Phragmites australis, Suaeda glauca, Spartina alterniflora, and Tamarix chinensis were 49.91 km2, 39.91 km2, 79.36 km2, and 20.86 km2, respectively. The phenological features of typical plant communities in the Yellow River Delta wetlands were effectively extracted based on the normalized difference vegetation index (NDVI) time-series fitting curves. The highly distinguishable features included the maximum value date, base value, growth amplitude, beginning-of-season growth rate, and end-of-season decline rate. Compared to other feature variables, phenological features contributed more significantly to the overall classification accuracy, suggesting their prominent role in classification. The results of this study provide a methodological reference and scientific basis for the plant community monitoring and ecological conservation of coastal wetlands in the Yellow River Delta.
ZHANG Nianqiu , MAO Dehua , FENG Kaidong , ZHEN Jianing , XIANG Hengxing , REN Yongxing . Classification of wetland plant communities in the Yellow River Delta based on GEE and multisource remote sensing data[J]. Remote Sensing for Natural Resources, 2025 , 37(2) : 265 -273 . DOI: 10.6046/zrzyyg.2023345
表1 卫星遥感数据基本信息Tab.1 Information of satellite remote sensing data |
| 数据 名称 | 传感器 类型 | 影像获取时间 | 空间分 辨率/m | 重访 周期/d |
|---|---|---|---|---|
| Sentinel-1 | SAR-C | 2021-05-01—2021-10-31 | 10 | 6 |
| Sentinel-2 | MSI | 2021-01-01—2021-12-31 | 10~60 | 2~5 |
表2 各类植物和非植被的样本数量Tab.2 Number of samples for each plant species and non-vegetation (个) |
| 类型 | 芦苇 | 碱蓬 | 互花米草 | 柽柳 | 非植被 | 总计 |
|---|---|---|---|---|---|---|
| 训练样本 | 111 | 39 | 131 | 37 | 42 | 360 |
| 验证样本 | 36 | 23 | 53 | 19 | 13 | 144 |
| 合计 | 147 | 62 | 184 | 56 | 55 | 504 |
表3 特征集描述Tab.3 Description of the feature set |
| 特征变量 | 特征简称 | 特征说明 |
|---|---|---|
| 光谱波段 | B | B1,B2,B3,B4,B8,B9,B11,B12 |
| 植被指数 | NDVI | (B8-B4)/(B8+B4) |
| EVI | 2.5[(B8-B4)/(B8+6B4-7.5B2+1)] | |
| RVI | B8/B4 | |
| 水体指数 | NDWI | (B3-B8)/(B3+B8) |
| mNDWI | (B3-B11)/(B3+B11) | |
| LSWI | (B8-B11)/(B8+B11) | |
| 红边特征 | Bre | B5,B6,B7,B8A |
| NDVIre1 | (B8A-B5)/(B8A+B5) | |
| NDVIre2 | (B8A-B6)/(B8A+B6) | |
| NDre1 | (B6-B5)/(B6+B5) | |
| NDre2 | (B7-B5)/(B7+B5) | |
| CIre | B7/B5-1 | |
| 雷达特征 | VV | 垂直发射和垂直接收的极化波 |
| VH | 垂直发射和水平接收的极化波 | |
| SAR_sum | VV+VH | |
| SAR_diff | VV-VH | |
| SAR_NDVI | (VV-VH)/(VV+VH) | |
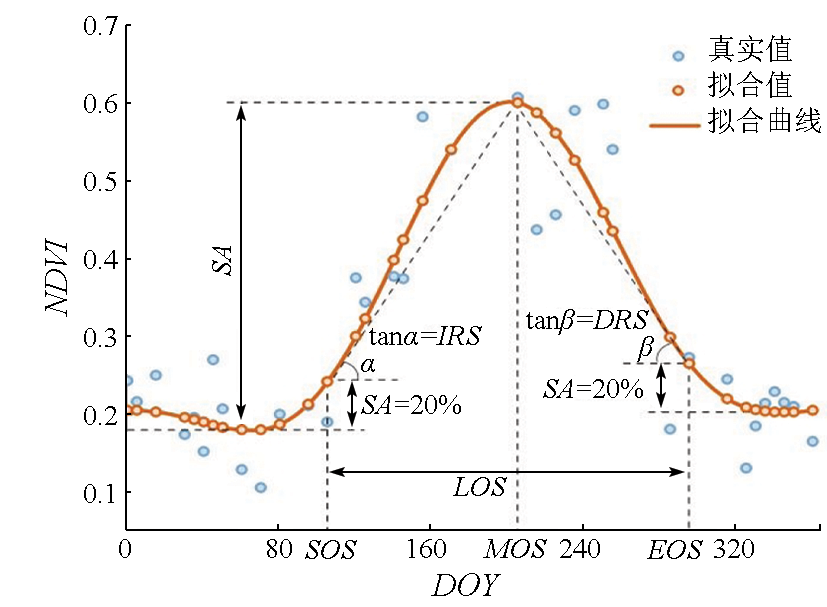
| 物候特征 | SOS | NDVI从左最小值向右增加到季节振幅的20%对应的日期 |
| EOS | NDVI从右最小值向左增加到季节振幅的20%对应的日期 | |
| LOS | 从生长季开始到生长季结束持续的时间 | |
| MOS | 拟合函数在季节中达到最大值对应的日期 | |
| BV | 拟合函数的最小值 | |
| SA | 拟合函数最大值与基准值之差 | |
| IRS | (最大值-SOS对应的NDVI)/(MOS-SOS) | |
| DRS | (最大值-EOS对应的NDVI)/(EOS-MOS) |
表4 分类模型信息Tab.4 Information of classification model |
| 方案 | 特征组合 |
|---|---|
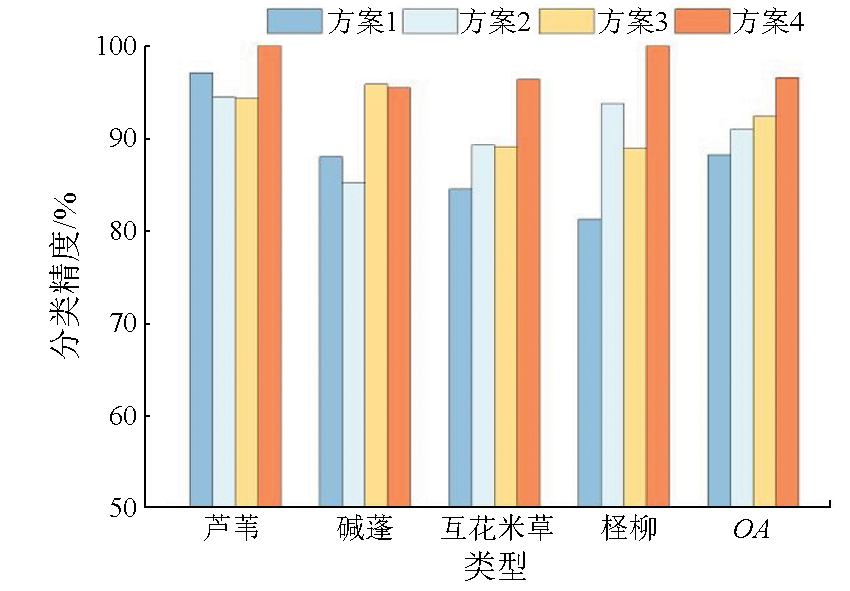
| 方案1 | 传统光学特征 |
| 方案2 | 传统光学特征+红边特征 |
| 方案3 | 传统光学特征+红边特征+雷达特征 |
| 方案4 | 传统光学特征+红边特征+雷达特征+物候特征 |
表6 黄河三角洲湿地植物分类混淆矩阵Tab.6 The confusion matrix of classification of YRD wetland plant species |
| 类型 | 芦苇 | 碱蓬 | 互花米草 | 柽柳 | 非植被 | UA/% | |
|---|---|---|---|---|---|---|---|
| 芦苇 | 36 | 0 | 0 | 0 | 0 | 100.00 | |
| 碱蓬 | 0 | 23 | 0 | 0 | 0 | 100.00 | |
| 互花米草 | 0 | 0 | 52 | 1 | 0 | 98.11 | |
| 柽柳 | 0 | 0 | 0 | 19 | 0 | 100.00 | |
| 非植被 | 0 | 2 | 0 | 0 | 11 | 84.62 | |
| PA/% | 100.00 | 92.00 | 100.00 | 95.00 | 100.00 | — | |
| OA: 97.91% | Kappa系数: 0.972 2 | ||||||
| [1] |
|
| [2] |
|
| [3] |
|
| [4] |
|
| [5] |
马喜君, 陆兆华, 林涛. 盐城海滨湿地生态风险评价[J]. 海洋环境科学, 2010, 29(4):599-602.
|
| [6] |
许婕, 刘加珍, 张天举, 等. 黄河口湿地柽柳灌丛土壤盐渍化特征[J]. 生态学报, 2022, 42(17):7118-7127.
|
| [7] |
刘瑞清, 李加林, 孙超, 等. 基于Sentinel-2遥感时间序列植被物候特征的盐城滨海湿地植被分类[J]. 地理学报, 2021, 76(7):1680-1692.
|
| [8] |
|
| [9] |
|
| [10] |
|
| [11] |
|
| [12] |
|
| [13] |
宁晓刚, 常文涛, 王浩, 等. 联合GEE与多源遥感数据的黑龙江流域沼泽湿地信息提取[J]. 遥感学报, 2022, 26(2):386-396.
|
| [14] |
|
| [15] |
张磊, 宫兆宁, 王启为, 等. Sentinel-2影像多特征优选的黄河三角洲湿地信息提取[J]. 遥感学报, 2019, 23(2):313-326.
|
| [16] |
|
| [17] |
|
| [18] |
|
| [19] |
|
| [20] |
陈健, 李虎, 刘玉锋, 等. 基于Sentinel-2数据多特征优选的农作物遥感识别研究[J]. 自然资源遥感, 2023, 35(4):292-300.doi:10.6046/zrzyyg.2022272.
|
| [21] |
|
| [22] |
|
| [23] |
|
| [24] |
|
| [25] |
李恒凯, 王利娟, 肖松松. 基于多源数据的南方丘陵山地土地利用随机森林分类[J]. 农业工程学报, 2021, 37(7):244-251.
|
| [26] |
|
| [27] |
|
| [28] |
薛朝辉, 钱思羽. 融合Landsat 8与Sentinel-2数据的红树林物候信息提取与分类[J]. 遥感学报, 2022, 26(6):1121-1142.
|
/
| 〈 |
|
〉 |