
Remote Sensing for Natural Resources >
Monitoring the spatiotemporal dynamics of mangrove forests in Beibu Gulf, Guangxi Zhuang Autonomous Region, China, using Google Earth Engine and time-series active and passive remote sensing images
Received date: 2023-12-13
Revised date: 2024-08-03
Online published: 2026-06-03
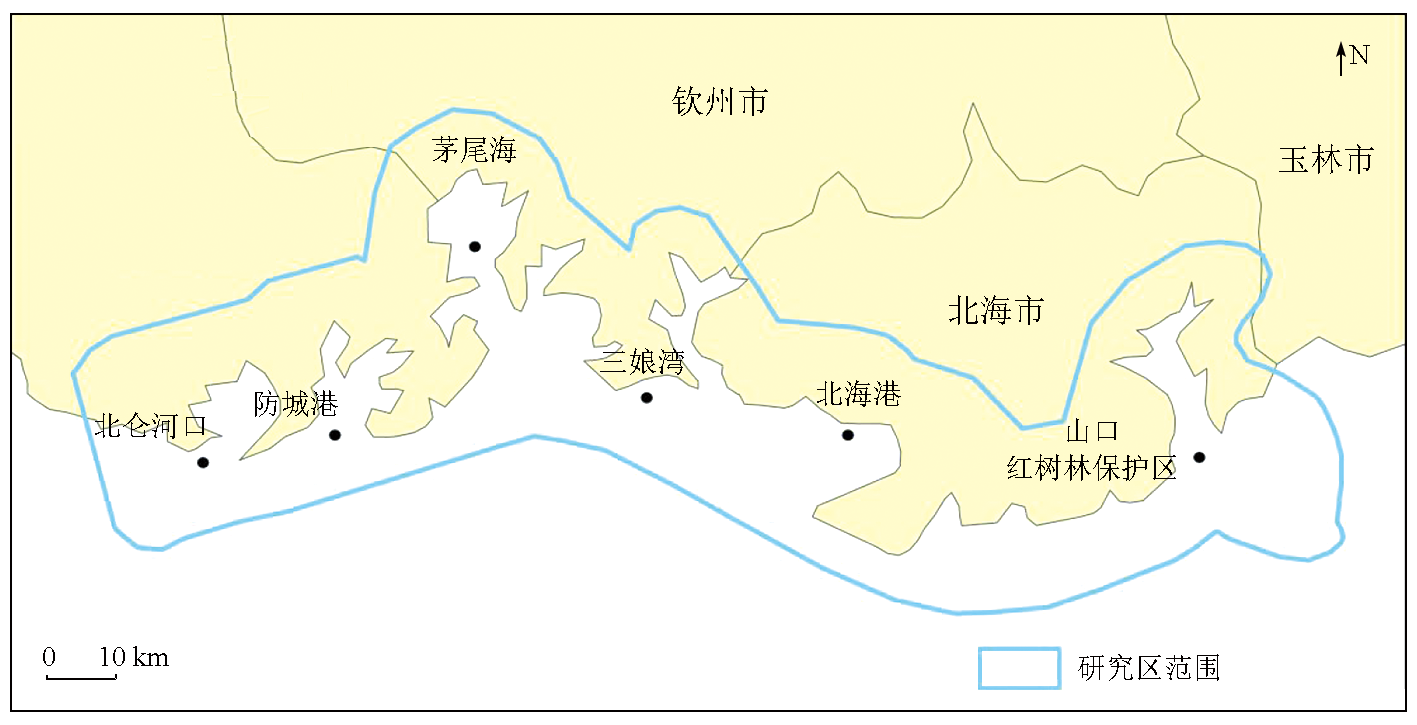
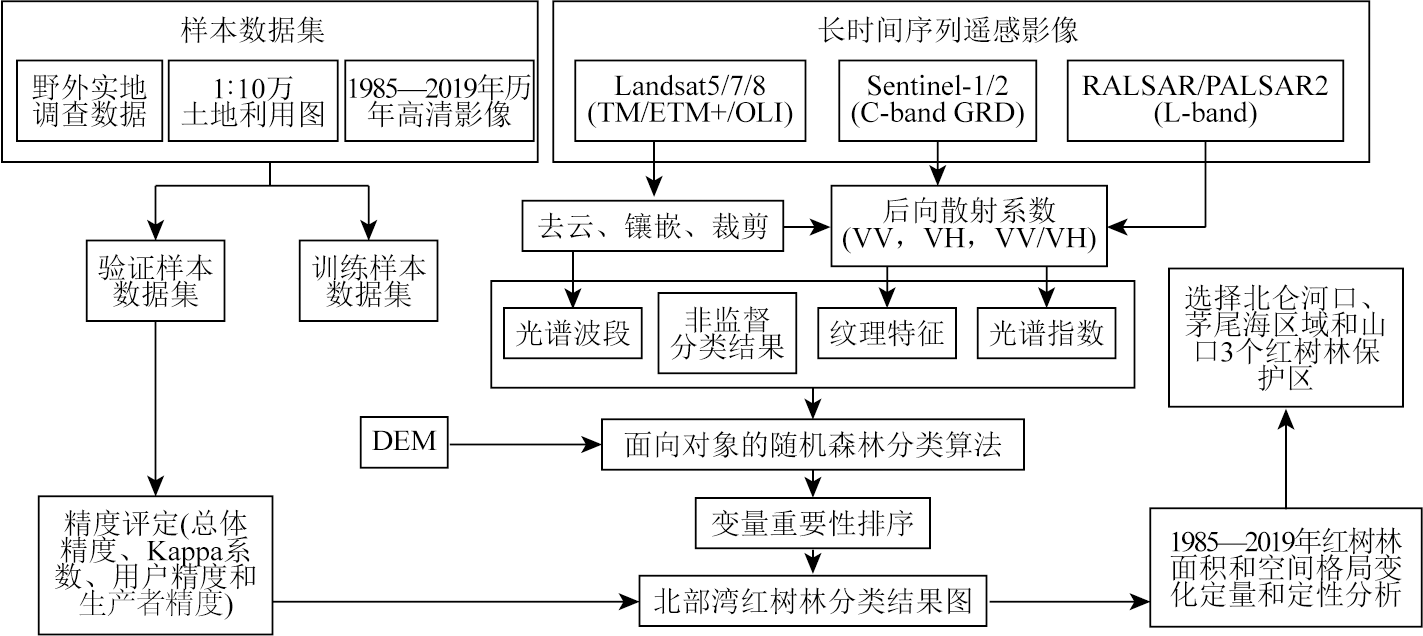
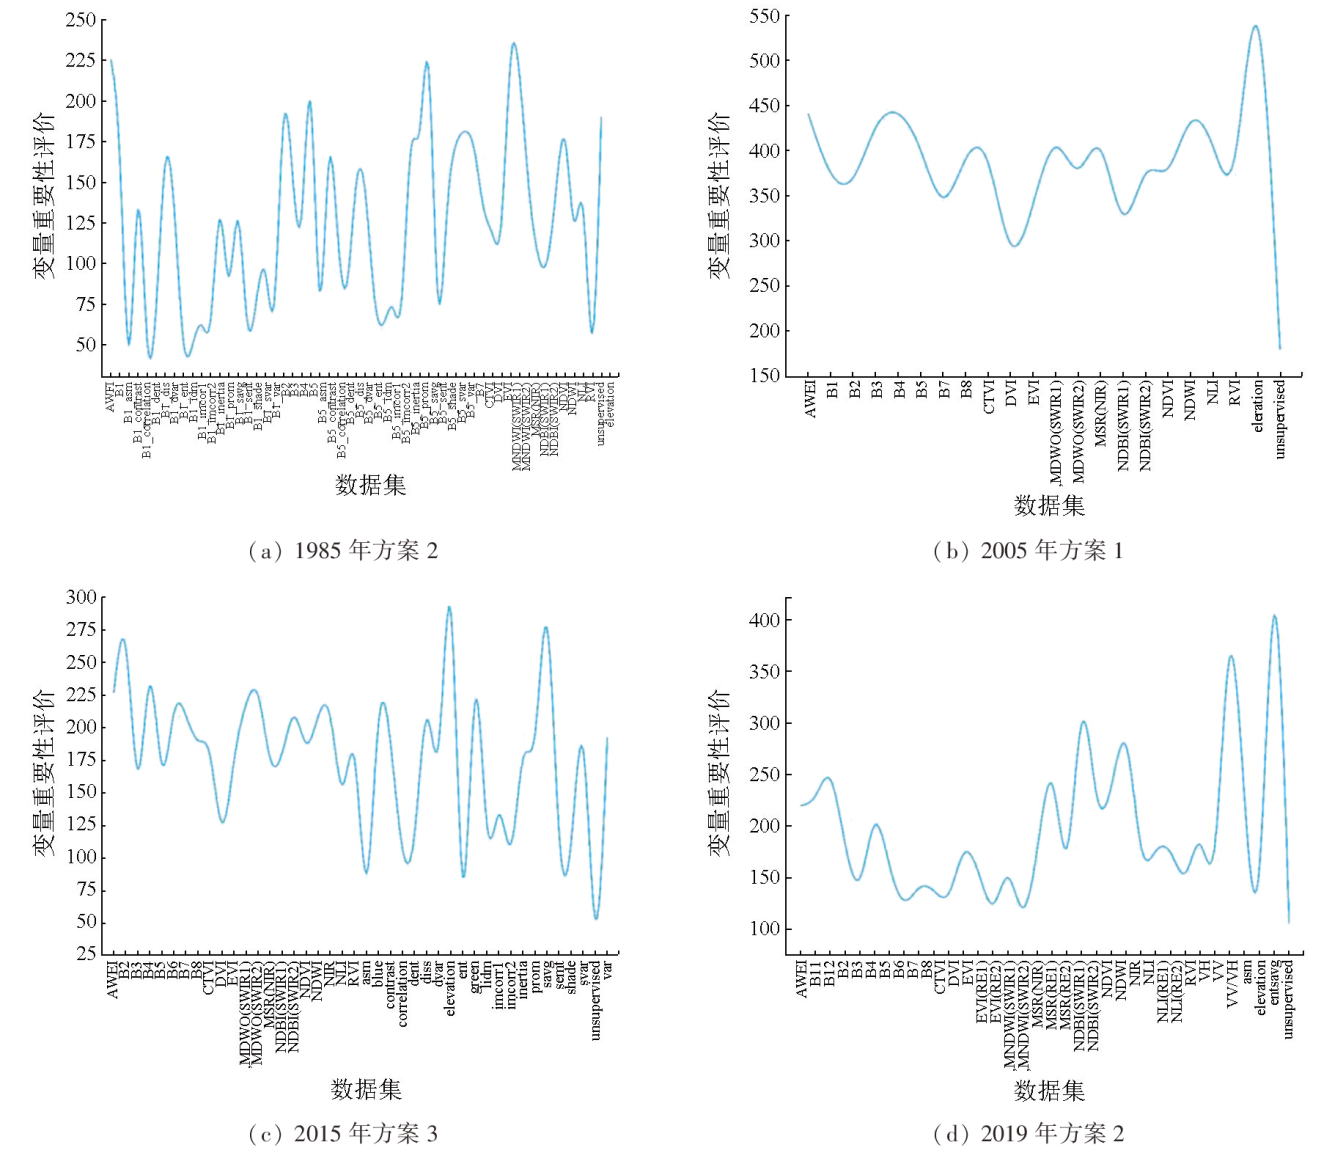
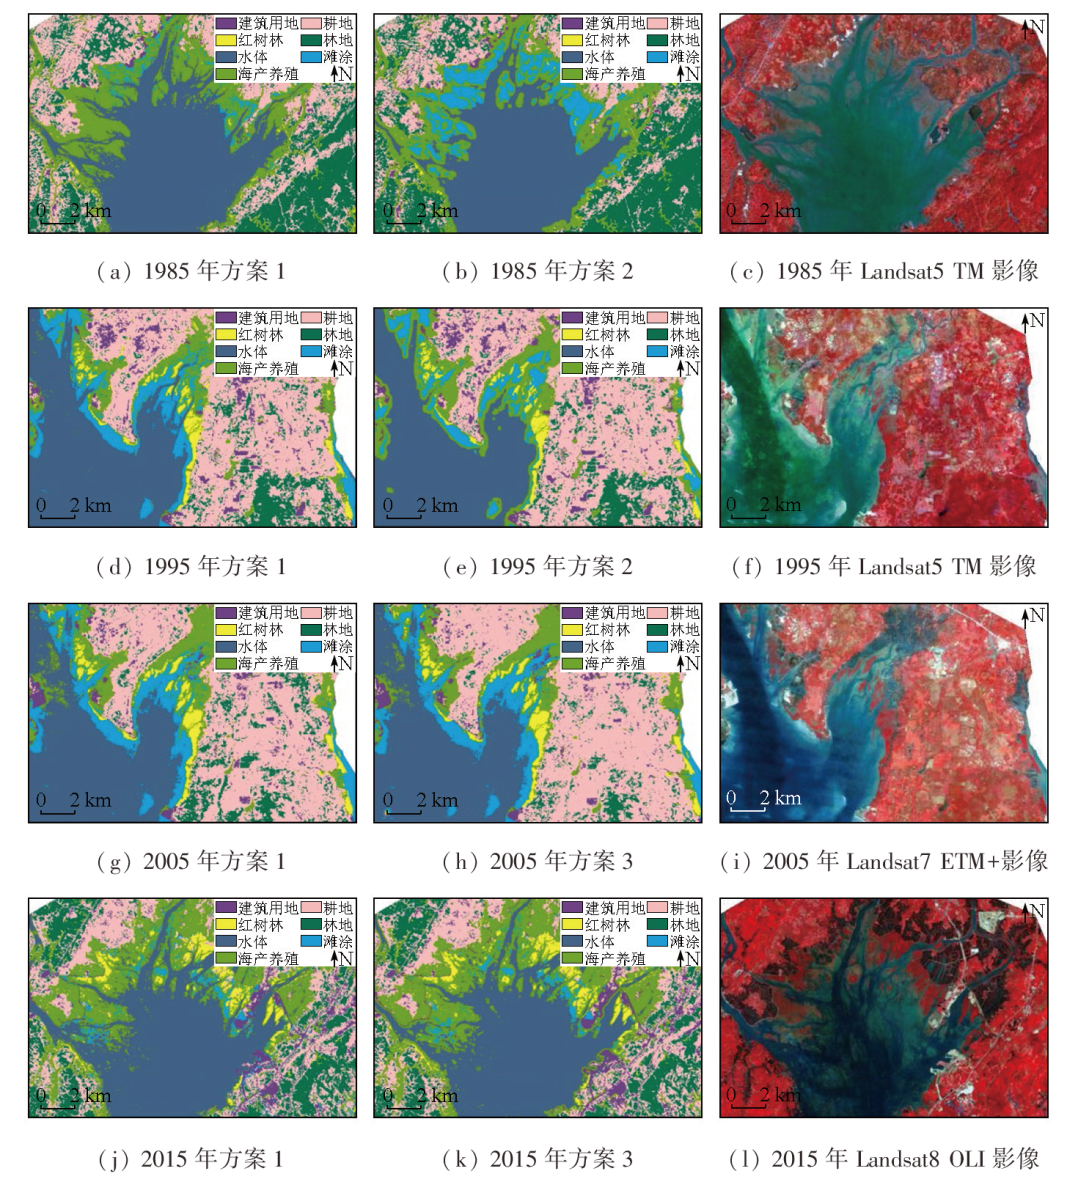
Mangrove forests are recognized as one of the most biodiverse and productive marine ecosystems globally. This study investigated Beibu Gulf, Guangxi Province. Using Landsat, Sentinel, and PALSAR SAR images from 1985 to 2019 as data sources, as well as the Google Earth Engine (GEE) cloud platform, this study established a multisource dataset by integrating spectral bands, spectral indices, texture features, digital elevation models (DEMs), and backscatter coefficients. Furthermore, 14 classification schemes were developed, and a mangrove remote sensing recognition model was built using an object-based random forest (RF) algorithm. Accordingly, the long-time-series spatiotemporal dynamics of mangrove forests in Beibu Gulf were monitored. The monitoring results show that the object-based RF algorithm demonstrates a high ability to identify mangrove forests. Specifically,
DENG Jianming , YAO Hang , FU Bolin , GU Sen , TANG Jie , GAN Yuanyuan . Monitoring the spatiotemporal dynamics of mangrove forests in Beibu Gulf, Guangxi Zhuang Autonomous Region, China, using Google Earth Engine and time-series active and passive remote sensing images[J]. Remote Sensing for Natural Resources, 2025 , 37(2) : 235 -245 . DOI: 10.6046/zrzyyg.2023370
表1 多源遥感数据集Tab.1 Multi-source remote sensing data |
| 年份 | 传感器 | 影像数 | 影像分辨率/m | 影像筛选日期 | |
|---|---|---|---|---|---|
| 1985年 | Landsat5 TM | 68 | 30 | 1984年5月30日—1989年10月30日 | |
| 1995年 | Landsat5 TM | 46 | 30 | 1994年1月1日—1995年12月31日 | |
| 2005年 | Landsat7 ETM+ | 108 | 15/30 | 2000年1月1日—2003年12月31日 | |
| L-band PALSAR/PALSAR-2 | 1 | 25 | 2007年1月1日—2007年12月31日 | ||
| 2015年 | Landsat8 OLI | 31 | 30 | 2015年1月1日—2015年12月31日 | |
| C-band Sentinel-1 GRD | 16 | 20 | 2015年1月1日—2015年12月1日 | ||
| 2019年 | Sentinel-2 MSI | 720 | 10/20 | 2019年1月1日—2019年12月1日 | |
| C-band Sentinel-1 GRD | 106 | 20 | 2019年1月1日—2019年12月1日 |
表2 研究区地物解译标志及其描述Tab.2 Interpretation signs and descriptions of ground objects in the study area |
| 地物类型 | 解译标志 | 描述 | ||
|---|---|---|---|---|
| Landsat影像 | Sentinel影像 | 雷达影像 | ||
| 建筑用地 | 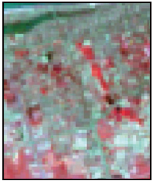 | 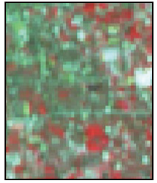 | 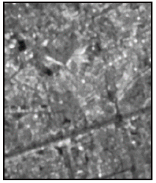 | 道路、城镇、沙地等,在标准假彩色中显示为灰白色、青绿色及亮白色,轮廓清晰且与周围地物分界明显 |
| 红树林 | 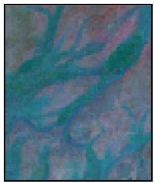 | 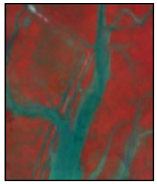 | 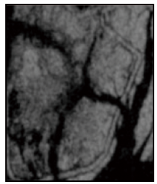 | 由密集分布的红树林群落组成,沿海岸带分布。在标准假彩色显示方案中,1985年、1995年Landsat5影像中的红树林主要表现为淡棕红色,2005—2019年影像中则主要表现为暗红色 |
| 水体 | 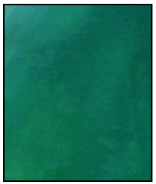 | 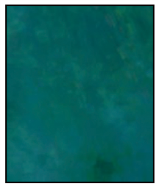 | 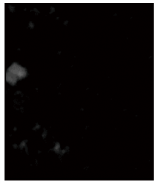 | 在标准假彩色中显示方案中,1985年、1995年海水为蓝绿色,2005—2019年海水为蓝色 |
| 海产养殖 | 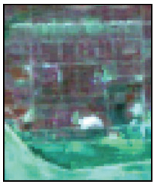 | 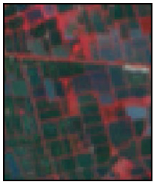 | 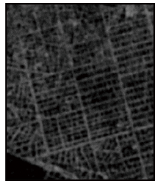 | 包括虾塘等养殖塘,有明显的轮廓边界,形状较规则 |
| 耕地 | 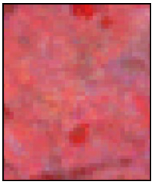 | 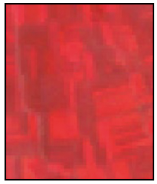 | 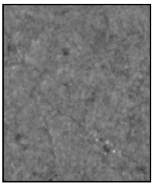 | 在标准假彩色中表现为淡红色,且主要分布于内陆,形状较规则 |
| 林地 | 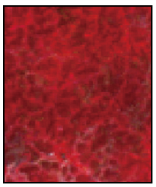 | 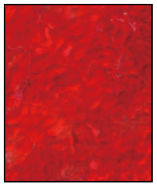 | 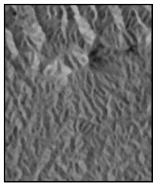 | 在标准假彩色中表现为比耕地更深的红色,且主要分布于内陆,时常与耕地相邻 |
| 滩涂 | 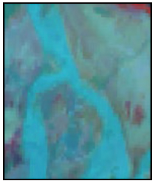 | 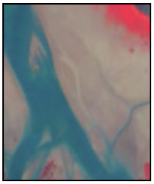 |  | 出现在沿岸海陆交汇区域,是红树林生长的沃土,在标准假彩色中表现为桃皮色 |
表3 各类型遥感指数计算公式Tab.3 Calculation formula of each type of remote sensing index |
| 序号 | 指数类型 | 计算公式① |
|---|---|---|
| 1 | 归一化植被指数 (normalized difference vegetation index, NDVI) | |
| 2 | 比值植被指数(ratio vegetation index, RVI) | |
| 3 | 差值植被指数(difference vegetation index, DVI) | |
| 4 | 增强植被指数(enhanced vegetation index, EVI) | |
| 5 | 校正植被指数(corrected transformed vegetation index, CTVI) | |
| 6 | 非线性指数(non-linear vegetation index, NLI) | |
| 7 | 改进简单比值指数(modified simple ratio, MSRNIR) | |
| 8 | 归一化水体指数(normalized difference water index, NDWI) | |
| 9 | 改进的归一化水体指数(modified normalized difference water index, MNDWI) | SWIR1(1.55~1.75 μm) SWIR2(2.08~2.35 μm) |
| 10 | 自动提取水体指数(automated water extraction index, AWEI) | |
| 11 | 归一化建筑指数(normalized difference built-up index, NDBI) | SWIR1(1.55~1.75 μm) SWIR2(2.08~2.35 μm) |
| 12 | 基于红边波段的改进简单比值指数(modified simple ratio, MSRRE1,MSRRE2) | RE1(703.9 nm) RE2(740.2 nm) |
| 13 | 基于红边波段的非线性指数(non-linear index, NLIRE1,NLIRE2) | RE1(703.9 nm) RE2(740.2 nm) |
| 14 | 基于红边波段的增强植被指数(enhanced vegetation index, EVIRE1,EVIRE2) | RE1(703.9 nm) RE2(740.2 nm) |
| 15 | 微波遥感指数HH/HV | PALSAR HH/HV |
| 16 | 微波遥感指数VV/VH | Sentinel-1 VV/VH |
①: 公式中NIR代表近红外波段,RED代表红光波段,BLUE代表蓝光波段,GREEN代表绿光波段,SWIR1代表1.55~1.75 μm波长范围的短波红外波段,SWIR2代表2.08~2.35 μm波长范围的短波红外波段,RE1代表703.9 nm波长的红边波段,RE2代表740.2 nm波长的红边波段。 |
表4 分类方案及多源遥感数据集Tab.4 Classification schemes and multi-source datasets |
| 年份 | 传感器 | 方案 | 变量数 | 多源数据集 |
|---|---|---|---|---|
| 1985年 | Landsat5 TM | 方案1 | 21 | 多光谱波段(6个波段)、各类遥感指数(植被指数、水体指数、建筑指数)、数字高程模型(digital elevation model,DEM)、非监督分类结果 |
| 方案2 | 55 | 多光谱波段(6个波段)、各类遥感指数(植被指数、水体指数、建筑指数)、DEM、非监督分类结果、B1(BLUE)波段纹理特征、B5(1.55~1.75 μm)波段纹理特征 | ||
| 1995年 | Landsat5 TM | 方案1 | 21 | 多光谱波段(6个波段)、各类遥感指数(植被指数、水体指数、建筑指数)、DEM、非监督分类结果 |
| 方案2 | 38 | 多光谱波段(6个波段)、各类遥感指数(植被指数、水体指数、建筑指数)、DEM、非监督分类结果、B5(1.55~1.75 μm)波段纹理特征 | ||
| 2005年 | Landsat7 ETM+ | 方案1 | 22 | 多光谱波段(7个波段)、各类遥感指数(13个)、DEM、非监督分类结果 |
| 方案2 | 25 | 多光谱波段(7个波段)、各类遥感指数(13个)、DEM、非监督分类结果、PALSAR/PALSAR-2 HH,HV,HH/HV | ||
| 方案3 | 42 | 多光谱波段(7个波段)、各类指数(13个)、DEM、非监督分类结果、HSV波段融合、B4(NIR)波段纹理特征 | ||
| 2015年 | Landsat8 OLI | 方案1 | 55 | 多光谱波段(7个波段)、各类遥感指数(13个)、DEM、非监督分类结果 |
| 方案2 | 25 | 多光谱波段(7个波段)、各类遥感指数(13个)、DEM、非监督分类结果、C-band Sentinel-1 GRD VV,VH,VV/VH | ||
| 方案3 | 42 | 多光谱波段(7个波段)、各类遥感指数(13个)、DEM、非监督分类结果、HSV波段融合、B7(2.11~2.29 μm)波段纹理特征 | ||
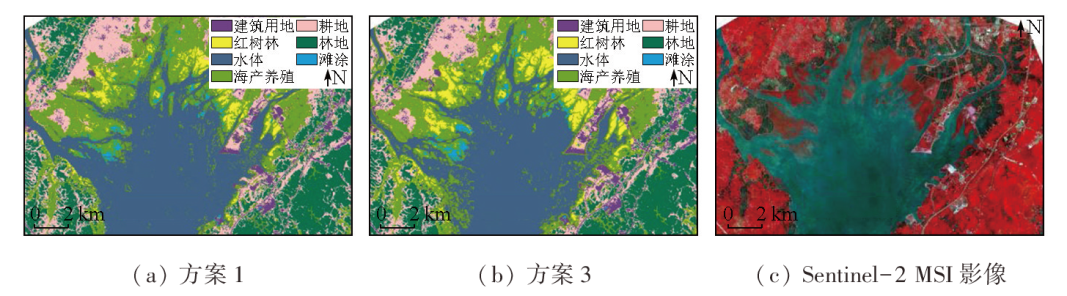
| 2019年 | Sentinel-2 MSI | 方案1 | 31 | 多光谱波段(10个波段)、各类遥感指数(16个)、DEM、非监督分类结果 |
| 方案2 | 34 | 多光谱波段(10个波段)、各类遥感指数(16个)、DEM、非监督分类结果、C-band Sentinel-1 GRD VV,VH,VV/VH | ||
| 方案3 | 50 | 多光谱波段(10个波段)、各类遥感指数(16个)、DEM、非监督分类结果、B5(703.9 nm)波段纹理特征(9个)、B8(NIR)波段纹理特征(10个) | ||
| 方案4 | 48 | 多光谱波段(10个波段)、各类遥感指数(16个)、DEM、非监督分类结果、B12(2 202.4 nm)波段纹理特征 |
表5 1985—2019年各分类方案总体分类精度及Kappa系数Tab.5 The overall classification accuracies and Kappa coefficient of different remote sensing data from 1985 to 2019 |
| 年份 | 方案 | Kappa系数 | 总体分类精度/% |
|---|---|---|---|
| 1985年 | 方案1 | 0.869 | 88.8 |
| 方案2 | 0.884 | 90.1 | |
| 1995年 | 方案1 | 0.761 | 80.0 |
| 方案2 | 0.853 | 87.7 | |
| 2005年 | 方案1 | 0.881 | 90.1 |
| 方案2 | 0.901 | 91.8 | |
| 方案3 | 0.908 | 92.3 | |
| 2015年 | 方案1 | 0.874 | 89.3 |
| 方案2 | 0.900 | 91.6 | |
| 方案3 | 0.907 | 92.1 | |
| 2019年 | 方案1 | 0.881 | 90.1 |
| 方案2 | 0.900 | 91.6 | |
| 方案3 | 0.956 | 96.3 | |
| 方案4 | 0.943 | 95.3 |
表6 1985—2019年研究区各类地物面积Tab.6 The area of land use types from 1985 to 2019 (km2) |
| 地类 | 1985年/km2 | 占比/% | 1995年/km2 | 占比/% | 2005年/km2 | 占比/% | 2015年/km2 | 占比/% |
|---|---|---|---|---|---|---|---|---|
| 建筑用地 | 142.79 | 3.12 | 184.49 | 4.03 | 203.19 | 4.44 | 483.43 | 10.55 |
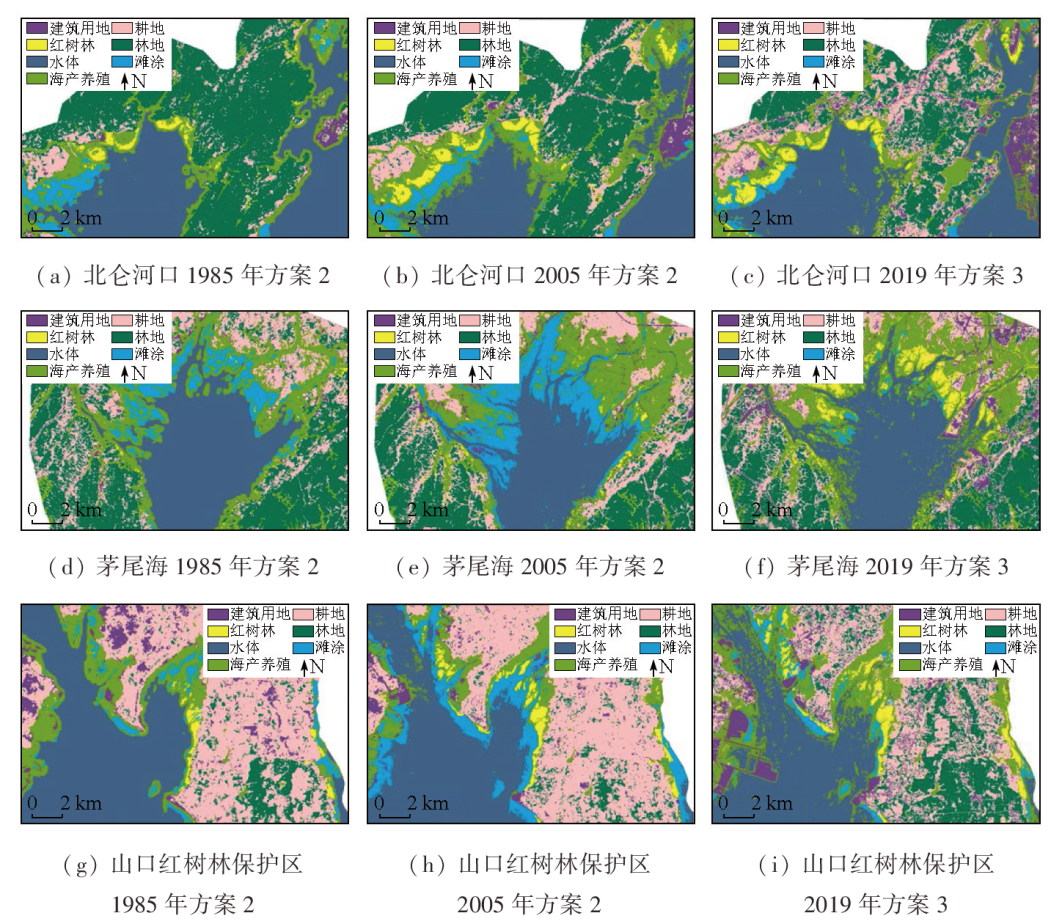
| 红树林 | 22.84 | 0.50 | 43.17 | 0.94 | 55.33 | 1.21 | 66.36 | 1.45 |
| 水体 | 1 613.01 | 35.21 | 1 579.58 | 34.48 | 1 501.06 | 32.77 | 1 561.20 | 34.08 |
| 海产养殖 | 546.25 | 11.92 | 565.92 | 12.35 | 628.85 | 13.73 | 608.80 | 13.29 |
| 耕地 | 1 201.92 | 26.24 | 1 505.52 | 32.86 | 1 326.87 | 28.96 | 1 090.14 | 23.80 |
| 林地 | 886.90 | 19.36 | 531.07 | 11.59 | 587.27 | 12.82 | 569.34 | 12.43 |
| 滩涂 | 167.38 | 3.65 | 171.34 | 3.74 | 278.52 | 6.08 | 201.82 | 4.41 |
| 总计 | 4 581.09 | 100.00 | 4 581.09 | 100.00 | 4 581.09 | 100.00 | 4 581.09 | 100.00 |
表7 1985—2019年各土地利用类型年变化率Tab.7 Annual change rates of land use types from 1985 to 2019 (%) |
| 地类 | 1985— 1995 | 1995— 2005 | 2005— 2015 | 2015— 2019 | 1985— 2019 |
|---|---|---|---|---|---|
| 建筑用地 | 2.92 | 1.01 | 13.79 | -0.33 | 6.50 |
| 红树林 | 8.90 | 2.82 | 1.99 | 1.11 | 6.36 |
| 水体 | -0.21 | -0.50 | -0.40 | 0.12 | -0.06 |
| 海产养殖 | 0.36 | 1.11 | -0.32 | 1.29 | 0.74 |
| 耕地 | 2.53 | -1.19 | -1.78 | -0.67 | -0.44 |
| 林地 | -4.01 | 1.06 | -0.31 | 1.33 | -0.78 |
| 滩涂 | 0.24 | 6.26 | -2.75 | -4.53 | -0.97 |
| [1] |
卢元平, 徐卫华, 张志明, 等. 中国红树林生态系统保护空缺分析[J]. 生态学报, 2019, 39(2):684-691.
|
| [2] |
李想, 刘凯, 朱远辉, 等. 基于资源三号影像的红树林物种分类研究[J]. 遥感技术与应用, 2018, 33(2):360-369.
|
| [3] |
|
| [4] |
孙永光, 赵冬至, 郭文永, 等. 红树林生态系统遥感监测研究进展[J]. 生态学报, 2013, 33(15):4523-4538.
|
| [5] |
|
| [6] |
何斌源, 范航清, 王瑁, 等. 中国红树林湿地物种多样性及其形成[J]. 生态学报, 2007, 27(11):4859-4870.
|
| [7] |
|
| [8] |
|
| [9] |
|
| [10] |
Food and Agriculture Organization of the United Nations (FAO). The World’s Mangroves 1980-2005[Z]. Roman,Italy, 2007.
|
| [11] |
|
| [12] |
|
| [13] |
|
| [14] |
蒙良莉, 凌子燕, 蒋卫国, 等. 基于Sentinel遥感数据的红树林信息提取研究——以广西茅尾海为例[J]. 地理与地理信息科学, 2020, 36(4):41-47.
|
| [15] |
周振超, 李贺, 黄翀, 等. 红树林遥感动态监测研究进展[J]. 地球信息科学学报, 2018, 20(11):1631-1643.
|
| [16] |
|
| [17] |
徐逸, 甄佳宁, 蒋侠朋, 等. 无人机遥感与XGBoost的红树林物种分类[J]. 遥感学报, 2021, 25(3):737-752.
|
| [18] |
甄佳宁, 廖静娟, 沈国状. 1987以来海南省清澜港红树林变化的遥感监测与分析[J]. 湿地科学, 2019, 17(1):44-51.
|
| [19] |
李春干, 代华兵. 红树林空间分布信息遥感提取方法[J]. 湿地科学, 2014, 12(5):580-589.
|
| [20] |
|
| [21] |
|
| [22] |
|
| [23] |
|
| [24] |
沈小雪, 关淳雅, 王茜, 等. 红树林生态开发现状与对策研究[J]. 中国环境科学, 2020, 40(9):4004-4016.
|
| [25] |
|
| [26] |
|
/
| 〈 |
|
〉 |