
Remote Sensing for Natural Resources >
Unsupervised change detection using SAR images based on the broad learning system
Received date: 2023-11-03
Revised date: 2024-02-05
Online published: 2026-06-03
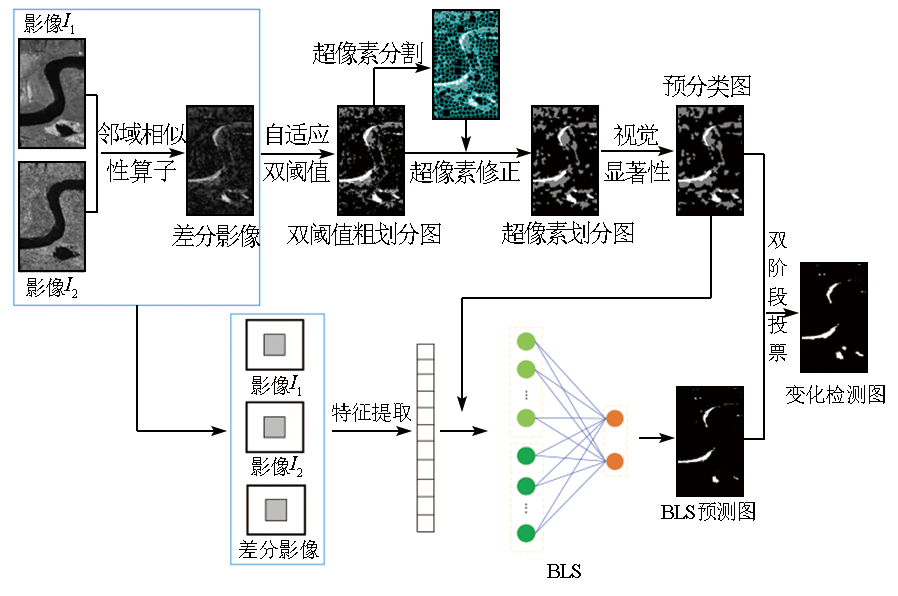
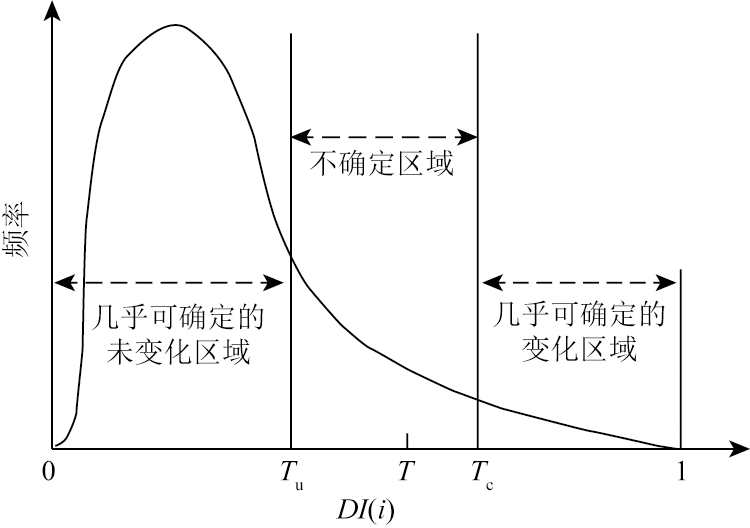
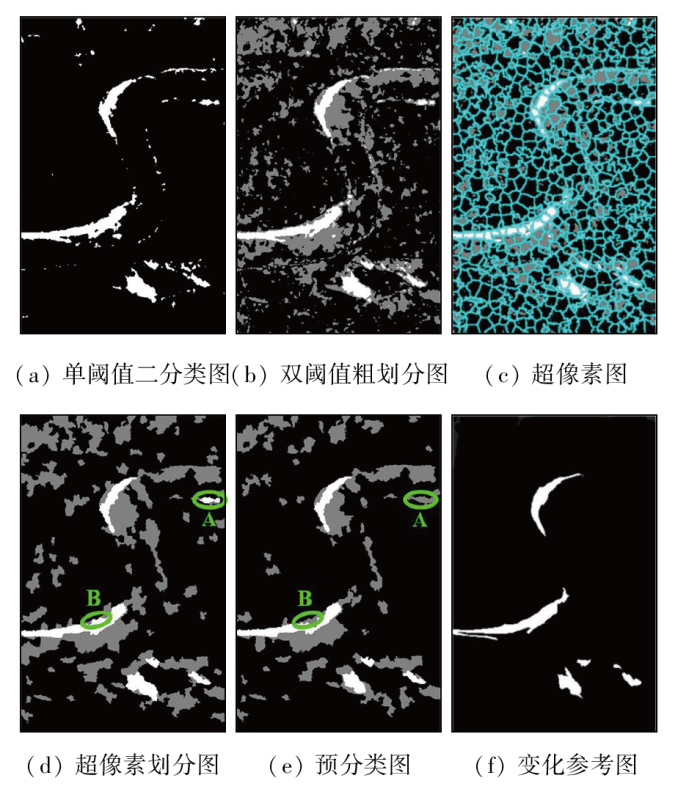
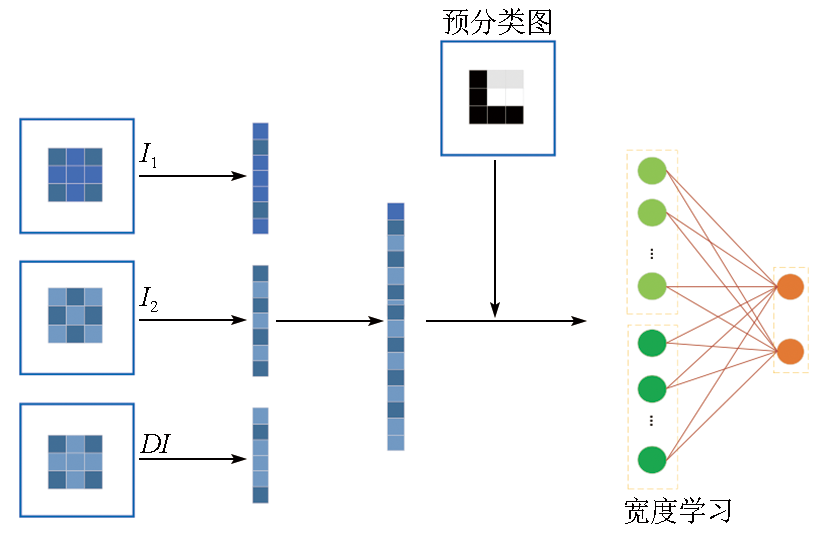
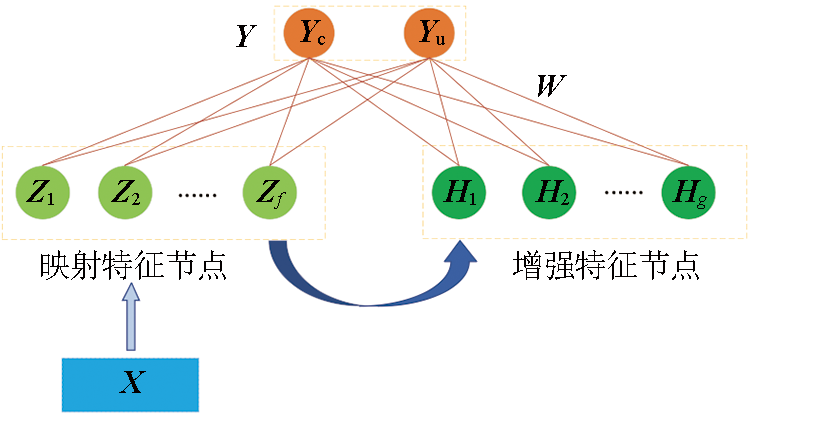
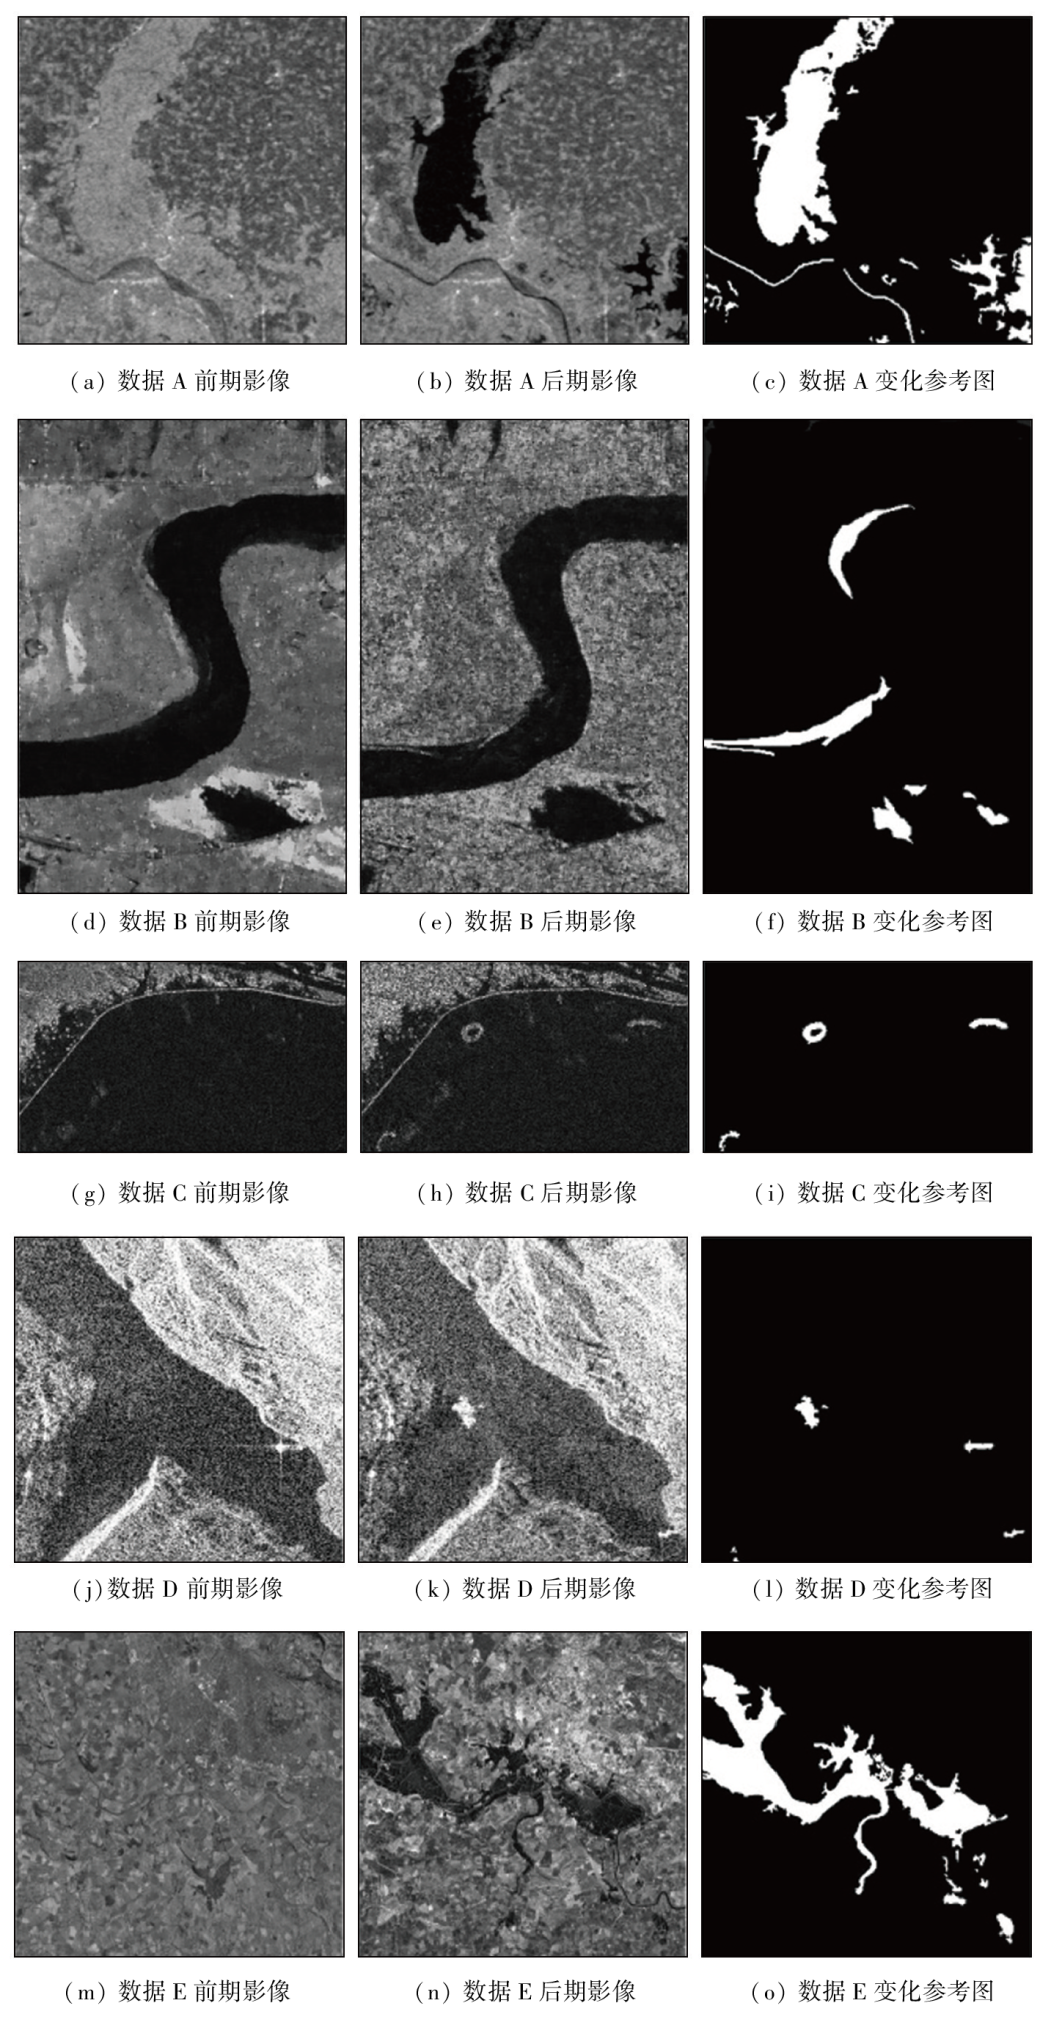
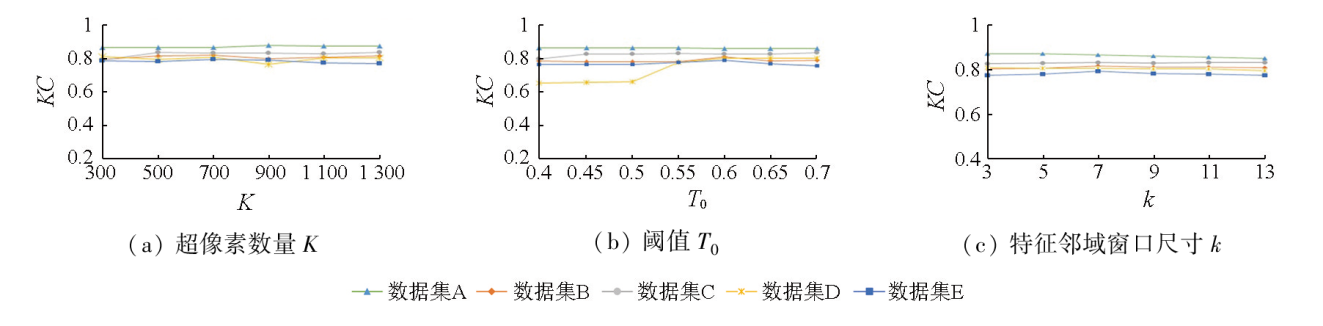
Change detection using synthetic aperture radar (SAR) images based on deep learning has been a significant research topic in the field of remote sensing. However, it is limited by unreliable training samples and highly time-consuming training. Hence, this study proposed a novel unsupervised change detection method using SAR images based on the broad learning system (BLS). First, a reliable pre-classification method is presented by incorporating neighborhood information into similarity operators, adaptive dual-threshold segmentation, superpixel correction, and visual saliency analysis. This pre-classification method generates a pre-classification map and corresponding training samples. Second, the BLS network is trained using the training samples to generate the BLS-based prediction map for change detection. Third, the pre-classification map and the BLS-based prediction map are fused through two-stage voting to generate the final change detection map. The experimental results of five real SAR image datasets show that the proposed method can produce more reliable training samples and achieve higher accuracy in change detection. Moreover, its efficiency is significantly higher than the change detection model using SAR images based on deep learning.
SHAO Pan , GUAN Zongsheng , JIA Fuwen . Unsupervised change detection using SAR images based on the broad learning system[J]. Remote Sensing for Natural Resources, 2025 , 37(2) : 19 -29 . DOI: 10.6046/zrzyyg.2023333
表1 不同方法在5组数据上的变化检测结果Tab.1 Change detection results of different methods on five datasets |
| 数据集 | PCAKM | GaborTLC | ELM | PCANet | CWNN | RUSACD | BLS | 变化参考图 |
|---|---|---|---|---|---|---|---|---|
| A |  |  |  |  | 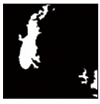 |  | 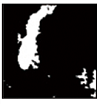 | 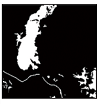 |
| B |  | 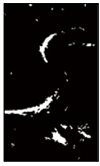 |  | 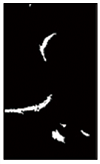 | 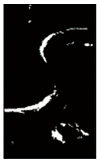 |  |  |  |
| C | 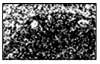 | 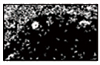 | 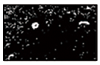 | 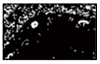 | 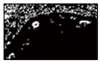 |  |  |  |
| D | 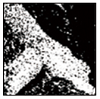 |  |  |  |  |  |  | 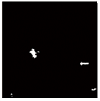 |
| E | 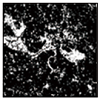 | 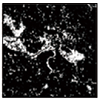 | 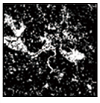 | 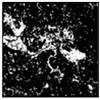 | 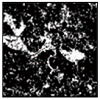 | 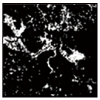 | 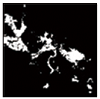 |  |
表2 5组数据集上变化检测图的精度指标Tab.2 Accuracy indicators of change detetion maps on 5 datasets |
| 数据 集 | 方法 | FA | MD | OE | KC | IoU |
|---|---|---|---|---|---|---|
| A | PCAKM | 27 | 4 311 | 4 338 | 0.780 1 | 0.675 9 |
| GaborTLC | 5 | 4 881 | 4 886 | 0.747 3 | 0.634 6 | |
| ELM | 9 | 4 801 | 4 810 | 0.752 0 | 0.641 9 | |
| PCANet | 2 | 4 717 | 4 719 | 0.757 3 | 0.647 0 | |
| CWNN | 34 | 3 946 | 3 980 | 0.801 1 | 0.692 2 | |
| RUSACD | 8 | 4 806 | 4 814 | 0.751 7 | 0.640 1 | |
| BLS | 307 | 2 532 | 2 839 | 0.866 1 | 0.792 4 | |
| B | PCAKM | 1 602 | 633 | 2 235 | 0.754 0 | 0.616 7 |
| GaborTLC | 1 863 | 704 | 2 567 | 0.724 3 | 0.580 4 | |
| ELM | 708 | 1 176 | 1 884 | 0.758 2 | 0.620 3 | |
| PCANet | 641 | 1 235 | 1 876 | 0.755 6 | 0.616 8 | |
| CWNN | 1 163 | 695 | 1 858 | 0.785 6 | 0.657 0 | |
| RUSACD | 538 | 1 164 | 1 702 | 0.777 4 | 0.644 9 | |
| BLS | 824 | 706 | 1 530 | 0.816 5 | 0.698 8 | |
| C | PCAKM | 41 573 | 7 | 41 580 | 0.040 7 | 0.031 2 |
| GaborTLC | 22 024 | 4 | 22 026 | 0.090 1 | 0.045 8 | |
| ELM | 6 199 | 25 | 6 224 | 0.258 6 | 0.175 5 | |
| PCANet | 12 826 | 12 | 12 838 | 0.155 7 | 0.094 2 | |
| CWNN | 13 217 | 50 | 13 267 | 0.146 8 | 0.089 1 | |
| RUSACD | 239 | 176 | 415 | 0.849 7 | 0.741 1 | |
| BLS | 280 | 182 | 462 | 0.832 8 | 0.716 2 | |
| D | PCAKM | 65 783 | 41 | 65 824 | 0.016 6 | 0.008 7 |
| GaborTLC | 33 520 | 80 | 33 600 | 0.041 6 | 0.016 2 | |
| ELM | 36 336 | 112 | 36 448 | 0.035 7 | 0.024 4 | |
| PCANet | 45 968 | 48 | 46 016 | 0.028 9 | 0.020 1 | |
| CWNN | 17 072 | 384 | 17 456 | 0.055 7 | 0.034 7 | |
| RUSACD | 288 | 256 | 544 | 0.714 1 | 0.557 5 | |
| BLS | 181 | 208 | 389 | 0.806 5 | 0.677 4 | |
| E | PCAKM | 430 724 | 172 693 | 603 417 | 0.520 7 | 0.424 0 |
| GaborTLC | 231 003 | 212 652 | 443 655 | 0.590 4 | 0.476 7 | |
| ELM | 444 164 | 175 766 | 619 930 | 0.513 4 | 0.416 1 | |
| PCANet | 370 534 | 171 819 | 542 353 | 0.553 8 | 0.450 7 | |
| CWNN | 498 038 | 150 816 | 648 854 | 0.510 1 | 0.418 0 | |
| RUSACD | 214 101 | 251 318 | 465 419 | 0.553 5 | 0.435 9 | |
| BLS | 36 699 | 163 666 | 200 365 | 0.794 8 | 0.693 4 |
表3 不同方法在5组数集据上的运行时间Tab.3 The computation times of different methods on 5 datasets (s) |
| 方法 | 数据集 | ||||
|---|---|---|---|---|---|
| A | B | C | D | E | |
| PCAKM | 1.1 | 0.93 | 0.97 | 1.03 | 18.45 |
| GaborTLC | 2.38 | 4.12 | 6.02 | 6.72 | 1.8×10² |
| ELM | 9.03 | 13.66 | 12.03 | 15.26 | 4.54×10² |
| PCANet | 5.06×10² | 7.84×10² | 1.04×10³ | 1.36×10³ | 1.09×10⁵ |
| CWNN | 5.14×10² | 6.57×10² | 6.77×10² | 7.02×10² | 8.96×10³ |
| RUSACD | 2.87×10² | 3.57×10² | 3.39×10² | 3.71×10² | 1.63×10⁴ |
| BLS | 14.65 | 19.77 | 13.92 | 16.23 | 6.15×10² |
表4 不同方法获取“伪标记样本”的KC值Tab.4 KC values of “pseudolabel samples” of different methods |
| 方法 | 数据集 | ||||
|---|---|---|---|---|---|
| A | B | C | D | E | |
| ELM | 0.801 4 | 0.862 1 | 0.205 3 | 0.045 4 | 0.617 7 |
| PCANet | 0.809 3 | 0.885 1 | 0.144 3 | 0.039 1 | 0.671 1 |
| CWNN | 0.822 2 | 0.868 4 | 0.184 1 | 0.076 2 | 0.647 9 |
| RUSACD | 0.713 1 | 0.760 7 | 0.920 0 | 0.907 1 | 0.564 8 |
| BLS | 0.904 2 | 0.876 6 | 0.877 4 | 0.913 7 | 0.817 2 |
表5 不同方法的KC值Tab.5 KC values of different methods |
| 方法 | 数据集 | ||||
|---|---|---|---|---|---|
| A | B | C | D | E | |
| ELM* | 0.873 8 | 0.677 8 | 0.819 2 | 0.580 3 | 0.656 5 |
| PCANet* | 0.675 2 | 0.792 7 | 0.823 3 | 0.813 2 | 0.633 5 |
| CWNN* | 0.780 1 | 0.809 5 | 0.841 1 | 0.647 9 | 0.723 1 |
| RUSACD* | 0.795 4 | 0.786 9 | 0.849 7 | 0.791 6 | 0.717 3 |
| BLS | 0.866 1 | 0.816 5 | 0.832 8 | 0.806 5 | 0.794 8 |
本文中实验受到三峡大学先进计算中心算力支持!
| [1] |
|
| [2] |
|
| [3] |
|
| [4] |
|
| [5] |
|
| [6] |
|
| [7] |
|
| [8] |
|
| [9] |
王建明, 史文中, 邵攀. 自适应距离和模糊拓扑优化的模糊聚类SAR影像变化检测[J]. 测绘学报, 2018, 47(5):611-619.
|
| [10] |
公茂果, 苏临之, 李豪, 等. 合成孔径雷达影像变化检测研究进展[J]. 计算机研究与发展, 2016, 53(1):123-137.
|
| [11] |
|
| [12] |
|
| [13] |
|
| [14] |
|
| [15] |
|
| [16] |
|
| [17] |
|
| [18] |
邵攀. 非监督遥感变化检测模糊方法研究[D]. 武汉: 武汉大学, 2016.
|
| [19] |
|
| [20] |
|
| [21] |
|
| [22] |
|
| [23] |
宋熙煜, 周利莉, 李中国, 等. 图像分割中的超像素方法研究综述[J]. 中国图象图形学报, 2015, 20(5):599-608.
|
| [24] |
袁巧, 程艳芬, 陈先桥. 多先验特征与综合对比度的图像显著性检测[J]. 中国图象图形学报, 2018, 23(2):239-248.
|
| [25] |
|
| [26] |
|
| [27] |
|
| [28] |
|
/
| 〈 |
|
〉 |