
Remote Sensing for Natural Resources >
Origin of surface substrate for soil salinization and alkalization in the Songnen Plain
Received date: 2023-10-31
Revised date: 2024-08-23
Online published: 2026-06-03
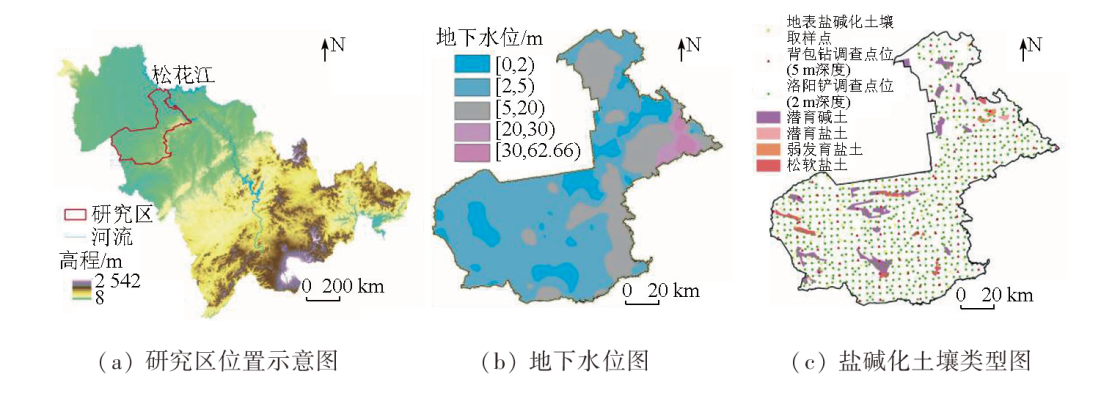
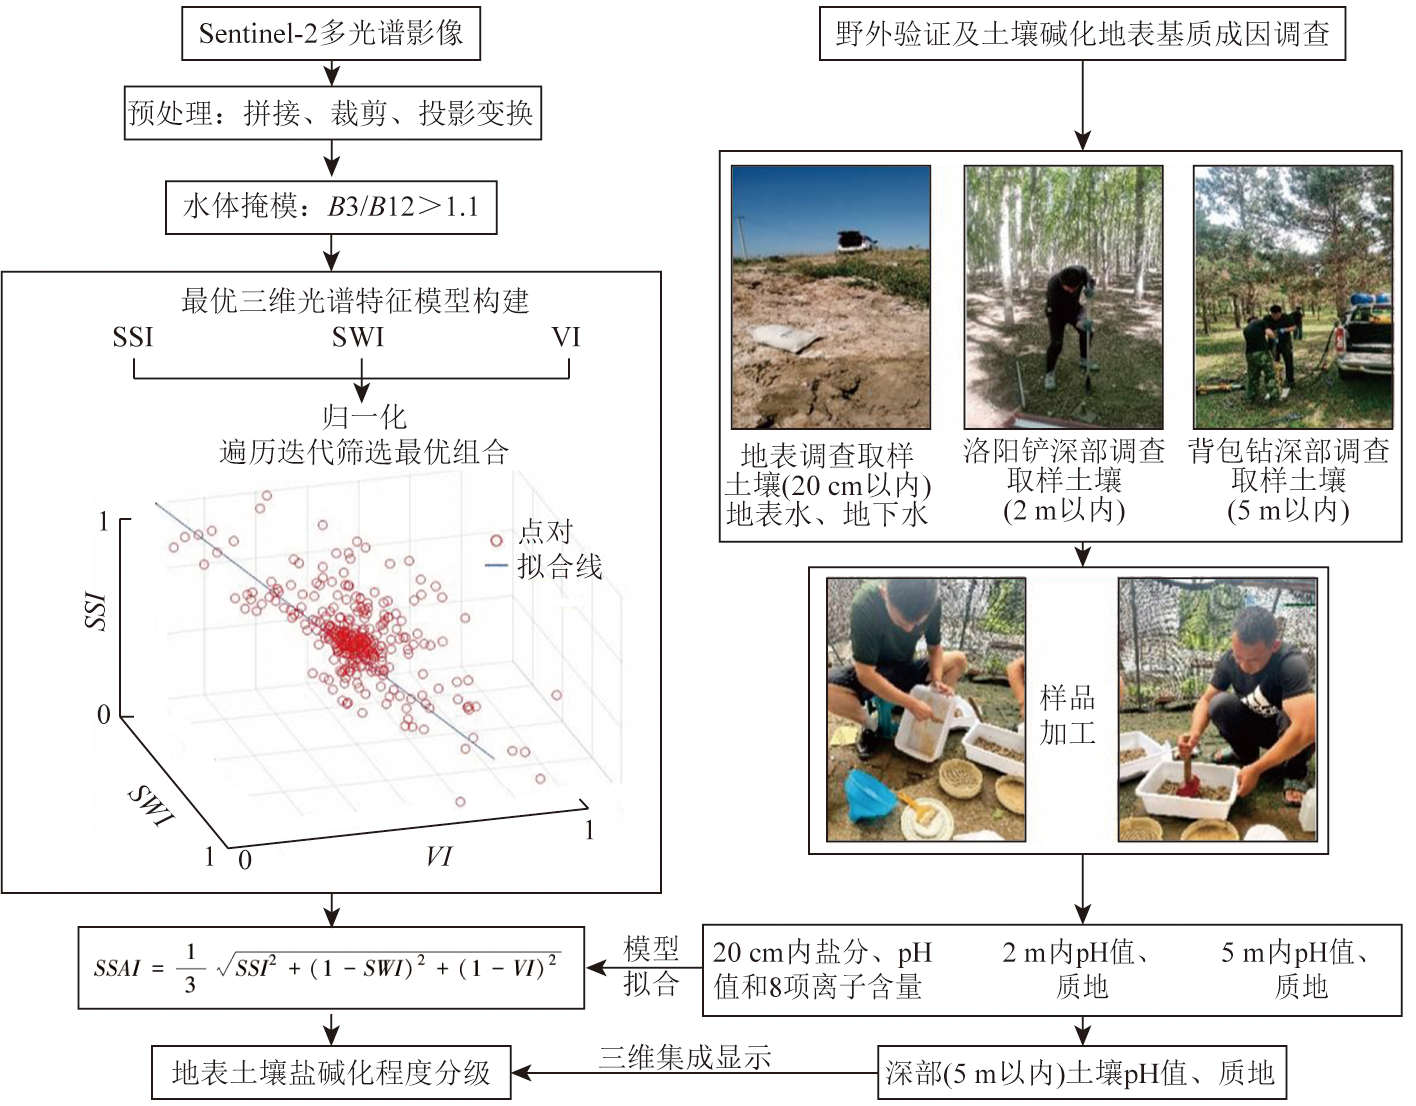
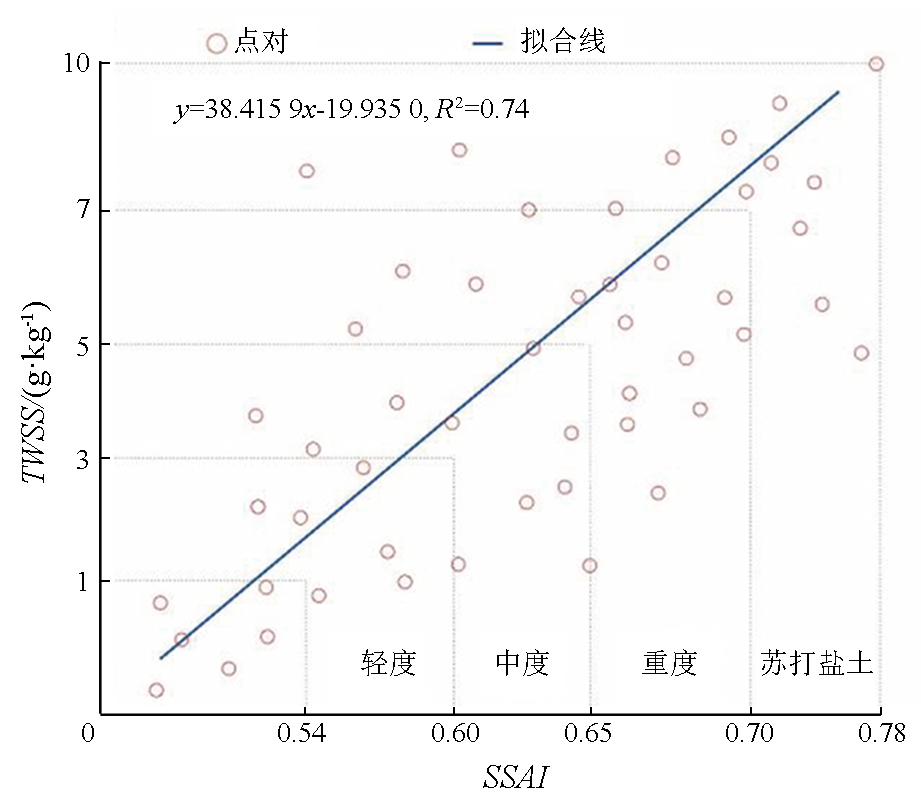
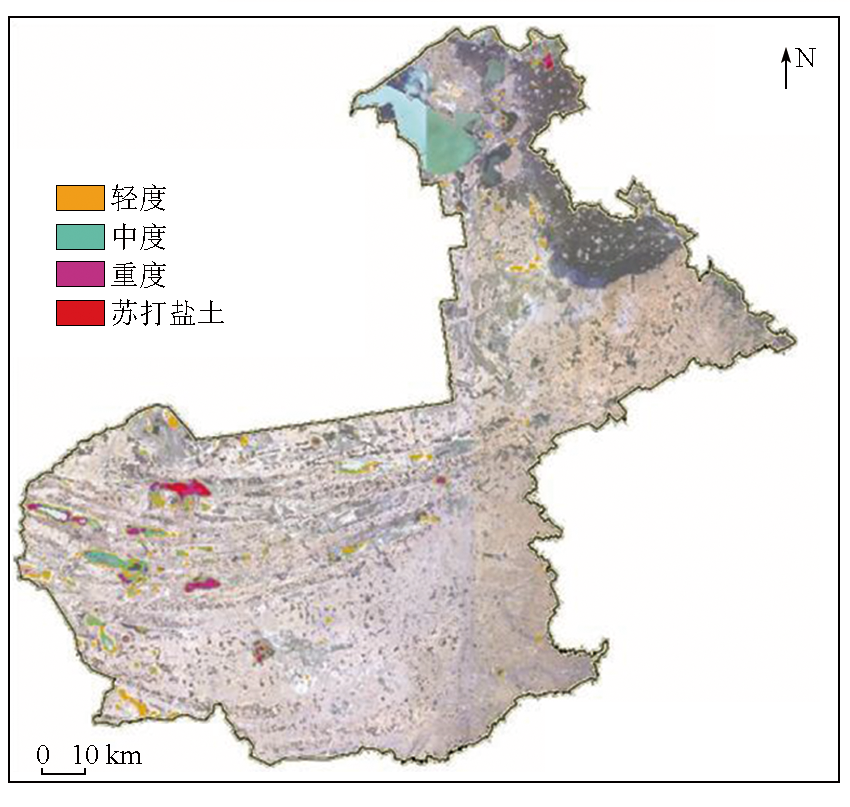
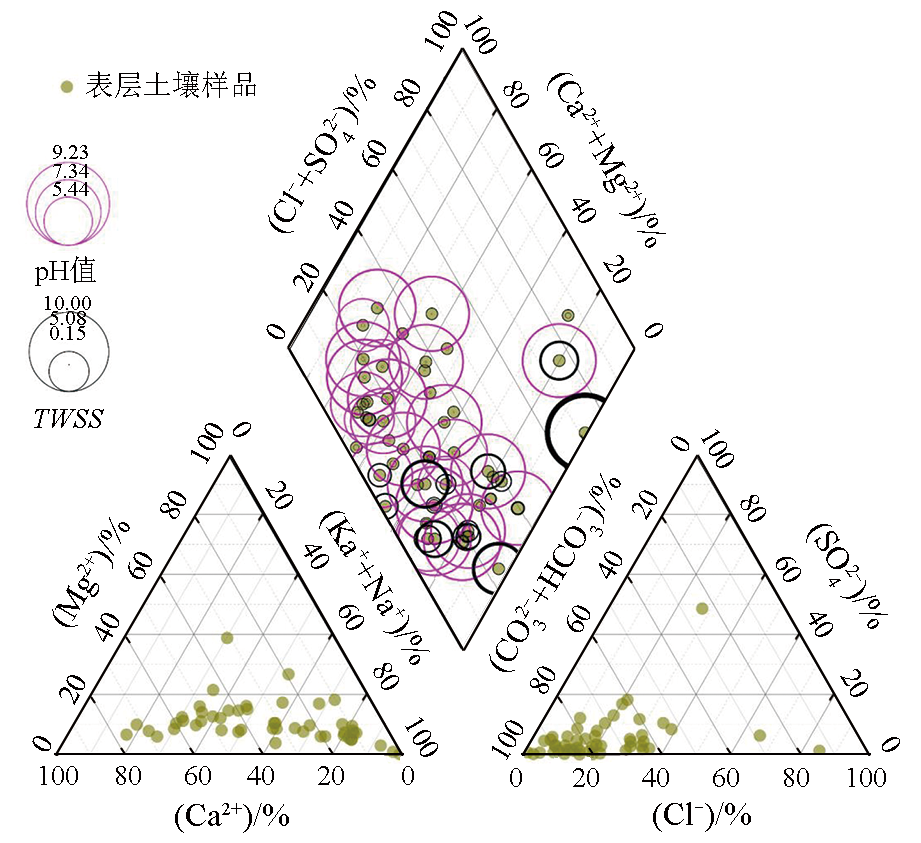
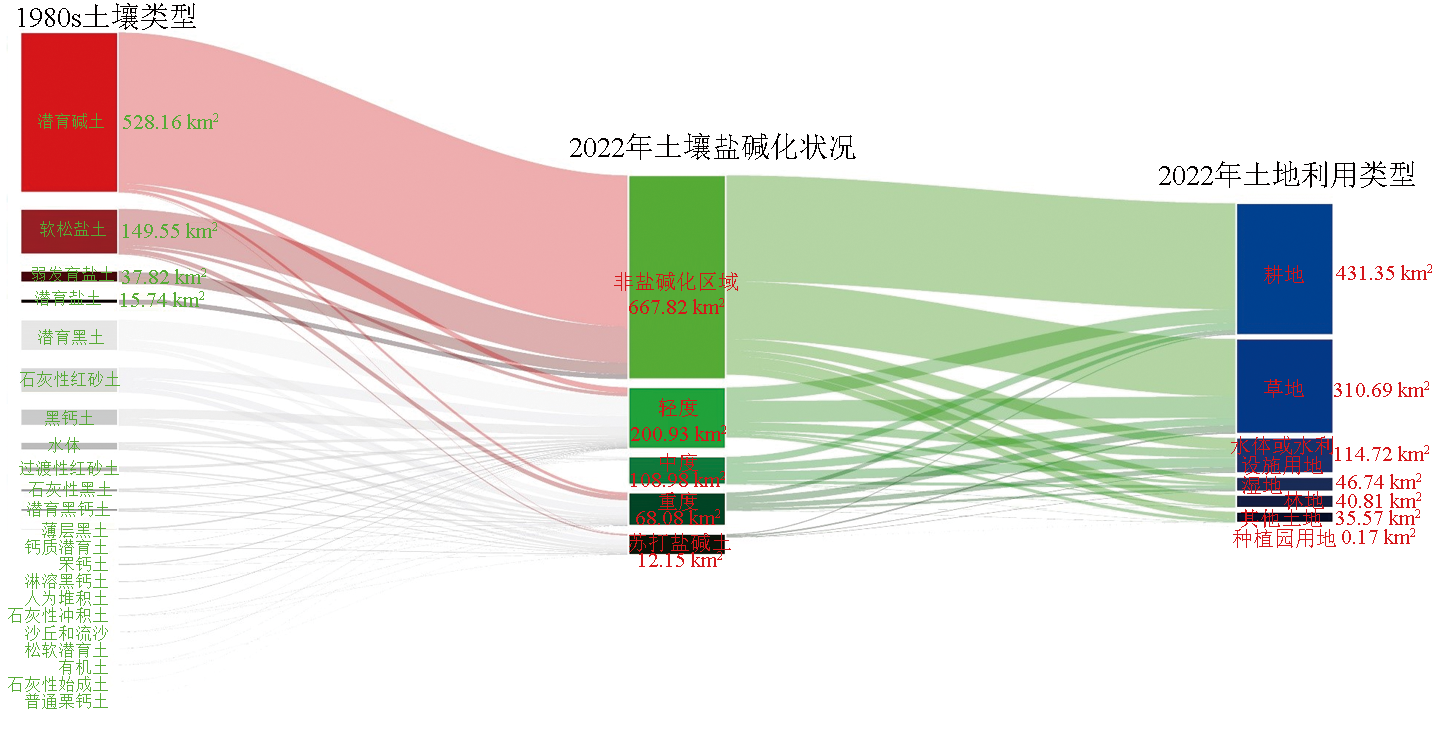
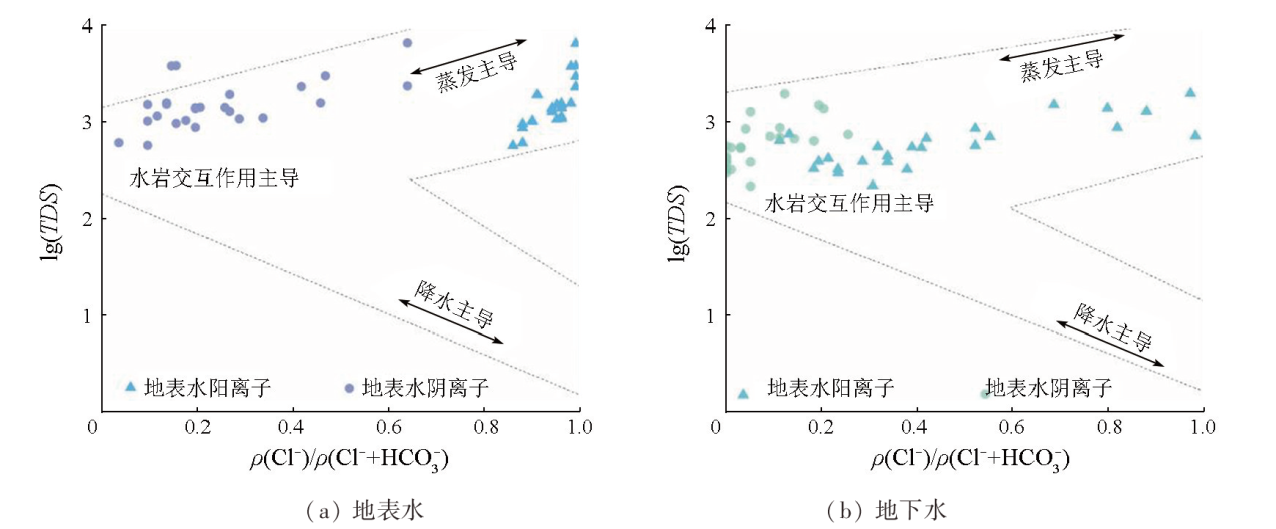
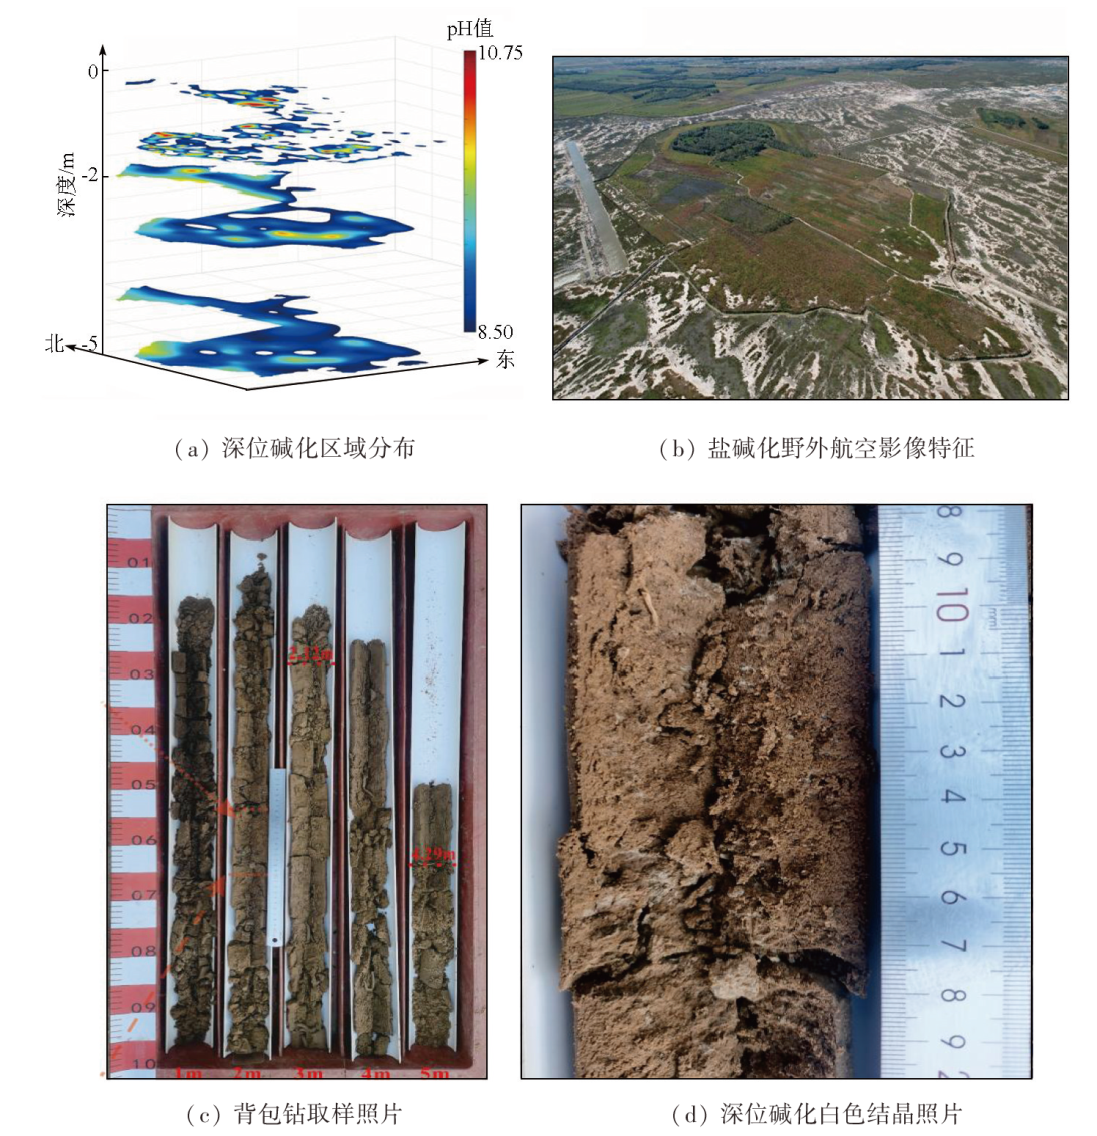
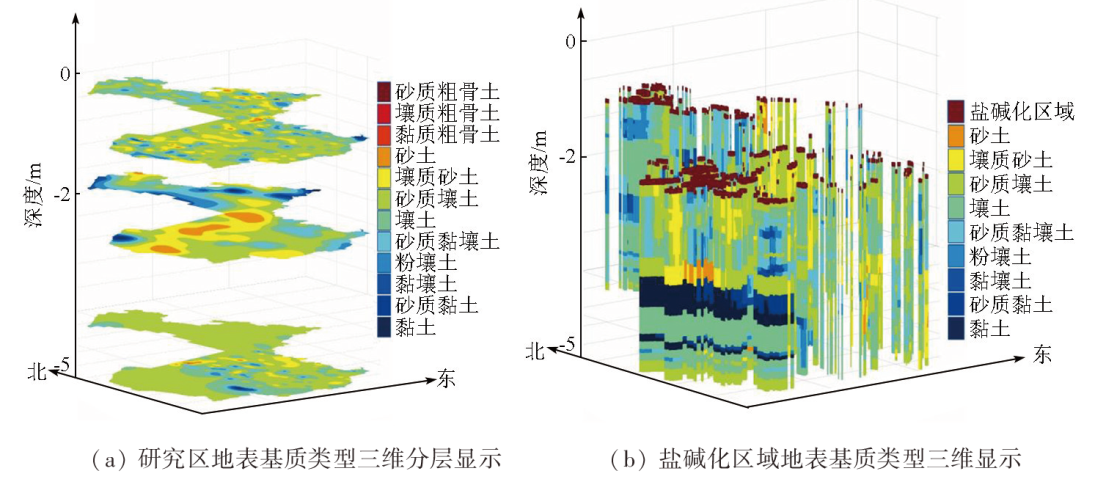
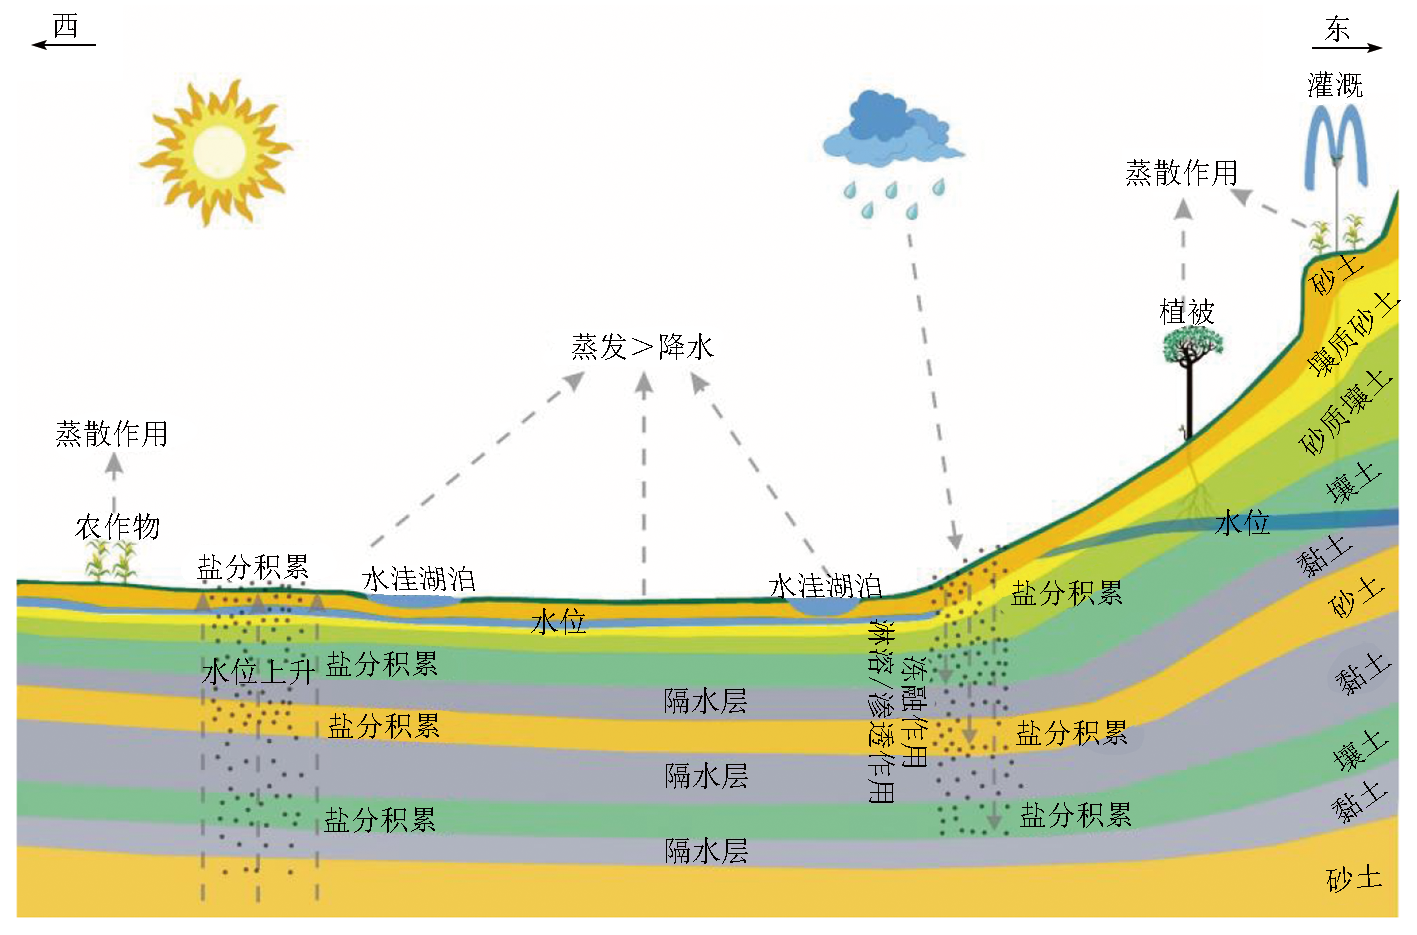
To determine the origin of surface substrate for soil salinization and alkalization in the Songnen Plain, this study investigated Songyuan City based on Sentinel-2 multispectral images. Considering various commonly used indices like the soil salinity index (SSI), soil water index (SWI), and vegetation index (VI), this study constructed the optimal 3D spectral feature model to calculate the soil salinization-alkalization index (SSAI) for inversion of the soil salinization-alkalization status. Surface water and groundwater in areas subjected to soil salinization and alkalization were sampled to test their salt ion concentrations, followed by the analysis of salt ion sources according to the groundwater levels. The surface substrate was explored through planar grid layout and vertical stratified sampling. A total of 2 362 soil samples were collected in various layers within a depth of 5 m to test their pH and texture for the construction of a 3D surface substrate model. The results of this study reveal a positive linear correlation between the inversion result of remote sensing data and the topsoil salt content (coefficient of determination: R2=0.74). The study area was characterized by alkalization of sodium bicarbonate, with soil salt ions originating primarily from groundwater. The deep multilayer argillaceous soils acted as an aquiclude to prevent the downward infiltration, migration, and dilution of salt ions along with water. This surface substrate condition serves as the objective cause of soil salinization and alkalization in the study area.
MA Min , ZUO Zhen , HAN Yandong , QIU Ye , QIAO Mudong . Origin of surface substrate for soil salinization and alkalization in the Songnen Plain[J]. Remote Sensing for Natural Resources, 2025 , 37(2) : 128 -139 . DOI: 10.6046/zrzyyg.2023330
表1 Sentinel-2多光谱传感器波段介绍Tab.1 Spectral bands of Sentinel-2 MSI sensor |
| 波段序号 | 名称 | 中心波长/μm | 空间分辨率/m |
|---|---|---|---|
| B1 | 海岸 | 0.443 | 60 |
| B2 | 蓝光 | 0.490 | 10 |
| B3 | 绿光 | 0.560 | 10 |
| B4 | 红光 | 0.665 | 10 |
| B5 | 红边1 | 0.705 | 20 |
| B6 | 红边2 | 0.740 | 20 |
| B7 | 红边3 | 0.783 | 20 |
| B8 | 近红外 | 0.842 | 10 |
| B8A | 植被红边 | 0.865 | 20 |
| B9 | 水蒸气 | 0.945 | 60 |
| B10 | 短波红外卷云 | 1.375 | 60 |
| B11 | 短波红外1 | 1.610 | 20 |
| B12 | 短波红外2 | 2.190 | 20 |
表2 常用的遥感土壤盐分光谱指数(SSI)Tab.2 The commonly used soil salinity index by remote sensing |
| 序号 | 名称 | 公式 | 参考文献 |
|---|---|---|---|
| 1 | 归一化土壤盐分指数NDSI | NDSI=(B4-B8)/(B4+B8) | [33-36] |
| 2 | 近红外-短波红外盐分指数NSI | NSI=(B11-B12)/(B11+B8) | [37] |
| 3 | ASTER盐分指数ASTER_SI | ASTER_SI=(B11-B12)/(B11+B12) | [31,38 -39] |
| 4 | 增强型盐分指数ESI | ESI=2.5(B4-B8)/(B8+6B4-7.5B2+1) | [40] |
| 5 | 盐分指数SI1 | SI1=(B4+B3)/2 | [39,41] |
| 6 | 盐分强度指数II1 | II1=(B8+B4+B3)/3 | [39,41] |
| 7 | 盐分指数SI-T | SI-T=(B4/B8)·100 | [42] |
| 8 | 波段比值盐分指数BRSI1 | BRSI1=B2/B3 | [42] |
| 9 | 波段比值盐分指数BRSI2 | BRSI2=B2/B4 | [34,41 -44] |
| 10 | 波段比值盐分指数BRSI3 | BRSI3=B2/B8 | [42] |
| 11 | 波段比值盐分指数BRSI4 | BRSI4=B3/B4 | [42] |
| 12 | 波段比值盐分指数BRSI5 | BRSI5=B3/B8 | [42] |
| 13 | 波段比值盐分指数BRSI6 | BRSI6=B4·B3/B2 | [34,43 -44] |
| 14 | 波段比值盐分指数BRSI7 | BRSI7=B4·B2/B3 | [34,42 -43] |
| 15 | 波段比值盐分指数BRSI8 | BRSI8= (B2-B4)/(B2+B4) | [34,43] |
| 16 | 波段比值盐分指数BRSI9 | BRSI9=B11·B4/B3 | [45] |
| 17 | 波段比值盐分指数BRSI10 | BRSI10= (B2-B12)/(B2+B12) | [45] |
| 18 | 波段比值盐分指数BRSI11 | BRSI11=B11/B12 | [34,39,42] |
| 19 | 波段比值盐分指数BRSI12 | BRSI12= (B4-B11)/(B4+B11) | [34] |
| 20 | 表层土壤盐分指数SSSI1 | SSSI1=B11-B12 | [31] |
| 21 | 表层土壤盐分指数SSSI2 | SSSI2=(B11·B12-B12·B12)/B11 | [31] |
| 22 | 盐分强度指数II2 | II2= | [34,39,41 -42] |
| 23 | 盐分强度指数II3 | II3= | [34,39,41 -42] |
| 24 | 盐分亮度指数BI1 | BI1= | [33,41 -42] |
| 25 | 盐分亮度指数BI2 | BI2= | [39,42] |
| 26 | 盐分亮度指数BI3 | BI3= | [31] |
| 27 | 盐分指数SI2 | SI2= | [31,33 -34,42 -43] |
| 28 | 盐分指数SI3 | SI3= | [33-34,39,41 -42,46] |
| 29 | 盐分指数SI4 | SI4= | [42] |
表3 常用的遥感土壤水分光谱指数(SWI)Tab.3 The commonly used soil water index by remote sensing |
| 序号 | 名称 | 公式 | 参考文献 |
|---|---|---|---|
| 1 | 缨帽变换土壤湿度指数TCS | TCS=0.150 9B2 + 0.197 3B3 + 0.327 3B4 + 0.340 6B8-0.711 2B11+0.457 3B12 | [47-48] |
| 2 | 归一化水分指数NDWI | NDWI=(B8-B11)/(B8+B11) | [40] |
| 3 | 短波红外变换反射指数STR | STR=0.5(1-B12)/B12 | [49] |
| 4 | 标准化多波段干旱指数NMDI | NMDI=B8-(B11 -B12)/B8+B11-B12 | [50] |
| 5 | 简单比值水分指数SRWI | SRWI=B8A/B11 | [51] |
| 6 | 陆表水分指数LSWI | LSWI=(B8A-B11)/(B8A+B11) | [52] |
表4 常用的遥感植被光谱指数(VI)Tab.4 The commonly used vegetation index by remote sensing |
| 序号 | 名称 | 公式① | 参考文献 |
|---|---|---|---|
| 1 | 归一化植被指数NDVI | NDVI=(B8-B4)/(B8+B4) | [39,41,44,46] |
| 2 | 环境植被指数EVI | EVI=2.5(B8-B4)/ (B8 +6B4-7.5B2 +1) | [39,46] |
| 3 | 土壤调节植被指数SAVI | SAVI=1.5(B8-B4)/ (B8+B4 +0.5) | [34,39,41,47,53] |
| 4 | 比值植被指数RVI | RVI=B8/B4 | [54] |
| 5 | 差值植被指数DVI | DVI=B8-B4 | [41] |
| 6 | 垂直植被指数PVI | PVI=[B8-(aB4 +b)]/ | [41,55] |
| 7 | 改进型土壤调节植被指数TSAVI | TSAVI=a[B8-(cB4+d)]/[B4+c(B8-d)+0.08(1+c2)] | [41,56] |
| 8 | 缨帽变换后的绿度指数TCG | TCG=-0.063 5B1-0.112 8B2-0.168 0B3-0.348 0B4-0.330 3B5+0.085 2B6+ 0.330 2B7+0.316 5B8+0.362 5B8A+0.046 7B9-0.457 8B11-0.406 4B12 | [57] |
| 9 | 冠层盐分响应指数CRSI | CRSI= | [42,46] |
①PVI和TSAVI中的a,b,c,d为拟合常数。 |
表6 地表水、地下水盐分离子含量统计表Tab.6 Statistics of the salt ions’ content in surface and underground water |
| 统计量 | 地表水 | 地下水 | ||||
|---|---|---|---|---|---|---|
| (mg·L-1) | (mg·L-1) | pH值 | (mg·L-1) | (mg·L-1) | pH值 | |
| 最大值 | 2 145.10 | 2 572.40 | 9.64 | 1 159.00 | 336.60 | 9.08 |
| 最小值 | 301.10 | 39.73 | 7.65 | 99.54 | 18.78 | 7.11 |
| 平均值 | 790.65 | 433.29 | 8.56 | 370.76 | 90.73 | 7.61 |
| [1] |
|
| [2] |
FAO. Global map of salt affected soils version 1.0[EB/OL]. [2023-10-17]. https://www.fao.org/soils-portal/data-hub/soil-maps-and-databases/global-map-of-salt-affected-soils/en/
|
| [3] |
|
| [4] |
刘兴土. 松嫩平原退化土地整治与农业发展[M]. 北京: 科学出版社, 2001: 15-350.
|
| [5] |
杨帆, 罗金明, 王志春, 等. 松嫩平原盐渍化区水盐转化规律与调控机理[M]. 北京: 中国环境出版社, 2014:15-201.
|
| [6] |
王遵亲. 中国盐渍土[M]. 北京: 科学出版社, 1993.
|
| [7] |
|
| [8] |
赵鹏敏, 贾政强. 东北平原西部盐碱地生态治理探析[J]. 东北水利水电, 2020, 38(5):47-49,72.
|
| [9] |
|
| [10] |
|
| [11] |
|
| [12] |
|
| [13] |
|
| [14] |
张琦林, 胡娟, 高英志, 等. 松嫩平原沙丘-草甸复合生态系统土壤水分和盐碱时空变化特征[J]. 中国农学通报, 2021, 37(20):49-58.
|
| [15] |
卢晶, 张绪教, 叶培盛, 等. 基于SI-MSAVI特征空间的河套灌区盐碱化遥感监测研究[J]. 国土资源遥感, 2020, 32(1):169-175.doi:10.6046/gtzyyg.2020.01.23.
|
| [16] |
张思源, 岳楚, 袁国礼, 等. 基于ENDVI-SI3特征空间的盐渍化反演模型及风险评估[J]. 自然资源遥感, 2022, 34(4):136-143.doi:10.6046/zrzyyg.2021349.
|
| [17] |
|
| [18] |
|
| [19] |
张殿发. GIS支持下的吉林西部平原土地盐碱化研究[D]. 长春: 长春科技大学, 2000.
|
| [20] |
林年丰,
|
| [21] |
方洪宾. 松辽平原第四纪地质环境与黑土退化[M]. 北京: 地质出版社, 2009.
|
| [22] |
|
| [23] |
|
| [24] |
|
| [25] |
|
| [26] |
汪景宽, 王铁宇, 张旭东, 等. 黑土土壤质量演变初探I——不同开垦年限黑土主要质量指标演变规律[J]. 沈阳农业大学学报, 2002, 33(1):43-47.
|
| [27] |
詹涛, 曾方明, 谢远云, 等. 东北平原钻孔的磁性地层定年及松嫩古湖演化[J]. 科学通报, 2019, 64(11):1179-1190.
|
| [28] |
FAO. Harmonized world soil database v12.[EB/OL]. [2024-03-13]. https://www.fao.org/soils-portal/soil-survey/soil-maps-and-databases/harmonized-world-soil-database-v12/en/
|
| [29] |
|
| [30] |
|
| [31] |
|
| [32] |
|
| [33] |
|
| [34] |
|
| [35] |
|
| [36] |
赵瑞, 崔希民, 刘超. GF-5高光谱遥感影像的土壤有机质含量反演估算研究[J]. 中国环境科学, 2020, 40(8):3539-3545.
|
| [37] |
|
| [38] |
|
| [39] |
|
| [40] |
|
| [41] |
|
| [42] |
|
| [43] |
|
| [44] |
|
| [45] |
|
| [46] |
|
| [47] |
|
| [48] |
|
| [49] |
|
| [50] |
|
| [51] |
|
| [52] |
|
| [53] |
|
| [54] |
|
| [55] |
|
| [56] |
|
| [57] |
|
| [58] |
|
| [59] |
|
| [60] |
|
| [61] |
|
| [62] |
|
| [63] |
|
/
| 〈 |
|
〉 |