
Remote Sensing for Natural Resources >
Spatiotemporal analysis of economy in China’s primary cities affected by the COVID-19 pandemic based on remote sensing of night light
Received date: 2023-08-28
Revised date: 2023-12-05
Online published: 2026-06-03
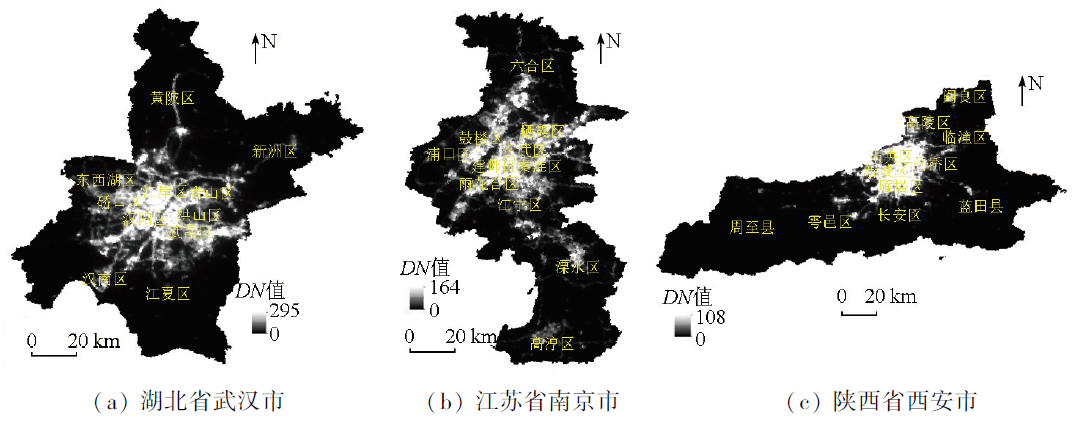
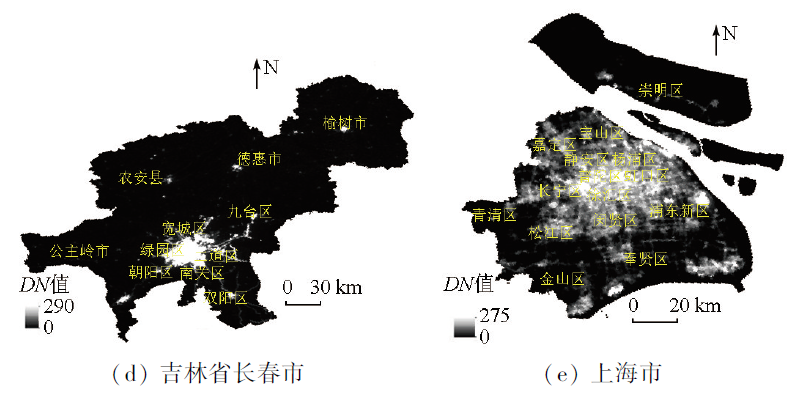
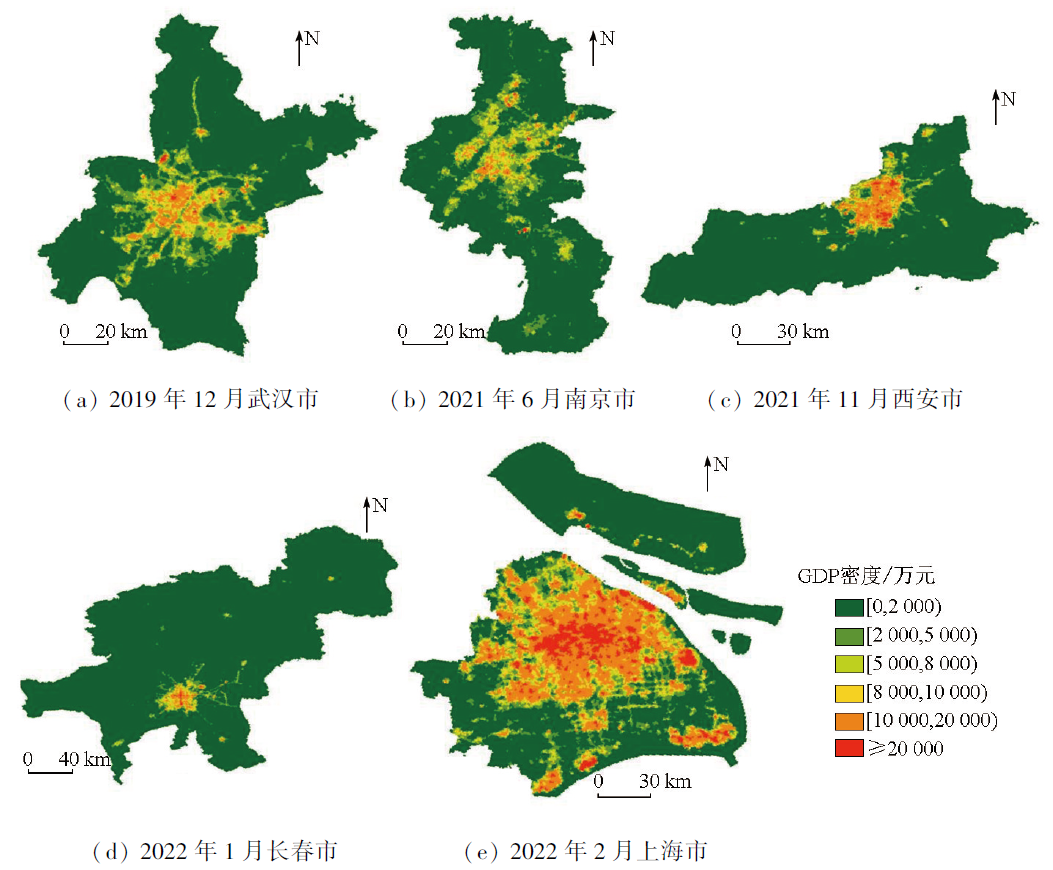
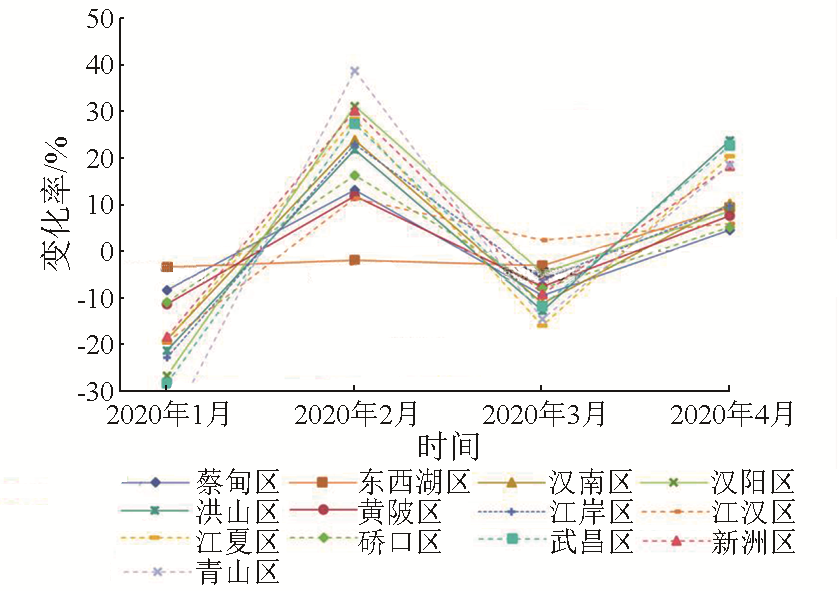
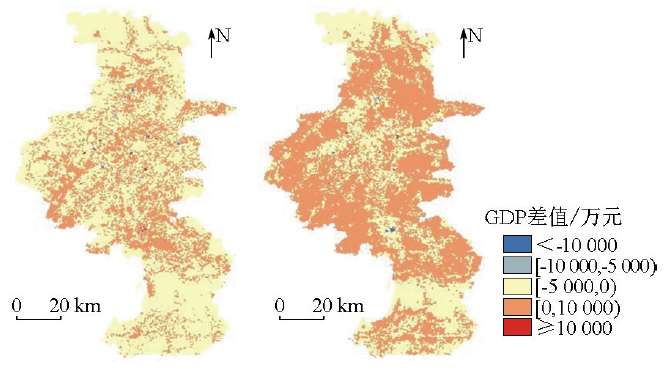
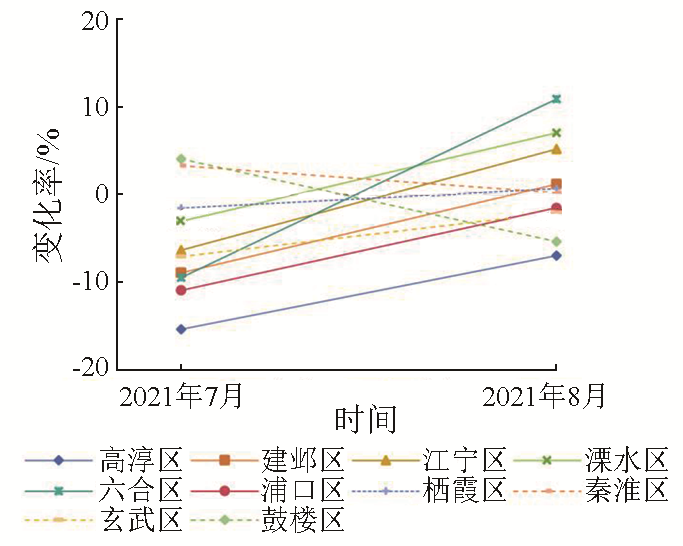
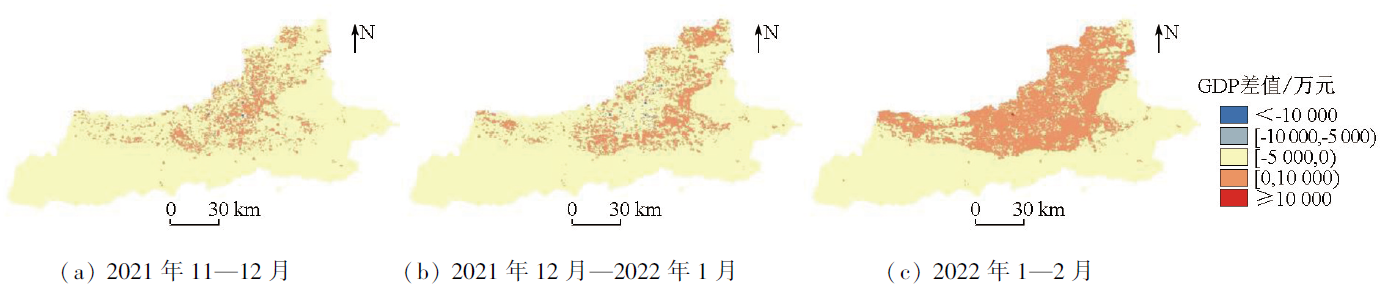
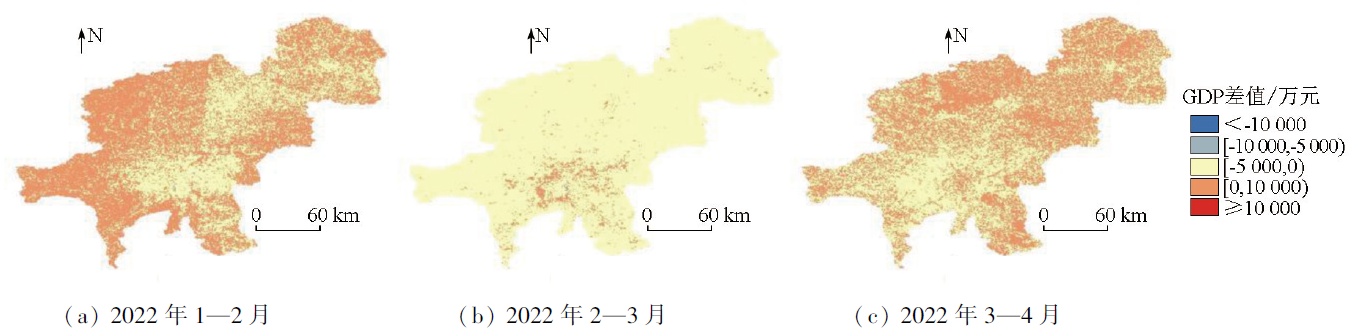
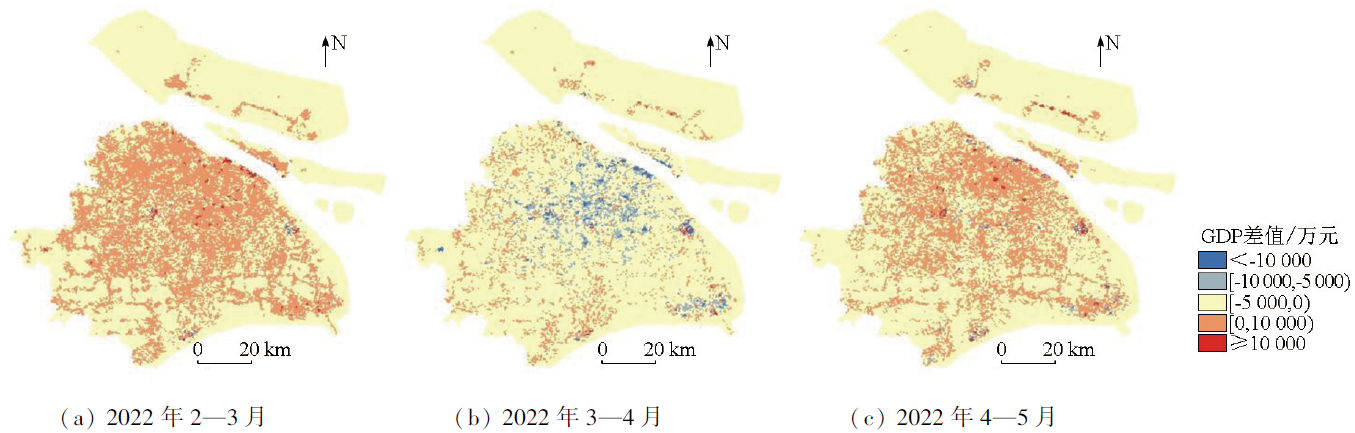
The Corona Virus Disease 2019 (COVID-19) pandemic significantly affected China’s economy. This study investigated China’s five cities that witnessed large-scale COVID-19 outbreaks based on NPP-VIIRS night light (NTL) data. A fitting model between the NTL index and GDP statistics was established. This model can reflect the monthly economic variations, yielding the spatial distribution of GPD. Finally, this study analyzed the trend in the spatial variations of the economy in the five cities during the COVID-19 pandemic by analyzing the differences in monthly GDP density. The results indicate that the GDP predicted using the GDP spatialization based on the NTL index exhibited relatively small errors and can reflect the impacts of the COVID-19 pandemic on the urban economy in an intuitive and clear manner. Under the influence of mobility policies, the marginal areas of most of the cities experienced economic recession in the early and late stages of the pandemic, with economic growth observed in the middle stage of the pandemic. In contrast, the central areas of the cities experienced economic recession in the middle stage of the pandemic, were subjected to minor impacts in its early stage, and witnessed a rapid economic recovery in its late stage. Additionally, the economy in the central areas of the cities was more resistant to the impacts of the pandemic than that in their marginal areas.
LI Ruikai , ZHAO Zongze , TANG Xiaojie , ZHANG Jiayun , WANG Guan , ZHANG Lijuan . Spatiotemporal analysis of economy in China’s primary cities affected by the COVID-19 pandemic based on remote sensing of night light[J]. Remote Sensing for Natural Resources, 2025 , 37(1) : 243 -251 . DOI: 10.6046/zrzyyg.2023257
表1 研究城市及时间段Tab.1 Research cities and time periods |
| 城市 | 疫情严重时间段 | 疫情发展过程 |
|---|---|---|
| 湖北省武汉市 | 2020年1—4月 | 2019年12月8日通报首例病例,2020年1月23日开始管控,3月17日起援鄂医疗队陆续撤离,4月8日解除离汉管控 |
| 江苏省南京市 | 2021年7—8月 | 2021年7月20日报告首例病例,7月22日起开始管控,8月19日全域转为低风险地区 |
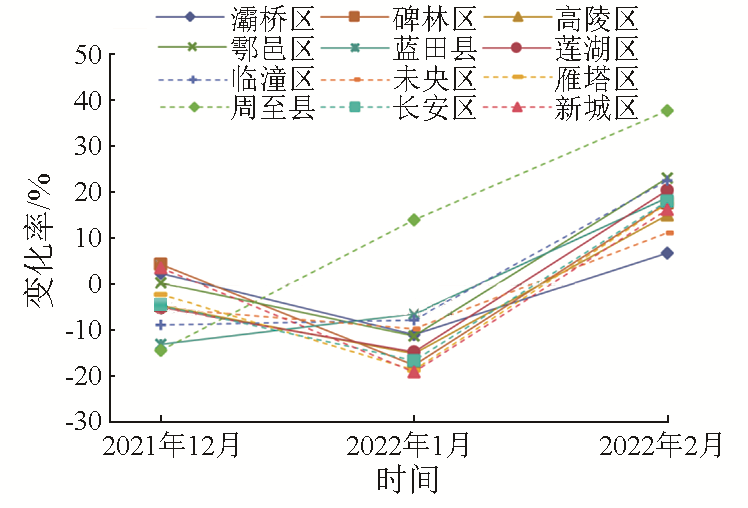
| 陕西省西安市 | 2021年12月—2022年1月 | 2021年12月9日报告首例病例,12月23日开始管控,2022年1月23日全域转为低风险地区 |
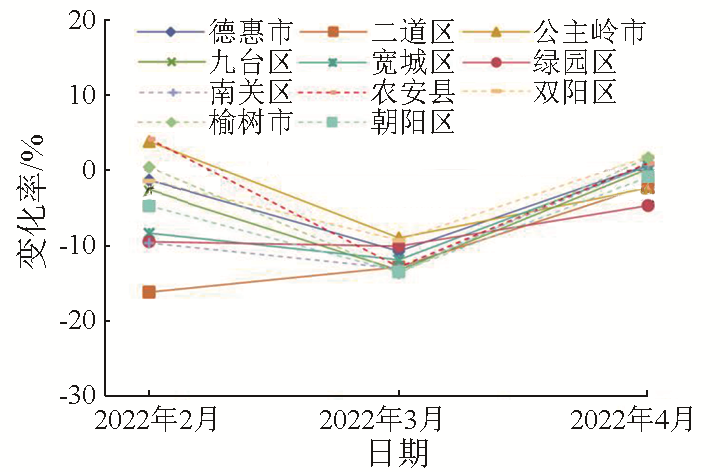
| 吉林省长春市 | 2022年2—4月 | 2022年3月初发现病例,3月20日新增病例速度达到顶点,进行管控,4月下旬疫情得到逐步控制 |
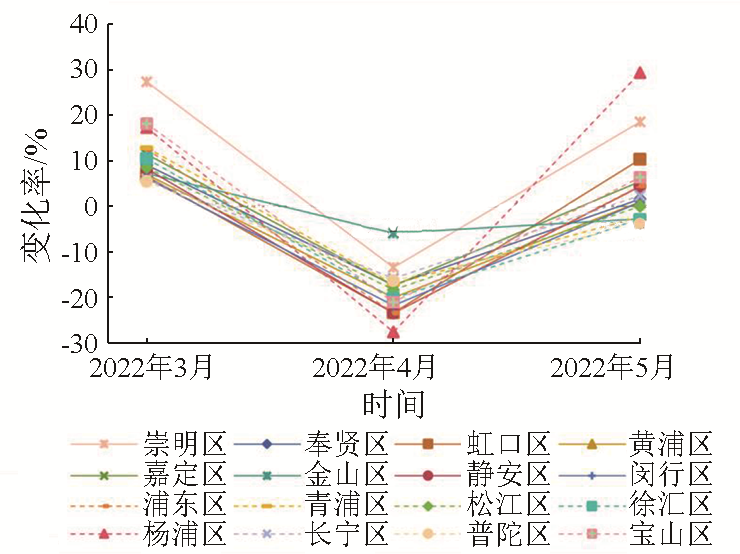
| 上海市 | 2022年3—5月 | 2022年3月1日报告首例病例,3月13日起疫情快速扩散,4月1日实施管控,6月1日解除管控 |
表2 数据来源Tab.2 Data sources |
| 数据类型 | 数据来源 |
|---|---|
| NPP-VIIRS NTL数据 | 美国国家海洋大气管理局NOAA下属的NCEI国家环境信息中心 |
| 行政区划数据 | 中国科学院资源环境科学与数据中心 |
| 年度GDP统计资料 | 《中国城市统计年鉴》 |
| 月度GDP统计资料 | 各地市《统计年鉴》 |
表3 研究区域GDP空间化模型Tab.3 The spatial model of GDP in the study area |
| 城市 | GDP空间化模型 | R2 |
|---|---|---|
| 湖北省武汉市 | y = 262.09x - 102.98 | 0.952 8 |
| 江苏省南京市 | y = 210.19x - 248.23 | 0.925 1 |
| 陕西省西安市 | y = 250.80x - 278.10 | 0.912 7 |
| 吉林省长春市 | y = 133.70x + 255.07 | 0.936 6 |
| 上海市 | y = 511.55x - 4 178.10 | 0.906 7 |
表4 研究区域GDP预测值的相对误差Tab.4 Relative error of GDP forecast values in the study area (%) |
| 年份 | 湖北省 武汉市 | 江苏省 南京市 | 陕西省 西安市 | 吉林省 长春市 | 上海市 |
|---|---|---|---|---|---|
| 2012年 | 1.66 | 11.71 | 0.73 | -10.27 | -7.17 |
| 2013年 | 14.99 | 17.37 | 30.67 | 6.35 | 15.77 |
| 2014年 | -5.20 | 3.60 | 6.03 | 2.58 | -6.90 |
| 2015年 | 0.99 | -7.02 | -8.05 | 6.03 | 7.74 |
| 2016年 | -4.77 | -11.48 | -7.63 | -0.73 | -7.04 |
| 2017年 | -0.79 | -3.52 | -4.00 | 4.61 | 9.16 |
| 2018年 | -5.12 | -4.52 | -3.27 | -2.09 | 2.17 |
| 2019年 | -5.31 | -3.63 | -3.33 | 1.15 | -1.40 |
| 2020年 | 7.11 | 2.86 | -6.20 | -4.76 | -1.61 |
| 2021年 | 0.88 | 2.68 | 5.45 | -1.72 | -6.88 |
表5 GDP空间化精度验证Tab.5 Accuracy verification of GDP spatialization |
| 区县名 | R2 | 区县名 | R2 |
|---|---|---|---|
| 西安市长安区 | 0.951 9 | 西安市灞桥区 | 0.873 0 |
| 西安市雁塔区 | 0.912 4 | 西安市未央区 | 0.935 6 |
| 南京市玄武区 | 0.899 0 | 南京市江宁区 | 0.903 3 |
| 南京市溧水区 | 0.948 8 | 南京市栖霞区 | 0.880 0 |
| 武汉市东西湖区 | 0.947 8 | 武汉市洪山区 | 0.908 1 |
| 武汉市江岸区 | 0.845 0 | 武汉市武昌区 | 0.847 6 |
| [1] |
张清敏. 新冠肺炎疫情与全球卫生外交[J]. 当代世界, 2020(4):35-41.
|
| [2] |
|
| [3] |
李德仁, 李熙. 论夜光遥感数据挖掘[J]. 测绘学报, 2015, 44(6):591-601.
|
| [4] |
郭永德, 高金环, 马洪兵. Suomi-NPP夜间灯光数据与GDP的空间关系分析[J]. 清华大学学报(自然科学版), 2016, 56(10):1122-1130.
|
| [5] |
顾鹏程, 王世新, 周艺, 等. 基于时间序列DMSP/OLS夜间灯光数据的GDP预测模型[J]. 中国科学院大学学报, 2019, 36(2):188-195.
|
| [6] |
陈颖彪, 郑子豪, 吴志峰, 等. 夜间灯光遥感数据应用综述和展望[J]. 地理科学进展, 2019, 38(2):205-223.
|
| [7] |
余柏蒗, 王丛笑, 宫文康, 等. 夜间灯光遥感与城市问题研究: 数据、方法、应用和展望[J]. 遥感学报, 2021, 25(1):342-364.
|
| [8] |
韩向娣, 周艺, 王世新, 等. 夜间灯光遥感数据的 GDP 空间化处理方法[J]. 地球信息科学学报, 2012, 14(1):128-136.
|
| [9] |
刘杨, 李宏伟, 杨斌程, 等. 基于遥感数据和POI数据的GDP空间化研究——以北京市为例[J]. 地域研究与开发, 2021, 40(2):27-32,39.
|
| [10] |
|
| [11] |
孙久文, 周孝伦. 多维视角下的长三角城市群空间结构及其影响因素——基于NPP-VIIRS夜间灯光数据和高德人口迁徙数据[J]. 经济地理, 2023, 43(5):78-88.
|
| [12] |
李翔, 朱江, 尹向东, 等. 利用珞珈一号夜间灯光数据的广东省GDP空间化[J]. 遥感信息, 2021, 36(2):40-45.
|
| [13] |
|
| [14] |
江泽霖, 邓健, 栾海军, 等. 基于逐日夜间灯光遥感的新冠肺炎疫情变化信息快速提取——以北京市为例[J]. 测绘通报, 2022 (7):43-48.
|
| [15] |
陶金花, 范萌, 顾坚斌, 等. 新冠病毒疫情期间复工复产卫星遥感监测[J]. 遥感学报, 2020, 24(7):824-836.
|
| [16] |
|
| [17] |
|
| [18] |
|
| [19] |
裴韬, 王席, 宋辞, 等. COVID-19疫情时空分析与建模研究进展[J]. 地球信息科学学报, 2021, 23(2):188-210.
|
| [20] |
|
/
| 〈 |
|
〉 |