
Remote Sensing for Natural Resources >
Spatiotemporal changes of ecological quality and their driving factors in Zhengzhou City over the last 20 years
Received date: 2023-07-11
Revised date: 2023-09-27
Online published: 2026-06-03
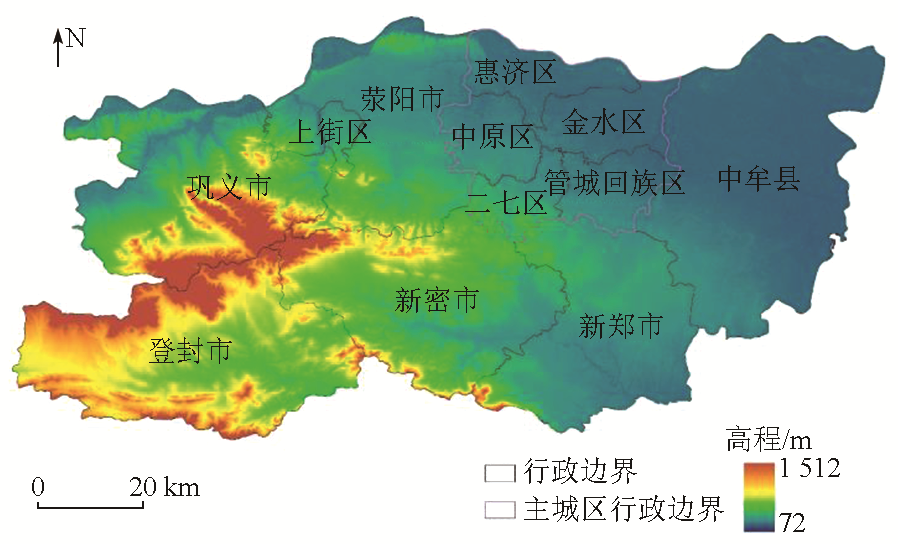
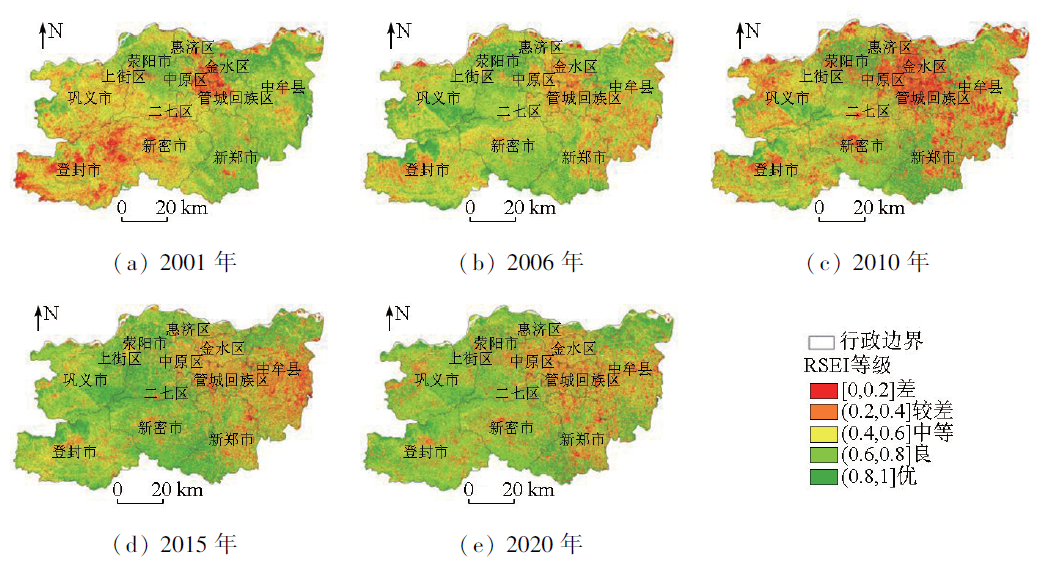
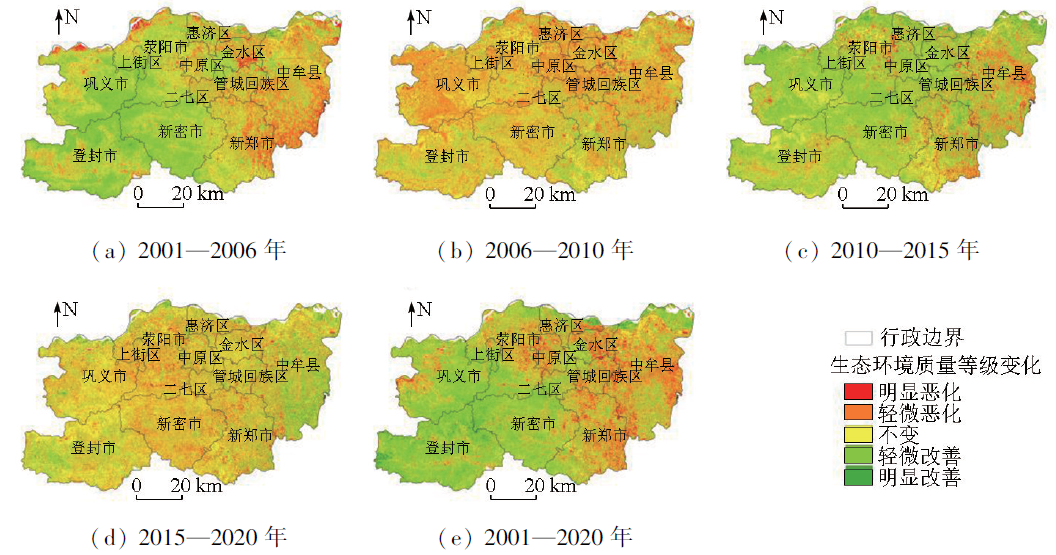
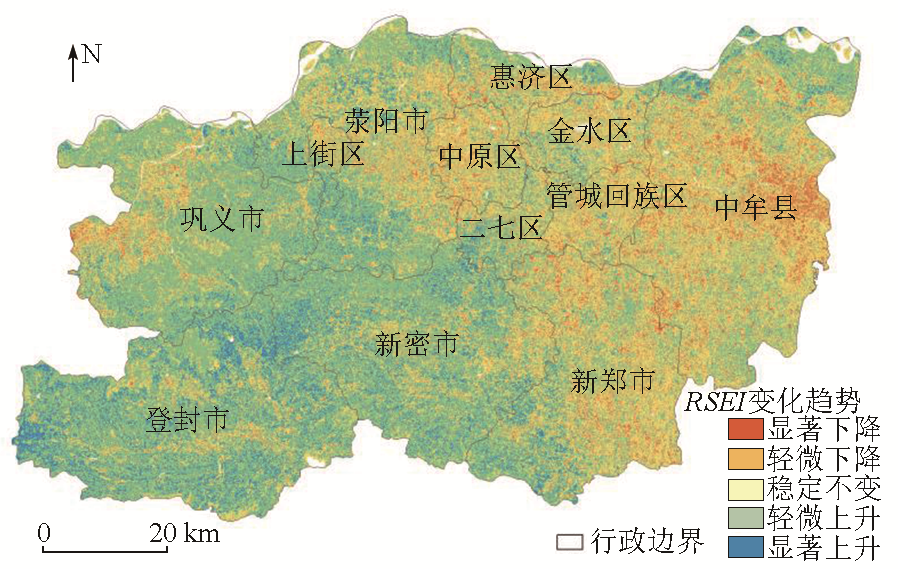
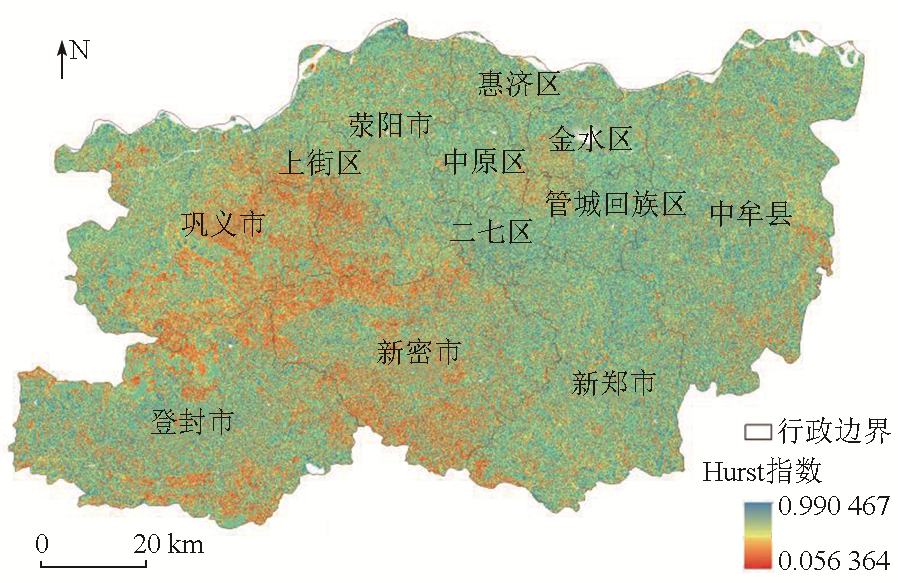
Ecological quality is an important indicator of a regional development level. Objective, quantitative dynamic monitoring and analysis of long-term ecological quality can provide a scientific basis for urban sustainable development and ecological construction. Based on Landsat remote sensing images, this study constructed the remote sensing ecological index (RSEI) as an evaluation index using principal component analysis. Accordingly, this study explored the spatiotemporal change characteristics of ecological quality in Zhengzhou from 2001 to 2020, as well as the extent of influence of various driving factors, using the Sen+Mann-Kendall trend analysis, the Hurst index, and geographical detectors. The results indicate that from 2001 to 2020, Zhengzhou maintained moderate ecological quality overall. The RSEI showed downward, upward, and then downward trends sequentially. Spatially, the eastern plains showed lower ecological quality, whereas the southwestern mountainous and hilly areas exhibited higher ecological quality. The regional ecological quality remained unchanged predominantly or saw slight improvements over these years except for 2010, when the area of zones with ecological quality deteriorating significantly increased due to high temperature. From 2001 to 2020, the ecological quality in Zhengzhou exhibited significant trends, with 56.34% of areas showing an upward trend and 42.26% exhibiting a downward trend. These results, along with the Hurst index, reveal that the downward trend in ecological quality in the eastern part is primarily characterized by sustainable changes in the future, while the upward trend in ecological quality in the southwestern partition is primarily characterized by anti-sustainable changes in the future. Driving force analysis indicates that over the 20 years, primary factors influencing changes in ecological quality in Zhengzhou included land use type and population density, whose explanatory power is significantly stronger than other factors. The impact of natural factors, such as elevation and average annual precipitation, has gradually diminished, while the influence of the night light index, which reflects the urbanization level, has progressively increased. The results of this study will provide a scientific basis for the evaluation and preservation of ecosystems in Zhengzhou.
AO Yong , WANG Ya , WANG Xiaofeng , WU Jingsheng , ZHANG Yiheng , LI Xuejiao . Spatiotemporal changes of ecological quality and their driving factors in Zhengzhou City over the last 20 years[J]. Remote Sensing for Natural Resources, 2025 , 37(1) : 102 -112 . DOI: 10.6046/zrzyyg.2023203
表1 指标计算公式Tab.1 Indicators calculation equation |
| 指标 | 计算公式 | 说明 |
|---|---|---|
| 绿度(NDVI) | 为近红外波段反射率; 为红光波段反射率 | |
| 湿度(Wet) | , , , , 和 分别为TM与OLI数据的蓝、绿、红、近红外、短波红外1和短波红外2波段的反射率数据 | |
| 热度(LST) | 为热红外辐射亮度值; 为黑体热辐射亮度; 为地表比辐射率; 为大气透过率; 为大气上行辐射亮度; 为大气下行辐射亮度; , 为传感器定标参数 | |
| 干度(NDBSI) | | 为裸土指数; 为建筑指数; , , , , 分别为TM与OLI数据的蓝、绿、红、近红外和短波红外1波段的反射率数据 |
表2 因子交互作用类型Tab.2 Types of factors interaction |
| 值范围 | 交互作用类型 |
|---|---|
| 非线性减弱 | |
| 单线性减弱 | |
| 双因子增强 | |
| 相互独立 | |
| 非线性增强 |
表3 不同年份第一主成分载荷与贡献率Tab.3 Load and contribution rate of the PC1 in different years |
| 年份 | 第一主成分PC1 | 贡献率/% | |||
|---|---|---|---|---|---|
| 绿度 | 湿度 | 热度 | 干度 | ||
| NDVI | WET | LST | NDBSI | ||
| 2001年 | 0.716 | 0.277 | -0.304 | -0.608 | 76.18 |
| 2006年 | 0.648 | 0.292 | -0.341 | -0.646 | 78.03 |
| 2010年 | 0.668 | 0.319 | -0.362 | -0.674 | 85.13 |
| 2015年 | 0.730 | 0.285 | -0.324 | -0.617 | 81.39 |
| 2020年 | 0.667 | 0.317 | -0.310 | -0.624 | 79.46 |
| 平均值 | 0.686 | 0.298 | -0.328 | -0.634 | 80.04 |
表4 2001—2020年郑州市生态环境质量等级面积与占比Tab.4 Areas and proportions of ecological environment quality levels in Zhengzhou City from 2001 to 2020 |
| 等级 | 2001年 | 2006年 | 2010年 | 2015年 | 2020年 | |||||
|---|---|---|---|---|---|---|---|---|---|---|
| 面积/km2 | 占比/% | 面积/km2 | 占比/% | 面积/km2 | 占比/% | 面积/km2 | 占比/% | 面积/km2 | 占比/% | |
| 差 | 469.67 | 6.33 | 130.67 | 1.76 | 797.53 | 10.76 | 395.93 | 5.34 | 416.12 | 5.61 |
| 较差 | 1 495.85 | 20.17 | 1 269.94 | 17.13 | 1 702.43 | 22.96 | 1 114.97 | 15.04 | 1 129.83 | 15.24 |
| 中等 | 2 494.00 | 33.64 | 2 328.42 | 31.40 | 1 951.10 | 26.31 | 1 624.60 | 21.91 | 1 560.85 | 21.05 |
| 良 | 2 217.18 | 29.90 | 2 581.36 | 34.82 | 1 912.03 | 25.79 | 2 369.05 | 31.95 | 2 836.95 | 38.26 |
| 优 | 737.75 | 9.95 | 1 104.06 | 14.89 | 1 051.36 | 14.18 | 1 909.90 | 25.76 | 1 470.70 | 19.84 |
表5 2001—2020年郑州市生态环境质量等级变化情况Tab.5 Changes of ecological environment quality levels in Zhengzhou City from 2001 to 2020 |
| 变化类型 | 级差 | 2001—2006年 | 2006—2010年 | 2010—2015年 | 2015—2020年 | ||||
|---|---|---|---|---|---|---|---|---|---|
| 面积/km2 | 占比/% | 面积/km2 | 占比/% | 面积/km2 | 占比/% | 面积/km2 | 占比/% | ||
| 恶化 | -4 | 13.46 | 0.18 | 27.97 | 0.38 | 28.86 | 0.39 | 27.93 | 0.38 |
| -3 | 112.02 | 1.51 | 122.13 | 1.65 | 133.68 | 1.80 | 123.85 | 1.67 | |
| -2 | 447.65 | 6.04 | 470.84 | 6.35 | 320.10 | 4.32 | 386.55 | 5.21 | |
| -1 | 1 086.67 | 14.66 | 2 492.23 | 33.61 | 763.36 | 10.30 | 1 259.32 | 16.98 | |
| 不变 | 0 | 2 385.91 | 32.18 | 3 150.79 | 42.50 | 2 244.54 | 30.27 | 3 373.99 | 45.51 |
| 改善 | 1 | 2 454.52 | 33.10 | 962.53 | 12.98 | 2 671.43 | 36.03 | 1 711.14 | 23.08 |
| 2 | 829.84 | 11.19 | 157.67 | 2.13 | 989.91 | 13.35 | 381.61 | 5.15 | |
| 3 | 79.16 | 1.07 | 27.74 | 0.37 | 216.73 | 2.92 | 121.01 | 1.63 | |
| 4 | 5.22 | 0.07 | 2.55 | 0.03 | 45.84 | 0.62 | 29.05 | 0.39 | |
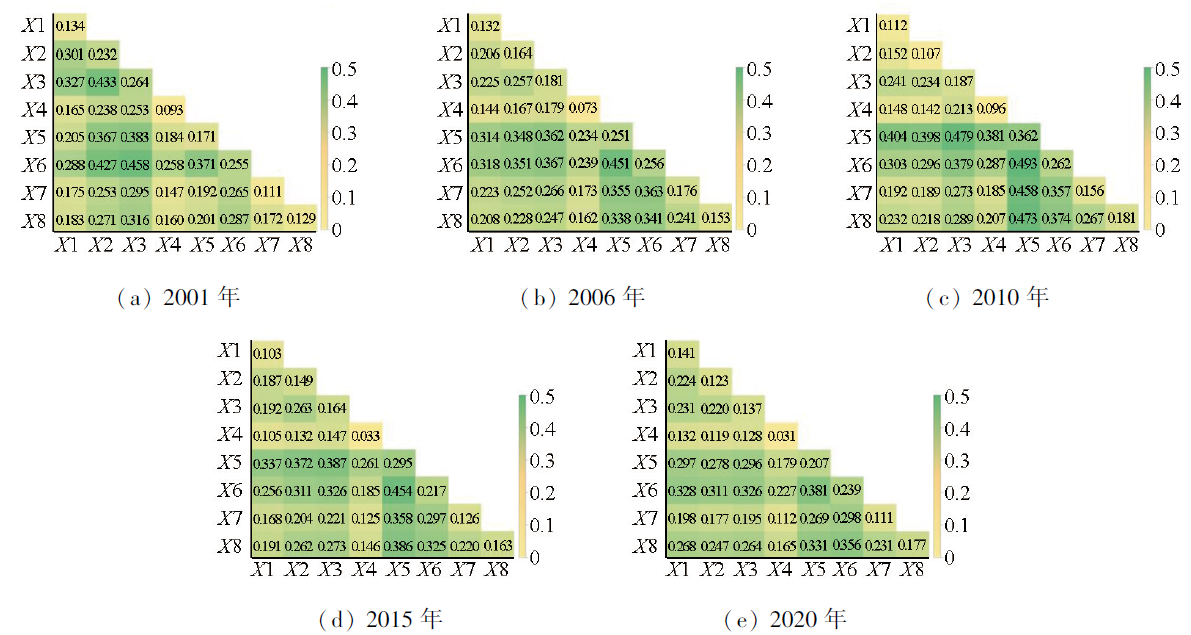
表6 因子探测结果Tab.6 Results of single detection |
| 因子类型 | 2001年 | 2006年 | 2010年 | 2015年 | 2020年 | 2000—2020年 | ||||||
|---|---|---|---|---|---|---|---|---|---|---|---|---|
| 值 | 排序 | 值 | 排序 | 值 | 排序 | 值 | 排序 | 值 | 排序 | 值 | 排序 | |
| 年均降水 | 0.134 | 5 | 0.132 | 7 | 0.112 | 6 | 0.103 | 7 | 0.141 | 4 | 0.124 | 7 |
| 年均气温 | 0.232 | 3 | 0.164 | 5 | 0.107 | 7 | 0.149 | 6 | 0.123 | 6 | 0.155 | 5 |
| 高程 | 0.264 | 1 | 0.181 | 3 | 0.187 | 3 | 0.164 | 3 | 0.137 | 5 | 0.186 | 3 |
| 坡度 | 0.093 | 8 | 0.073 | 8 | 0.096 | 8 | 0.033 | 8 | 0.031 | 8 | 0.065 | 8 |
| 土地利用类型 | 0.171 | 4 | 0.251 | 2 | 0.362 | 1 | 0.295 | 1 | 0.207 | 2 | 0.257 | 1 |
| 人口密度 | 0.255 | 2 | 0.256 | 1 | 0.262 | 2 | 0.217 | 2 | 0.239 | 1 | 0.246 | 2 |
| GDP | 0.111 | 7 | 0.176 | 4 | 0.156 | 5 | 0.126 | 5 | 0.111 | 7 | 0.136 | 6 |
| 夜间灯光数据 | 0.129 | 6 | 0.153 | 6 | 0.181 | 4 | 0.163 | 4 | 0.177 | 3 | 0.161 | 4 |
| [1] |
熊欢欢, 梁龙武, 曾赠, 等. 中国城市PM2.5时空分布的动态比较分析[J]. 资源科学, 2017, 39(1):136-146.
|
| [2] |
|
| [3] |
罗红霞, 戴声佩, 李茂芬, 等. 海南岛植被覆盖变化驱动因子及相对作用评价[J]. 国土资源遥感, 2020, 32(1):154-161.doi:10.6046/gtzyyg.2020.01.21.
|
| [4] |
胡楠林, 任志彬, 董禹麟, 等. 中国城市群热岛效应时空演变及其影响因素分析[J]. 地理科学, 2022, 42(9):1534-1545.
|
| [5] |
中华人民共和国环境保护部. HJ 192—2015 生态环境状况评价技术规范[S]. 北京: 中国环境科学出版社, 2015.
Ministry of Environmental Protection of the People’s Republic of China. HJ 192—2015 Technical criterion for ecosystem status evaluation[S]. Beijing: China Environmental Science Press, 2015.
|
| [6] |
|
| [7] |
张洁, 杨燕琼. 珠江三角洲城市群生态状况变化遥感评价[J]. 西北林学院学报, 2019, 34(1):184-191.
|
| [8] |
张芳宁, 杨亮洁, 杨永春. 1981—2016年黄土高原植被NDVI变化及对气候和人类活动的响应[J]. 水土保持研究, 2023, 30(2):230-237.
|
| [9] |
王阳, 孙然好. 区域气候背景对城市热岛效应的影响规律[J]. 生态学报, 2021, 41(11):4288-4299.
|
| [10] |
温小乐, 徐涵秋. 福州城市扩展对闽江下游水质影响的遥感分析[J]. 地理科学, 2010, 30(4):624-629.
|
| [11] |
|
| [12] |
徐涵秋. 城市遥感生态指数的创建及其应用[J]. 生态学报, 2013, 33(24):7853-7862.
|
| [13] |
|
| [14] |
|
| [15] |
李世杰, 冯徽徽, 王珍, 等. 近十年洞庭湖流域生态环境状况时空动态特征及影响因素[J]. 自然资源遥感:1-10.doi:10.6046/zrzyyg.2022375.
|
| [16] |
王丽春, 焦黎, 来风兵, 等. 基于遥感生态指数的新疆玛纳斯湖湿地生态变化评价[J]. 生态学报, 2019, 39(8):2963-2972.
|
| [17] |
赵管乐, 彭培好. 基于RSEI的典例干热河谷区——四川省攀枝花市生态环境变化分析[J]. 山地学报, 2021, 39(6):842-854.
|
| [18] |
权文婷, 张树誉, 刘艳, 等. 基于遥感生态指数的陕西省东庄水库流域生态环境变化监测与评价[J]. 水土保持通报, 2022, 42(5):96-104,113.
|
| [19] |
李元应, 郑琳琳. 基于黄河流域生态环境保护视域下郑州与焦作绿色城市建设问题探究[J]. 现代园艺, 2022, 45(8):158-160.
|
| [20] |
尚明宇, 王富强, 马尚钰. 郑州市土地利用/覆被变化模拟预测及其水源涵养量计算评估[J]. 水利水电技术(中英文), 2023, 54(1):75-86.
|
| [21] |
王佃来, 刘文萍, 黄心渊. 基于Sen+Mann-Kendall的北京植被变化趋势分析[J]. 计算机工程与应用, 2013, 49(5):13-17.
|
| [22] |
李超, 李雪梅. 2000—2018年中国植被生态质量时空变化特征[J]. 长江流域资源与环境, 2021, 30(9):2154-2165.
|
| [23] |
王巨. 基于时序NDVI植被变化检测与驱动因素量化方法研究——以河西地区为例[D]. 兰州: 兰州大学, 2020.
|
| [24] |
康帅直, 穆琪, 赵永华, 等. 黄土高原神府资源开采区生态环境质量时空格局特征[J]. 生态学报, 2023, 43(7):2781-2792.
|
| [25] |
孔晶晶, 昝梅, 王雪梅, 等. 新疆玛纳斯河流域植被水分利用效率时空格局及影响因素研究[J]. 水资源与水工程学报, 2022, 33(6):196-203,212.
|
| [26] |
|
| [27] |
王劲峰, 徐成东. 地理探测器:原理与展望[J]. 地理学报, 2017, 72(1):116-134.
|
| [28] |
邢昱, 赵颖, 唐敏, 等. 河南省“十三五”期间生态环境质量变化趋势[J]. 中国环境监测, 2022, 38(6):40-49.
|
| [29] |
田智慧, 尹传鑫, 王晓蕾. 鄱阳湖流域生态环境动态评估及驱动因子分析[J]. 环境科学, 2023, 44(2):816-827.
|
| [30] |
王栋华, 田义超, 张亚丽, 等. 峰丛洼地流域植被覆盖度时空演变及其归因[J]. 中国环境科学, 2022, 42(9):4274-4284.
|
| [31] |
|
| [32] |
卢楠楠. 基于遥感的不透水面监测及其对生态环境质量的影响——以郑州开封地区为例[D]. 开封: 河南大学, 2022.
|
| [33] |
|
/
| 〈 |
|
〉 |