Full Length Article

Hydrological change trends of the Surkhob and Khingov river basins in the Vakhsh River of Tajikistan under climate change

  • Nasrulloev FARHOD a, b ,
  • CHEN Yaning , a, * ,
  • Sheralizoda NAZRIALO b ,
  • Gulahmadov NEKRUZ a ,
  • Shobairi SEYED OMID REZA a ,
  • Murodov MURODKHUJA a, b
Expand
  • aXinjiang Institute of Ecology and Geography, Chinese Academy of Sciences, Urumqi, 830011, China
  • bCenter for Research of Glaciers of the National Academy of Sciences of Tajikistan, Dushanbe, 734025, Tajikistan
* E-mail address: (CHEN Yaning).

Received date: 2025-06-19

  Revised date: 2025-11-21

  Accepted date: 2026-01-04

  Online published: 2026-03-11

Abstract

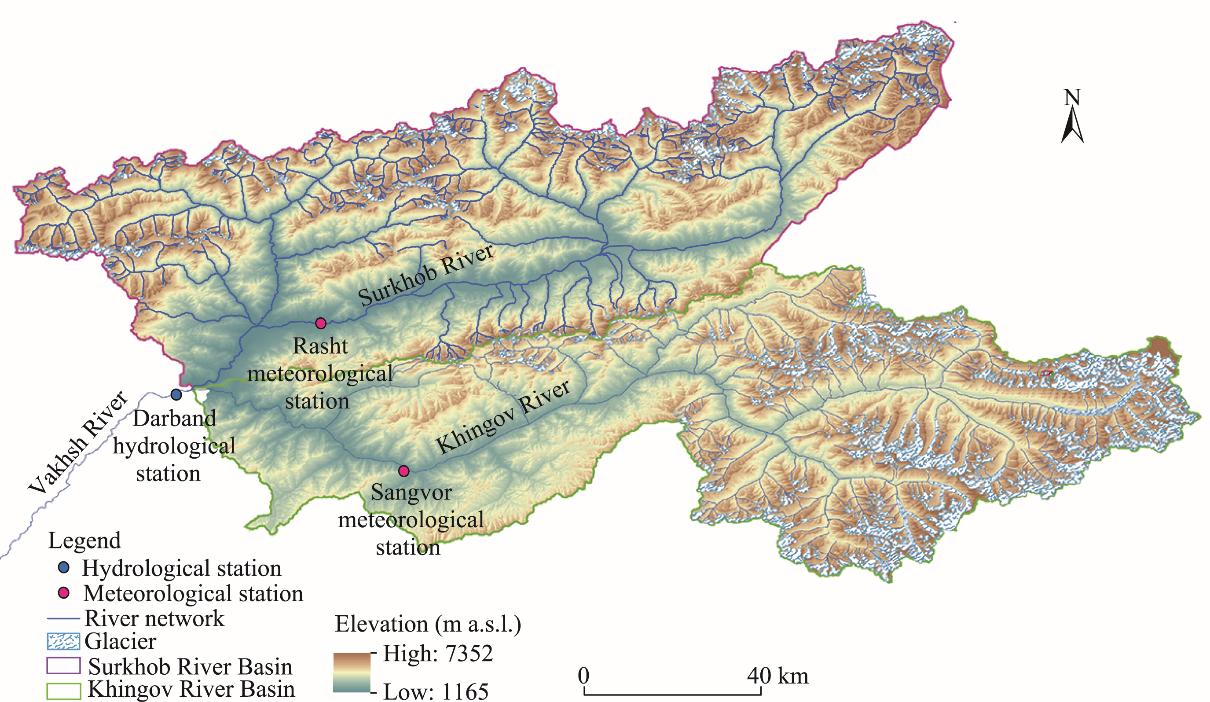
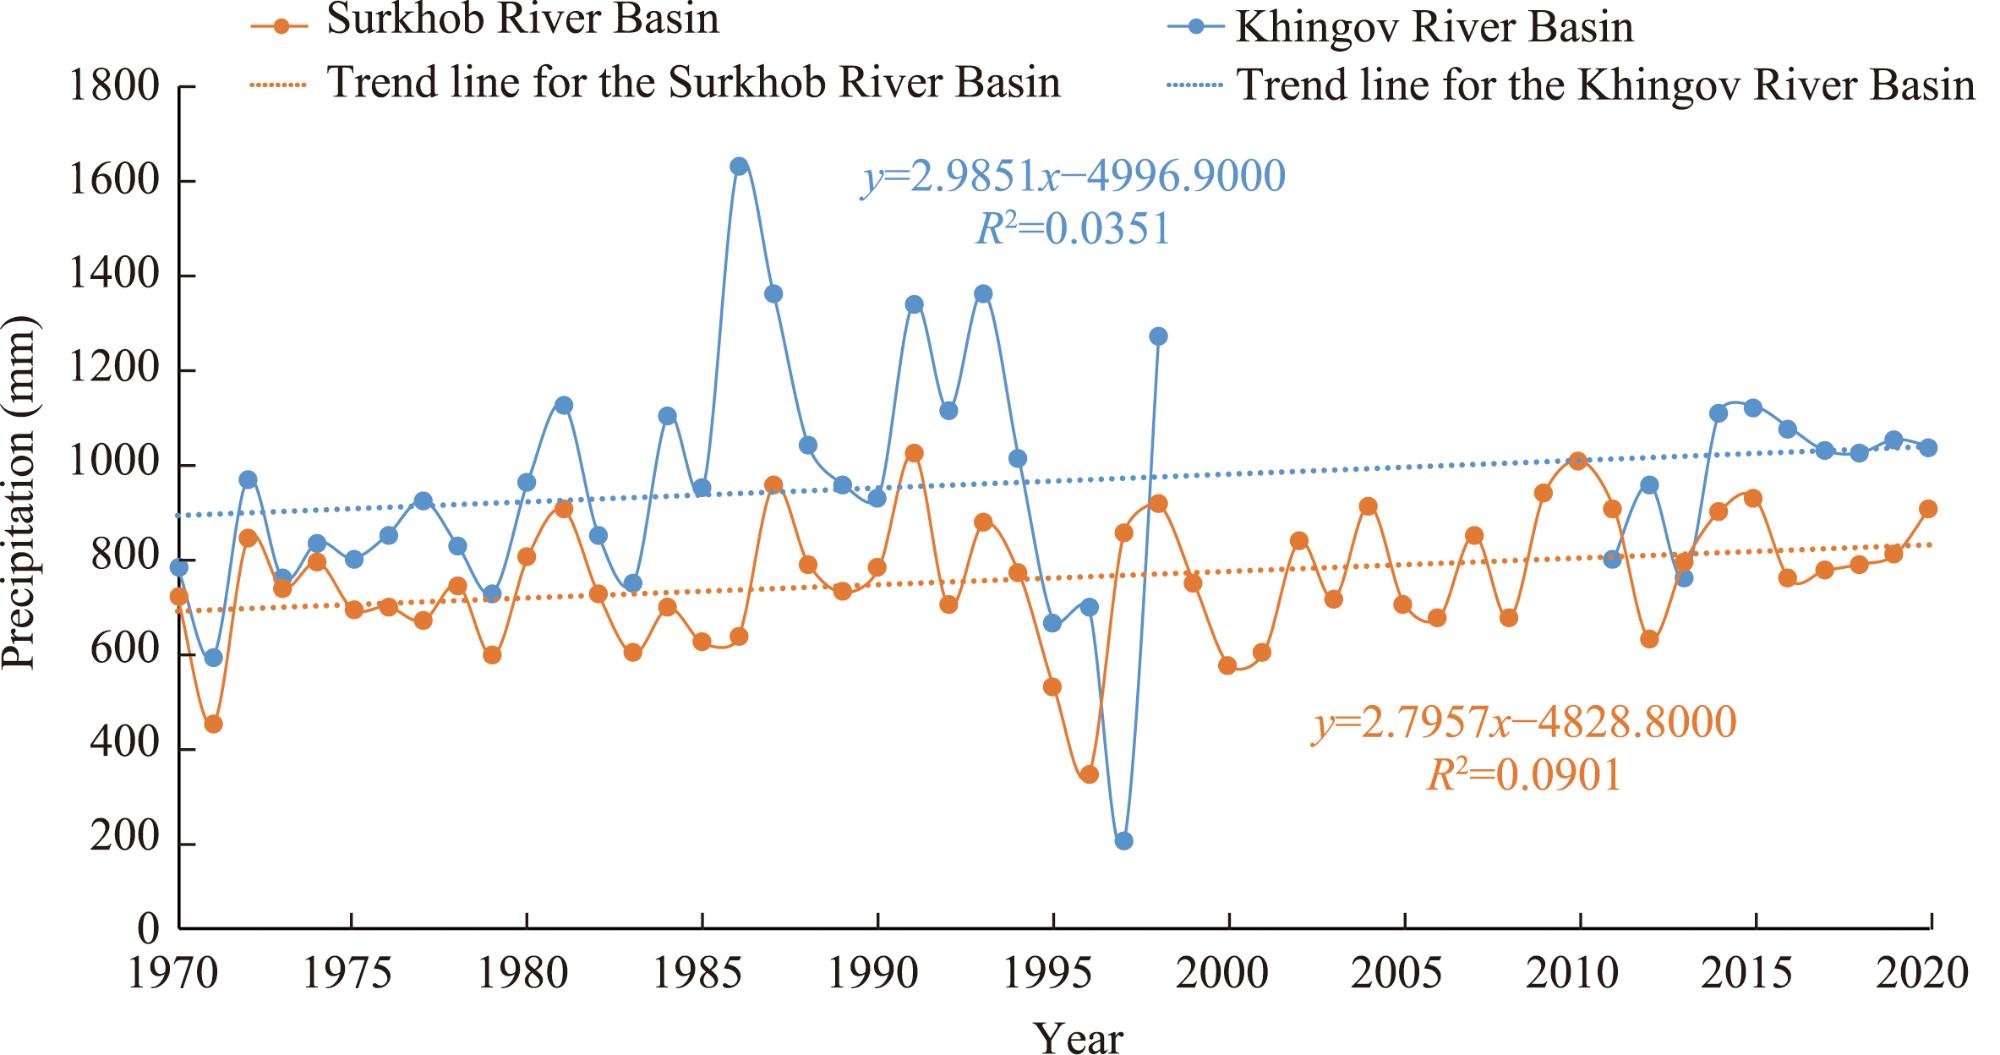
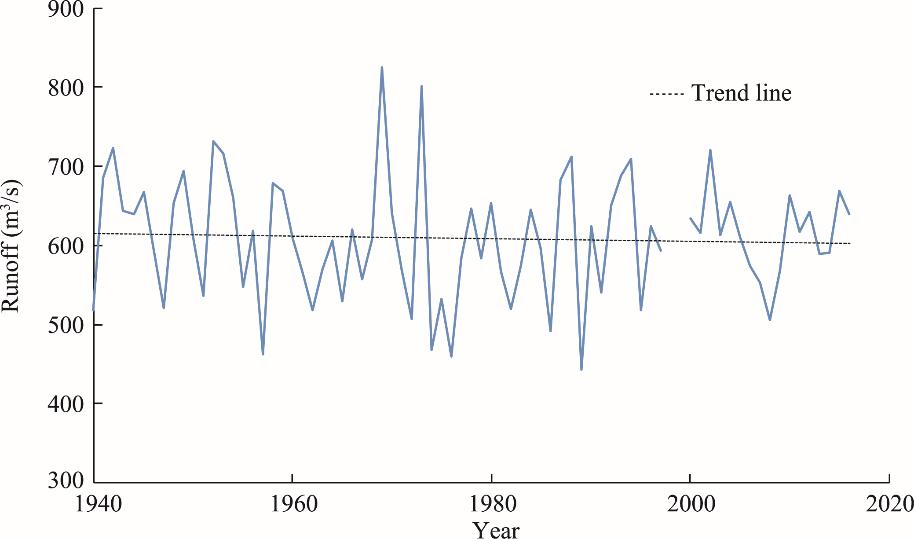
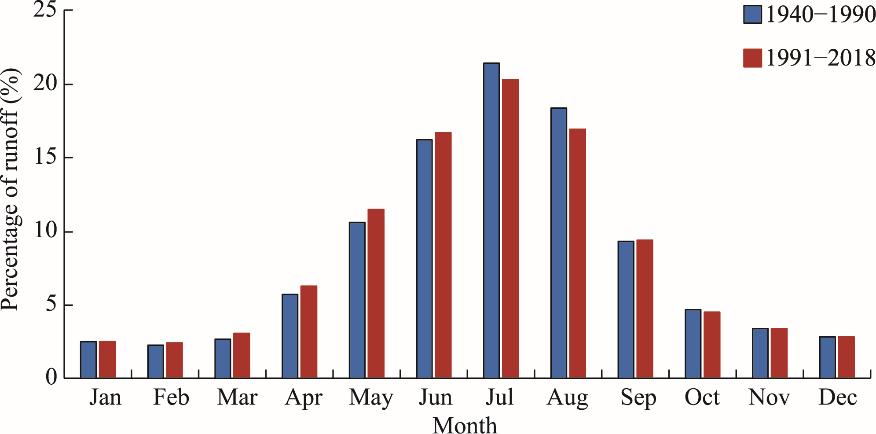
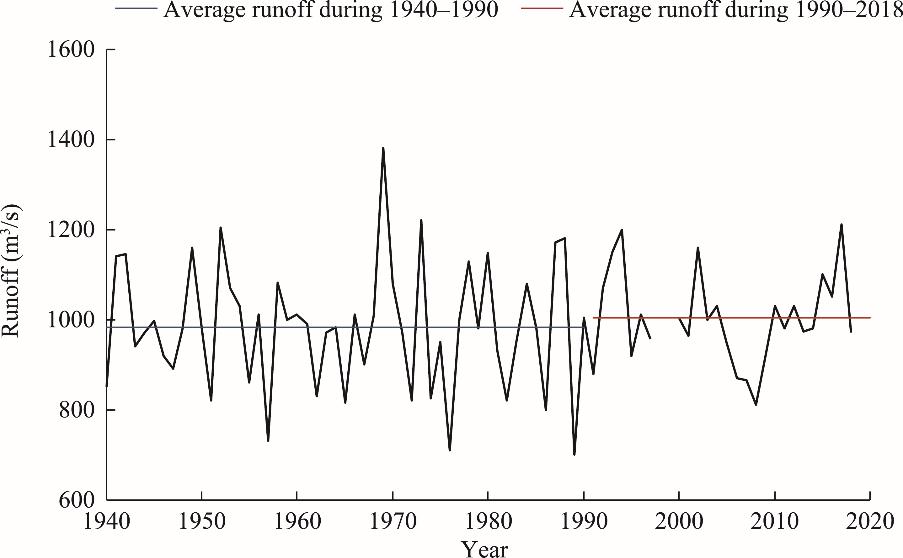
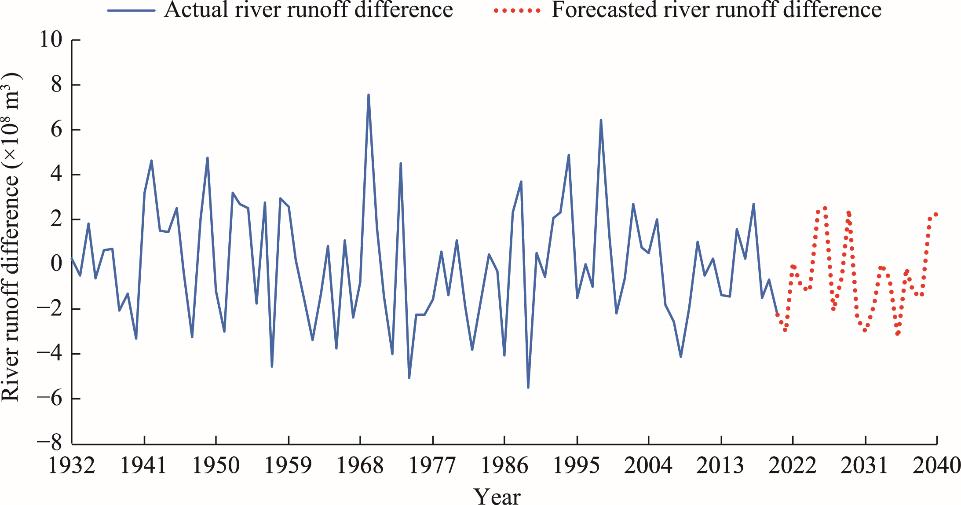
The hydrological system in Central Asia is highly sensitive to global climate change, significantly affecting water supply and energy production. In Tajikistan, the Vakhsh River—one of the main tributaries of the Amu Darya—plays a key role in the region’s hydropower and irrigation. However, research on long-term hydrological changes in its two top large basins—the Surkhob and Khingov river basins—remains limited. Therefore, this study analyzed long-term climate and hydrological changes in the Vakhsh River, including its main tributaries—the Surkhob and Khingov rivers—which are vital for the water resource management in Tajikistan and even in Central Asia. Using long-term hydrometeorological observations, the change trends of temperature (1933-2020), precipitation (1970-2020), and runoff (1940-2018) were examined to assess the impact of climate change on the regional water resources. The analysis revealed the occurrence of significant warming and a spatially uneven increase in precipitation. The temperature changes across three climatic periods (1933-1960, 1960-1990, and 1990-2020) indicated that there was a transition from baseline level to accelerated warming. The precipitation showed a 2.99 mm/a increase in the Khingov River Basin and a 2.80 mm/a increase in the Surkhob River Basin during 1970-2020. Moreover, there was a gradual shift toward wetter conditions in recent decades. Despite the relatively stable annual mean runoff, seasonal redistribution occurred, with increased runoff in spring and reduced runoff in summer, due to the compensation of glacier melting. Moreover, this study forecasted runoff change during 2019-2040 using the exponential triple smoothing (ETS) method and revealed the occurrence of alternating wet and dry phases, emphasizing the sensitivity of the Vakhsh River Basin’s hydrological system to climate change and the necessity of adaptive water resource management in mountainous regions of Central Asia. Therefore, this study can provide evidence-based insights that are critical for future water resources planning, climate-resilient hydropower development, and regional adaptation strategies in climate-vulnerable basins in Central Asia.

Cite this article

Nasrulloev FARHOD , CHEN Yaning , Sheralizoda NAZRIALO , Gulahmadov NEKRUZ , Shobairi SEYED OMID REZA , Murodov MURODKHUJA . Hydrological change trends of the Surkhob and Khingov river basins in the Vakhsh River of Tajikistan under climate change[J]. Regional Sustainability, 2026 , 7(1) : 100300 . DOI: 10.1016/j.regsus.2026.100300

1. Introduction

The mountainous regions in Central Asia, particularly Tajikistan, function as the region’s water towers that store precipitation as snow and glacier. This stored water melts during warmer months, providing a crucial, sustained flow for the Amu Darya and Syr Darya in Tajikistan, which is especially important for the arid lowlands during dry periods. However, ongoing global warming has accelerated glacier retreat and reduced snow cover, destabilizing this natural reservoir and threatening the water and energy security of downstream regions (Viviroli et al., 2007; Immerzeel et al., 2020; Schaffer et al., 2025). Understanding these transformations requires accurate long-term assessment of climatic and hydrological changes to support adaptive water resource management under increasing uncertainty.
The cryosphere in Tajikistan exhibits significant spatial heterogeneity, and the snow, glacier, and permafrost dynamics exert complex controls on the generation of runoff and the occurrence of natural disasters (Barandun et al., 2021; Kayumov et al., 2022). Despite recent advances, the limited in situ observations and fragmented hydrometeorological records continue to constrain our knowledge of the climate-glacier-runoff system (Barandun and Pohl, 2023). Reliable assessments, therefore, depend on integrating long-term monitoring with remote sensing, physically based hydrological modeling and the Coupled Model Intercomparison Project Phase 6 (CMIP6) scenario analyses (Eyring et al., 2016; Hoelzle et al., 2019). Current projections suggest that runoff in glacier-fed basins may initially enhance due to the increase of meltwater but will decline as glacier storage diminishes in the second half of the century (Aizen et al., 1995; Kure et al., 2013; Xenarios et al., 2019; Saks et al., 2022). In the upper regions of the Vakhsh River Basin, temperature is projected to rise by 0.40°C-0.70°C by 2050, while the runoff may decrease by approximately 7.00%, and the glacier area may decrease by 55.00% relative to 1950-2020 (Normatov, 2022).
The Vakhsh River, a major tributary of the Amu Darya, plays a strategic role in Tajikistan’s hydropower system, providing nearly 95.00% of the country’s electricity. The runoff is primarily derived from seasonal snow and glacier melt, and the basin’s complex topography—ranging from the steep Muksu-Zarinrud valleys to the smoother Yovon lowlands—strongly influences the precipitation distribution, runoff velocity, and flood dynamics (Cui et al., 2018; Huss and Hock, 2018; Gulakhmadov et al., 2020; Kayumov and Arifov, 2021). Intensified rainfall and land use changes have also increased erosion, sediment transport, and reservoir siltation, while hydrochemical alterations linked to the increase of sodium and magnesium concentrations threaten soil salinity balance and agricultural productivity (Normatov et al., 2024).
The water resources in Central Asia are highly interdependent and transboundary, generating both cooperative and competitive pressures among riparian countries (ICG, 2002). Yet, regional water resource governance remains hampered by the limited data exchange and institutional constraints. In Tajikistan, hydrological assessments still rely heavily on Soviet-era archives (Union of Soviet Socialist Republics Glacier Inventory, 1971, 1978; Osipova et al., 1998; Kotlyakov et al., 2008), complicating efforts to evaluate current trends. Thus, the integration of satellite datasets, digital elevation models, and modern hydrological modeling can provide an essential mean for quantifying the spatiotemporal variability of runoff and evaluating the impact of climate change on glacier-fed systems (Chen et al., 2017; Liang et al., 2023).
Against this backdrop, the Vakhsh River Basin represents a key hydrological system in which cryospheric, climatic, and anthropogenic processes interact. Based on the continuous hydrometeorological observations conducted over nearly a century (Water Resources of Tajikistan, 2003; Petrov, 2007), this study aims to achieve the following objectives: (1) analyzing long-term climatic and hydrological change trends in the Vakhsh River Basin; (2) assessing the spatial and temporal variations of river runoff; and (3) providing a scientific basis for adaptive water resource management and hydropower planning in the mountainous regions of Central Asia.

2. Materials and methods

2.1. Study area

The Vakhsh River, one of the largest right-bank tributaries of the transboundary Amu Darya, plays a crucial role in shaping the water resources in Central Asia. Its catchment covers more than 39,000 km2, of which approximately 31,200 km2 is located in Tajikistan (Water Resources of Tajikistan, 2003). The Vakhsh River Basin spans diverse geomorphic and climatic zones—from the high-altitude eastern Pamir Mountains to the semi-arid southern depressions—encompassing parts of both the Pamir and Oloy mountains (Siegfried et al., 2012). The runoff in the Vakhsh River is determined by two major tributaries, the Surkhob and Khingov rivers (see Fig. 1), which drain catchments of approximately 7280 and 6660 km2, respectively, and their catchments exhibit distinct orographic and climatic characteristics. Extensive glaciation occurs in the western Pamir-Оlоy transition zone at the junction of the Tianshan and Pamir mountains, giving rise to strong spatial variability of the precipitation, temperature, and meltwater contribution.
Fig. 1. Overview of the study area.
The Surkhob River Basin occupies the central part of the Vakhsh River Basin and is characterized by a dry, strongly continental mountain climate. Winter is influenced by cold polar air masses, while moist intrusions from the Mediterranean and Iranian regions produce unstable spring weather and high inter-annual climatic variability.
Meteorological records indicated that the mean temperature in January is ranging from -25.18°C to -20.10°C in the upper valleys and the summer average temperature is ranging from 22.05°C to 23.05°C, but it reaches 30.30°C in the lower Vakhsh Valley. The annual precipitation generally ranges from 140 to 300 mm and is concentrated in winter and spring. In contrast, the climate in the southern Khingov River Basin is more humid under the influence of southwestern moisture-bearing flows and western polar air intrusions. The month mean temperature varies by approximately 29.30°C. In the valleys, it rises above 0.00°C in early March, while near the glacier zone, it reaches 0.00°C in mid-July. The annual precipitation varies widely from 600 to 1200 mm, peaking in April and reaching the minimum value during July-September, which coincides with the main glacier ablation period. In summer, the mean temperature decreases from 25.20°C at 2600 m a.s.l. to below 7.13°C near the snow line (approximately 4400 m a.s.l.).
Hydrologically, the Surkhob and Khingov rivers supply the bulk of the summer and autumn runoff to the Vakhsh River through snow and glacier melting, together generating roughly 29.00% of Tajikistan’s total river runoff and approximately 17.00% of Central Asia’s renewable water resources. This makes the Vakhsh River Basin not only a key hydrological system but also a critical source of national irrigation and hydropower supply for Tajikistan.

2.2. Data sources

This study utilized long-term meteorological observations from the Rasht (39°00′N, 70°18′E) and Sangvor meteorological (38°42′N, 70°28′E) stations to analyze the temperature and precipitation change trends in the Surkhob and Khingov river basins during 1933-2020. Then, we used data from the Darband hydrological station (38°41′N, 69°59′E) to analyze the hydrological regime and provided key information for assessing runoff and managing the water resources of the Vakhsh hydropower cascade.
The dataset included periods with missing observations caused by temporary station outages (e.g., 1996-2010 for the Sangvor meteorological station and 1996-2005 for the Rasht meteorological station). In the statistical analysis and regression modeling, these intervals were excluded to ensure the accuracy and comparability of the time series.
The hydrological regime in the Khingov and Surkhob river basins is shaped by the complex interplay of climatic conditions, topographic characteristics, and glacier dynamics. To assess these interactions, we utilized a comprehensive dataset from multiple sources, including long-term hydrological observations from state stations (during 1958-2018 provided by the Sangvor meteorological station and during 1940-2018 provided by the Rasht meteorological station); official reports from the Hydrometeorological Agency of the Republic of Tajikistan; glacier data from scientific publications, theses, and monographs; and expert information obtained through the national and international glaciological programs.
This study selected time series with the minimal gap during the period of 1940-2018 to ensure the reliability of the analysis. Data influenced by regulated reservoirs or upstream human-induced changes were excluded to preserve the natural hydrological signal, which is essential for glaciohydrological modeling and evaluating long-term trends in runoff under climate change.

2.3. Methods

In this study, we employed an integrated approach to assess the climate change characteristics, river runoff variability, and glacier dynamics in the Vakhsh River Basin, including its main tributaries—the Khingov and Surkhob rivers. This study analyzed the change trend of temperature (1933-2020), precipitation (1970-2020), and river runoff (1940-2018), as well as forecasted the Vakhsh River runoff during 2019-2040 using the exponential triple smoothing (ETS) method.

2.3.1. Analysis of temperature and precipitation change trends

This study applied an integrated approach based on descriptive statistics and linear regression methods to analyze the climate change in the Surkhob and Khingov river basins. Then, we used long-term meteorological observations from the Rasht and Sangvor meteorological stations. Periods with missing data (e.g., 1996-2010 for the Khingov River Basin and 1996-2005 for the Surkhob River Basin) were excluded from the regression analysis.

2.3.2. Linear regression analysis of river runoff dynamics

This study conducted an assessment of the long-term variation of the annual and seasonal river runoff using historical data from the Darband hydrological station in the Vakhsh River Basin. Monthly and annual runoff data were compiled for the period of 1940-2018. However, many stations experienced significant data gaps, particularly after the 1990s.
Therefore, this study developed pairwise linear regression models using data from the Khingov and Surkhob rivers with strong correlation coefficients (r≥0.6) to reconstruct the missing data. For example, we reconstructed missing data during 1940-1946 and 1957-1976 for the Vakhsh River at Darband hydrological station based on runoff data from the Tutkaul and Sariguzar hydrological stations. As a result, seasonal and annual runoff series with the minimal data gap were generated, excluding a few years (1920-1922 and 1924) in which the correlations were insufficient or data were unavailable.

2.3.3. Forecasting river runoff using the exponential triple smoothing (ETS) method

For forecasting the future dynamics of the Vakhsh River’s runoff, this study adopted the ETS method in Microsoft Excel (version 2302) (Microsoft Corporation, Redmond, the USA). This approach builds upon the methodology proposed in the seminal study conducted by Petrov (2007) for the same river, in which as table 66 a runoff cycle was identified.
In this study, we confirmed and refined this pattern using an extended dataset during 1932-2018. A Fourier series approximation was applied to describe the cyclical component:
${\displaystyle {\sum }_{t=1932}^{t=2018}\Delta {W}_{t}}={\alpha }_{0}+{\displaystyle {\sum }_{n=1}^{4}({\alpha }_{n}}\mathrm{sin}n\text{π}{T}_{\text{norm}})$
${T}_{\text{norm}}=\frac{t-1932}{{T}_{\text{cycle}}}$
where ∆Wt is the total runoff difference (m3) between the normalized year t and the average year; α0 is the constant term in the Fourier series; α is the amplitude coefficient of the harmonic components that characterize the cyclic fluctuations of the river runoff; n is the harmonic number in the Fourier series; Тnorm is the normalized year (a); and Tcycle is the cycled year (a). These parameters of the Fourier series, including α0, α1, α2, …, α86, were used to approximate the cyclic variation:
${\displaystyle {\sum }_{N=1}^{86}\Delta {W}_{N}}={\alpha }_{0}+{\alpha }_{1}{N}^{1}+{\alpha }_{2}{N}^{2}+\cdots +{\alpha }_{8}{}_{6}{N}^{8}{}^{6}$
where WN is the total annual runoff (m3) in the Nth year; and N is the year number (N=1, 2, …, 86, corresponding to the specific years of 1932, 1940, …, 2018, respectively).
The accuracy of Equation 1 is comparable to that obtained by Equation 3. However, using Equation 3 is not only technically more complicated, as it requires 15 decimal places for the coefficients, but is also impractical for extrapolation beyond the studied period (1932-2018), which is essential for forecasting future runoff—the primary objective of this study. The ETS method was chosen as a modern alternative to Petrov’s Fourier series decomposition because it does not impose strict assumptions about precise cycle periodicity, allows the modeling of more complex dynamics, and is a standard forecasting tool. The ETS method decomposes the time series into three components: trend, seasonal, and random, automatically optimizing the smoothing parameters (δ, β, and γ) to minimize forecast errors. Here, δ is the level smoothing parameter, which controls the rate at which the model adapts to the baseline level changes of the series; β is the trend smoothing parameter, which is responsible for adjusting the dynamics of the trend; and γ is the seasonal smoothing parameter, which determines the amplitude and adaptation speeds of seasonal fluctuations.

3. Results

3.1. Temperature change trends

The temperature dynamics in the Surkhob and Khingov river basins were analyzed using long-term observations (1933-2020) from the Rasht and Sangvor meteorological stations, respectively. The annual mean temperature, standard deviation, and extreme values were computed to assess the central tendencies and inter-annual variability. Linear regression was employed to quantify the temporal trends and determine the direction and magnitude of the changes (Fig. 2).
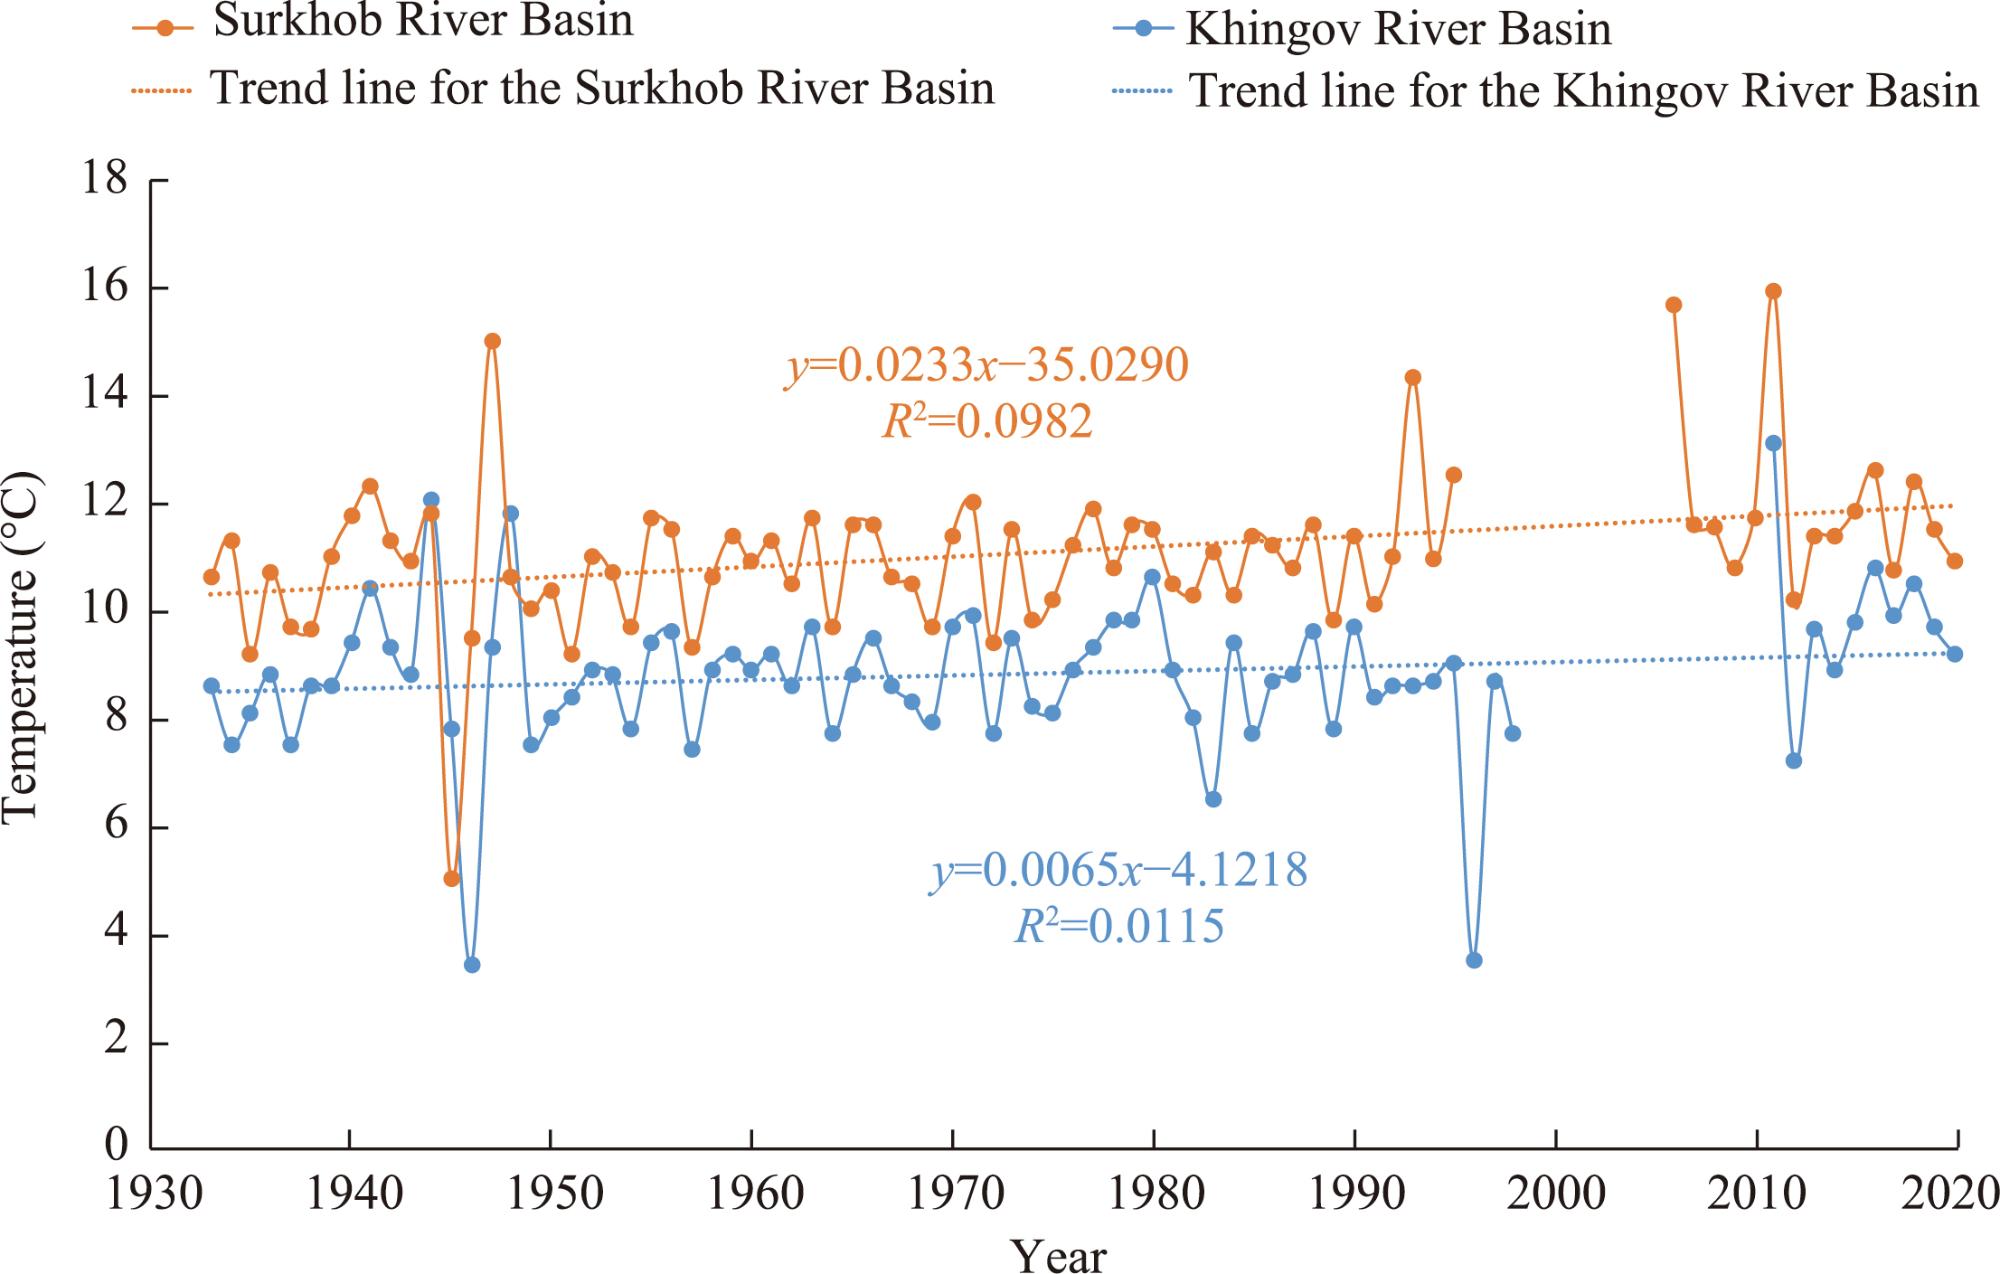
Fig. 2. Annual mean temperature change trend in the Surkhob and Khingov river basins using the data from the Rasht and Sangvor meteorological stations during 1933-2020. The Rasht meteorological station was not operational during 1999-2010 and the Sangvor meteorological station was not operational during 1996-2005.
Khingov and Surkhob river basins exhibited a statistically significant warming trend. The annual mean temperature increased by 0.02°C in the Surkhob River Basin, while the annual mean temperature change rate was 0.01°C in the Khingov River Basin. Despite the lower rate at higher elevations, both records indicated the occurrence of persistent regional warming consistent with broader climatic trends across the high-mountainous regions of Central Asia. The long-term average exhibited a progressive increase in temperature from 1933-1960 to 1990-2020, and the most rapid increase occurred during 1990-2020 (Table 1).
Table 1 Annual mean temperature at the Rasht and Sangvor meteorological stations and its change trend during 1933-2020.
Period Sangvor meteorological station (°C) Rasht meteorological station (°C) Change trend
1933-1960 8.72 10.73 Baseline level
1960-1990 8.81 11.13 Moderate warming
1990-2020 9.51 11.92 Accelerated warming
Following the Intergovernmental Panel on Climate Change (IPCC) climatic period classification scheme, Figure 2 shows three distinct stages: (i) 1933-1960, a relatively stable baseline with minor fluctuation; (ii) 1960-1990, a transitional phase with moderate warming linked to the onset of global climate change; and (iii) 1990-2020, the modern period of accelerated warming. During 1990-2020, the annual mean temperature increased by 1.19°C at the Rasht meteorological station and 0.79°C at the Sangvor meteorological station, with respective peak values of 15.95°C and 13.12°C recorded in 2011, respectively. The stronger warming observed at the Rasht meteorological station reflected the enhanced sensitivity of the mid-elevation regions to regional climatic forcing, while the weaker warming at the Sangvor meteorological station likely resulted from glacier-induced buffering and the orographic moderation effect.

3.2. Precipitation change trends

The long-term precipitation trend (1970-2020) was analyzed using data from the Rasht and Sangvor meteorological stations. The annual precipitation was examined to determine the mean values, standard deviations, and regression parameters and to evaluate the temporal variation of the annual precipitation (Fig. 3). The annual precipitation in Khingov and Surkhob river basins exhibited weak positive long-term trends, with the increase rates of 2.99 and 2.80 mm/a, respectively. Khingov (R2=0.0351) and Surkhob (R2=0.0901) river basins indicated high inter-annual variations, because of the typical complex topography which is affected by both westerly winds and the monsoons.
Fig. 3. Annual mean precipitation change trend in Surkhob and Khingov river basins using the data from the Rasht and Sangvor meteorological stations during 1970-2020. The Sangvor meteorological station was not operational during 1999-2010.
The period-based analysis revealed the occurrence of distinct hydroclimatic phases. During 1970-1990, the mean annual precipitation was 879.20 mm in the Khingov River Basin and 702.70 mm in Surkhob River Basin, and there were substantial fluctuations driven by episodic extreme events. During 1990-2010, the mean annual precipitation in Khingov and Surkhob river basins slightly rose to 902.50 and 722.40 mm, respectively, while the mean annual precipitation in Khingov and Surkhob river basins were 988.80 and 810.90 mm during 2010-2020, respectively (a wetter period). The regression slopes increased during 2010-2020 (up to 4.00 mm/a), suggesting the increase of humidification, which was likely associated with the strengthen of regional moisture transport under the warming climate.

3.3. Hydrological characteristics of runoff

3.3.1. Inter-annual runoff variation

The Vakhsh River, which plays a crucial role in hydropower and irrigation in the region, exhibited nearly stable river runoff during 1940-2018. Trend analysis of the long-term mean annual runoff revealed the occurrence of a slight decreasing tendency (less than 1.00%) and minor variation (Fig. 4). Analysis of the inter-annual runoff change at the Darband hydrological station under natural flow conditions indicated the presence of annual fluctuations in runoff. Originating in the zone of the maximum glaciation, the Vakhsh River is characterized by a relatively low level of the annual runoff variation. Despite the significant roles of glaciers and perennial snow in feeding the Vakhsh River, similar to other rivers in the region, its primary source of runoff remained seasonal snow cover. Analysis of the rivers with a glacier-snow feeding regime confirmed that the annual runoff remained practically unchanged. Evaluation of the time series of the annual runoff does not currently allow for a definitive conclusion regarding the presence of persistent directional changes in the long-term variation of the water resources in the region.
Fig. 4. Annual mean runoff variation of the Vakhsh River using the data from the Darband Hydrological station during 1940-2018. Darband Hydrological station was not operational during 1998-1999.
The stability of the annual runoff is primarily attributed to the low inter-annual variation of the seasonal snow reserves in the high-mountain regions, as well as the functioning of a compensatory mechanism. During low-snow years, increased melt from perennial snow and glaciers contributes to maintaining runoff levels, while during high-snow years, excess solid precipitation is partially stored in the form of glacier mass and persistent snow cover. Rivers with glacier-snow and snow-rain feeding regimes generally exhibit positive trends in the annual runoff. Long-term hydrological records have revealed that there is a degree of synchronous variability in river runoff, which is characterized by alternating periods of increased and decreased water availability, with a recurrence interval of approximately 2-3 a. More prolonged phases of drought or high-flow conditions may persist for 4-5 a.

3.3.2. Intra-annual runoff distribution

The monthly distribution of river runoff reflects the specific features of its hydrological regime, which is shaped by the sources of the river water supply and the annual dynamics of the water balance components. In the mountainous regions, climatic factors—largely influenced by the orographic and altitudinal characteristics of the basin—play a decisive role in shaping the intra-annual runoff patterns. This study analyzed the monthly runoff data to evaluate the changes in the seasonal runoff distribution. Figure 5 presents a comparative assessment of the intra-annual runoff pattern during two periods: 1940-1990 and 1991-2018. The results revealed that the proportion of spring runoff increased in the latter period (1991-2018) compared with the earlier period of 1940-2018, particularly in the river basins characterized by glacier-snow and snow-glacier feeding regimes.
Fig. 5. Percentage of monthly runoff in the Vakhsh River during 1940-1990 and 1991-2018.
The Vakhsh River revealed a 0.40%-0.80% increase in the runoff from March to June. In addition, during July-August, a 1.10%-1.50% decrease in the runoff occurred. The change of the runoff during autumn-winter was the minimal and practically negligible. Analysis of seasonal runoff dynamics indicated that, the regardless of their feeding types, the runoff of the most rivers increased in Tajikistan during 1990-2018. The average increase of the runoff during the vegetation period (April-September) for the glacier-snow-fed rivers ranged from 2.00% to 4.00%. As shown in Figure 6, an increase in the runoff of the Vakhsh River increased by approximately 2.00%.
Fig. 6. Runoff change trend in the Vakhsh River Basin during 1940-2018.

3.3.3. Change trends in the annual maximum and minimum runoff

In addition to assessing the runoff change during the vegetation period, this study analyzed the extreme annual runoff, encompassing the absolute maximum and minimum runoff. The long-term dynamics of the maximum and minimum runoff of the Vakhsh River are presented in Figure 7. A consistent decreasing trend in the annual maximum runoff was identified across all of the studied rivers. It should be noted that since the 1980s, most of the extremely high flow events in the Vakhsh River Basin have not been recorded, and the coefficient of variation for the runoff has exhibited a decreasing trend.
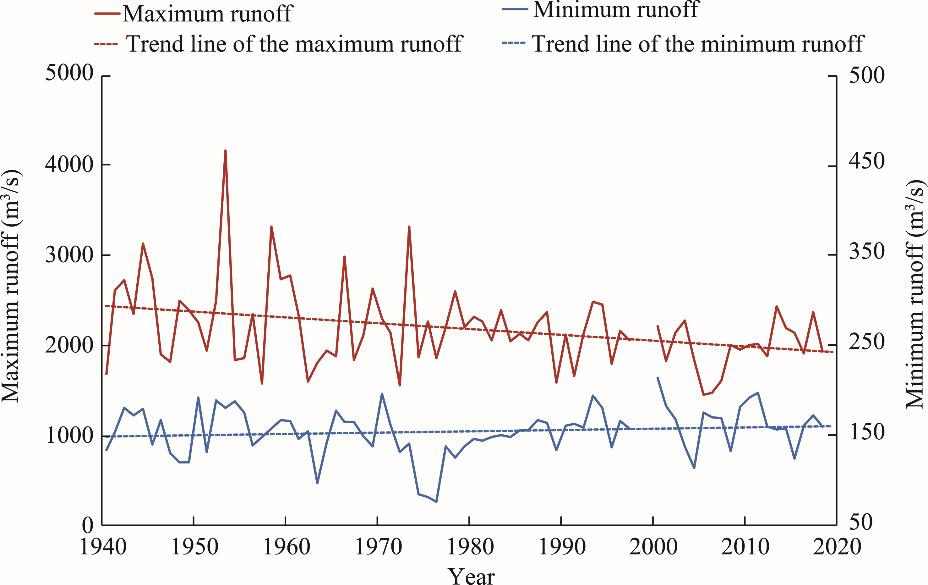
Fig. 7. Long-term change trend of the annual maximum and minimum runoff in the Vakhsh River during 1940-2018.
Simultaneously, in those regions where the average winter temperatures have been continuously rising, the annual minimum runoff has shown an upward trend, which was likely associated with the increased contribution of meltwater in winter. In the Vakhsh River Basin, an increase in the minimum runoff was less pronounced, which can be explained by the specific features of the basin’s hydrological regime and feeding sources.

3.3.4. Estimation of future river runoff trend

The overall variation of river runoff can be determined by three main factors: a long-term trend associated with global climate change, cyclic fluctuations linked to climatic cycles, and random variations (Petrov, 2007). This sudy used the ETS method to predict the future trend of the runoff in the Vakhsh River. Figure 8 presents the annual runoff variation at the Darband hydrological station during the observation period of 1932-2018. Ordinate axis represents deviations from the long-term average runoff throughout the entire observation period rather than the absolute runoff, which can enhance the clarity of the graph.
Fig. 8. Actual and forecasted river runoff differences in the Vakhsh River during 1932-2040.
The slope of the linear trend line was close to zero (Fig. 8), indicating the absence of a significant directional change in the runoff within the Vakhsh River Basin during 1932-2018, which may be due to global climate change. This conclusion is further supported by the extremely low R2 (0.0080) of the trend line, which reflects the weak statistical significance of the identified trend.
In this study, time series forecasting was performed using the ‘FORECAST.ETS function’ in Microsoft Excel (version 2302). The input data consisted of the runoff difference from the annual mean runoff during 1932-2018. The resulting forecast trajectory of the time series was extrapolated to the period of 2019-2040.
The modeling results revealed the occurrence of both positive and negative anomalies in the forecasted time series trajectory. The highest positive difference was 7.607×10⁸ m3 in 1969, while the lowest difference was -5.496×10⁸ m3 in 1989. Forecasted runoff difference reflects the wave-like dynamic change during 2019-2040, with successive alternating phases of increase and decrease in runoff difference values. According to the modeling results, this study expected that the maximum positive runoff difference (2.504×10⁸ m3) will occur in 2026, while the minimum runoff difference (-3.268×10⁸ m3) will occur in 2035.

4. Discussion

4.1. Impact of climate change

A comparison of local observations with global climate models (CMIP6) presented in the Sixth Assessment Report of the IPCC (2022) revealed that our projection had a high level of consistency with the averaged regional projections. According to the RCP4.5 (where RCP is the Representative Concentration Pathway) SSP2-4.5 (where SSP is the Shared Socioeconomic Pathway) scenario, by the end of the 21st century, the mean temperature in Central Asia may increase by 1.80°C-2.60°C relative to the pre-industrial period. Under the more extreme RCP8.5 (SSP5-8.5) scenario, the projected mean temperature will increase by 3.70°C-5.30°C.
The observed warming trend in the Surkhob River Basin currently corresponds to the RCP4.5 scenario, while the realization of the RCP8.5 pathway implies the acceleration of the temperature rise after 2050 in the absence of effective mitigation of anthropogenic emissions. These findings are consistent with regional studies that have reported intensified elevation-dependent warming in the Vakhsh River Basin (Qin et al., 2009; Ahmed et al., 2017; Gulakhmadov, 2022).
The precipitation projections based on CMIP6 models and IPCC (2022) assessments reveal the following trends: under RCP4.5 scenario, the annual precipitation may increase by 5.00%-10.00% by 2100 (mainly in winter), while under RCP8.5 scenario, the seasonal and inter-annual variabilities are expected to intensify, with increasing winter precipitation and a higher risk of summer droughts and floods. The shift in the seasonal precipitation distribution may alter the snow accumulation patterns and melting timing, substantially influencing the hydrological regime of glacier-fed basins, including the Vakhsh River Basin.

4.2. Response of river runoff to climate change

Our analysis has confirmed that the seasonal runoff patterns of the Khingov and Surkhob rivers are characterized by a pronounced high-water period in spring and summer, during which approximately 90.00% of the annual runoff is generated from March to October. The peak runoff occurred during July-August for the Khingov River (up to 482.00 m3/s) and during June-July for the Surkhob River (up to 814.00 m3/s), while the lowest runoff for the Khingov River occurred in February (34.50 m3/s) and the lowest runoff for Surkhob River also occurred in February (103.00 m3/s) (Konovalov and Shchetinnikov, 1991; Water Resources of Tajikistan, 2003).
The main sources of the river runoff include glacier meltwater, snowmelt, groundwater inflow, and atmospheric precipitation (less than 4.00%). In the upper reaches of the Khingov River, the contribution of glacier melt reaches 44.00%, but it decreases to 22.00% in the downstream of the river; while snow melt accounts for approximately 48.00%, and groundwater accounts for approximately 30.00%. In the Surkhob River, the proportion of glacier meltwater varies from 5.00% to 25.00%, and it reaches 51.00% at the Darband hydrological station during the ablation period, while snowmelt contributes to 37.00%-64.00%.
The ETS method forecasts that the river runoff will exhibit a cyclic, wave-like dynamic during 2019-2040, which is consistent with the seasonal structure and the influence of glacier-snow feeding. The ETS model achieves good agreement with the observed series and is suitable for short- and medium-term planning; however, as a statistical approach, it does not explicitly account for the physical processes involved (snowmelt, glacier dynamics, and evaporation). Therefore, for long-term strategic modeling, it is recommended to adopt a hybrid approach. For instance, short-term predictions can use the ETS and statistical methods, while scenario analysis and the assessment of the impact of climate change can be conducted by combining physical-based models (such as soil and water assessment tools and spatial process models in hydrology).
Comparison with the results of Gulakhmadov et al. (2020) using the soil and water assessment tool model under CMIP5 scenarios (RCP4.5 and RCP8.5) revealed that their results generally agree with this study: an increase in the annual mean temperature and runoff is expected by the end of the 21st century. Moreover, the shift in the high-runoff peak from June to July indicates the earlier onset of floods under warming conditions and corresponds well with the trends identified in our research.

5. Conclusions

This study provided a comprehensive assessment of historical and projected hydrological changes in the Vakhsh River, a key source of Tajikistan’s river runoff and hydropower supply. Long-term observations revealed a significant warming trend and a modest but spatially variable increase in precipitation. Despite the relative stability of the annual mean runoff, seasonal redistribution has occurred, characterized by enhanced spring runoff and reduced summer flows, which has been primarily driven by accelerating glacier melting compensating for declining snowmelt.
Projections have indicated the occurrence of alternating wet and dry phases and increased runoff variability during 2019-2040, suggesting the occurrence of increasing instability of regional water resources under climate change. These results highlight the strong sensitivity of the Vakhsh River’s hydrological patterns to temperature and precipitation changes, emphasizing the need for adaptive management strategies that integrate climate projections into water allocation, irrigation, and hydropower planning.
Although the applied statistical forecasting approach (the ETS method) provides valuable insights, further refinement using physically based hydrological and glacier-runoff models is essential to reducing uncertainties and improving projections of extreme flow events. Overall, this study enhances the understanding of the hydroclimatic response of basins in high-mountain regions of Central Asia and offers a scientific basis for sustainable water resource management under the warming climate.

Authorship contribution statement

Nasrulloev FARHOD: writing - original draft; CHEN Yaning: funding acquisition, project administration, supervision, validation, and writing - review & editing; Sheralizoda NAZRIALO: formal analysis and software; Gulahmadov NEKRUZ: data curation and methodology; Shobairi SEYED OMID REZA: conceptualization and visualization; and Murodov MURODKHUJA: data curation and methodology. All authors approved the manuscript.

Declaration of conflict of interest

The authors declare that they have no known competing financial interests or personal relationships that could have appeared to influence the work reported in this paper.

Acknowledgements

The research was supported by the National Natural Science Foundation of China (W2412135). The authors gratefully acknowledge the Agency for Hydrometeorology of the Committee for Environmental Protection under the Government of the Republic of Tajikistan for providing the hydrometeorological observation data.
[1]
Ahmed K., Shahid S., Chung E.S., et al., 2017. Spatial distribution of secular trends in annual and seasonal precipitation over Pakistan. Climate Research. 74(2), 95-107.

DOI

[2]
Aizen V.B., Aizen E.M., Melack J.M., 1995. Climate, snow cover, glaciers, and runoff in the Tien Shan, Central Asia. JAWRA Journal of the American Water Resources Association. 31(6), 1113-1129.

DOI

[3]
Barandun M., Pohl E., Naegeli K., et al., 2021. Hot spots of glacier mass balance variability in Central Asia. Geophysical Research Letter. 48(11), e2020GL092084, doi: 10.1029/2020GL092084.

[4]
Barandun M., Pohl E., 2023. Central Asia’s spatiotemporal glacier response ambiguity due to data inconsistencies and regional simplifications. The Cryosphere. 17, 1343-1371.

DOI

[5]
Chen Y.N., Li W.H., Fang G.H., et al., 2017. Review article: Hydrological modeling in glacierized catchments of Central Asia—status and challenges. Hydrology and Earth System Sciences. 21, 669-684.

DOI

[6]
Cui Y.J., Chen L.J., Li M.M., et al., 2018. The study of watershed topography characteristics in Vakhsh River based on ZY3-DSM. The International Archives of the Photogrammetry, Remote Sensing and Spatial Information Sciences. 3, 245-252.

[7]
Eyring V., Bony S., Meehl G.A., et al., 2016. Overview of the Coupled Model Intercomparison Project Phase 6 (CMIP6) experimental design and organization. Geoscientific Model Development. 9, 1937-1958.

DOI

[8]
Gulakhmadov A., Chen X., Gulahmadov N., et al., 2020. Simulation of the potential impacts of projected climate change on streamflow in the Vakhsh River Basin in Central Asia under CMIP5 RCP scenarios. Water. 12(5), 1426, doi: 10.3390/w12051426.

[9]
Gulakhmadov A.A., 2022. Variations of the temperature and precipitation in the Vakhsh River Basin. News of the National Academy of Sciences of Tajikistan. 3(188), 152-164 (in Russian).

[10]
Hoelzle M., Barandun M., Bolch T., et al., 2019. The status and role of the alpine cryosphere in Central Asia. In: The Aral Sea Basin:Water for Sustainable Development in Central Asia. London: Routledge, 100-121.

[11]
Huss M., Hock R., 2018. Global-scale hydrological response to future glacier mass loss. Nature Climate Change. 8(2), 135-140.

DOI

[12]
ICG(International Crisis Group), 2002. Central Asia:Water and conflict (Report No.34). Osh/Brussels: International Crisis Group. [2025-04-30].https://www.files.ethz.ch/isn/28347/034_central_asia_water_conflict.pdfImmerzeel.

[13]
Immerzeel W.W., Lutz A.F., Andrade M., et al., 2020. Importance and vulnerability of the world’s water towers. Nature. 577(7790), 364-369.

DOI

[14]
IPCC (Intergovernmental Panel on Climate Change), 2022. Climate Change 2022: Impacts, Adaptation and Vulnerability. Contribution of Working Group II to the Sixth Assessment Report of the Intergovernmental Panel on Climate Change. Cambridge: Cambridge University Press.

[15]
Kayumov A.K., Arifov K.O., 2021. Prospects for the development of hydropower engineering under climatic change and glacier degradation. Tajikistan Economy. 1, 117-121 (in Russian).

[16]
Kayumov A.K., Shomahmadov A., Safarov M., 2022. Studying the relationship of meteorological parameters and snow cover in the main river basins of Tajikistan for the winter period and the beginning of spring 2017-2022. Cryosphere. 1(5), 8-39 (in Russian).

[17]
Konovalov V.G., Shchetinnicov A.S., 1991. Evolution of glaciation in the Pamiro-Alai mountains and its effect on river run-off. Journal of Glaciology. 40(134), 149-157.

DOI

[18]
Kotlyakov V.M., Osipova G.B., Tsvetkov D.G., 2008. Monitoring surging glaciers of the Pamirs, Central Asia, from space. Annals of Glaciology. 48, 125-134.

DOI

[19]
Kure S., Jang S., Ohara N., et al., 2013. Hydrologic impact of regional climate change for the snowfed and glacierfed river basins in the Republic of Tajikistan: Hydrological response of flow to climate change. Hydrological Processes. 27(26), 4057-4070.

DOI

[20]
Liang W.T., Chen Y.N., Fang G.H., et al., 2023. Machine learning method as an alternative for hydrological modeling in alpine catchments of the Tianshan region, Central Asia. Journal of Hydrology: Regional Studies. 49, 101492, doi: 10.1016/j.ejrh.2023.101492.

[21]
Normatov I.S., Goncharuk V.V., Kurbonali K., et al., 2024. Influence of natural water hydrochemistry in the Vakhsh River Basin on the water-salt regime of the irrigated agricultural land. Journal of Water Chemistry and Technology. 46(2), 93-99.

DOI

[22]
Normatov P., 2022. The Impact of Climate Change on Hydrology and Glaciation of the Zeravshan, Vakhsh and Pyanj River Basin. In: IAHS-AISH Scientific Assembly 2022. Montpellier, France

[23]
Osipova G.B., Tsvetkov D.G., Shchetinnikov A.S., et al., 1998. Catalog of Surging Glaciers of the Pamir. Moscow: Glaciological Association (in Russian).

[24]
Petrov G.N., 2007. Long-term forecast of the water flow of the Vakhsh River. News of the Academy of Sciences of the Republic of Tajikistan. 50(6), 539-545 (in Russian).

[25]
Qin J., Yang K., Liang S.L., et al., 2009. The altitudinal dependence of recent rapid warming over the Tibetan Plateau. Climatic Change. 97(1-2), 321-327.

DOI

[26]
Saks T., Pohl E., Machguth H., et al., 2022. Glacier runoff variation since 1981 in the upper Naryn River catchments, Central Tien Shan. Frontiers in Environmental Science. 9, 780466, doi: 10.3389/fenvs.2021.780466.

[27]
Schaffer N., Gascoin S., MacDonell S., et al., 2025. Editorial: Water and hazards in mountainous regions in a changing climate. Frontiers in Water. 7, 1637903, doi: 10.3389/frwa.2025.1637903.

[28]
Siegfried T., Bernauer T., Guiennet R., et al., 2012. Will climate change exacerbate water stress in Central Asia? Climatic Change. 112(3-4), 881-899.

DOI

[29]
Union of Soviet Socialist Republics Glacier Inventory, 1971. Catalog of Glaciers of the USSR. Leningrad: Gidrometeoizdat (in Russian).

[30]
Union of Soviet Socialist Republics Glacier Inventory, 1978. Catalog of Glaciers of the USSR. Leningrad: Gidrometeoizdat (in Russian).

[31]
Viviroli D., Dürr H.H., Messerli B., et al., 2007. Mountains of the world, water towers for humanity: Typology, mapping, and global significance. Water Resources Research. 43(7), W07447, doi: 10.1029/2006WR005653.

[32]
Water Resources of Tajikistan, 2003. Dedicated to the International Year of Freshwater. Dushanbe: Academy of Sciences of Tajikistan (in Russian)

[33]
Xenarios S., Gafurov A., Schmidt-Vogt D., et al., 2019. Climate change and adaptation of mountain societies in Central Asia: Uncertainties, knowledge gaps, and data constraints. Regional Environmental Change. 19(5), 1339-1352.

DOI

Outlines

/