Full Length Article

Spatiotemporal heterogeneity of runoff in Tajikistan and its driving mechanisms under climate change

  • LI Chunlan a, b, c ,
  • YU Yang a, b, d ,
  • SUN Lingxiao , a, c, * ,
  • HE Jing a, c ,
  • LU Yuanbo a, d ,
  • GUO Zengkun a, d ,
  • FANG Gonghuan a, d ,
  • Alexandr ULMAN e ,
  • Vitaliy SALNIKOV e ,
  • Ireneusz MALIK c ,
  • Małgorzata WISTUBA c
Expand
  • aState Key Laboratory of Ecological Safety and Sustainable Development in Arid Lands, Xinjiang Institute of Ecology and Geography, Chinese Academy of Sciences, Urumqi, 830011, China
  • bCele National Station of Observation and Research for Desert-Grassland Ecosystems, Cele, 848300, China
  • cPolish-Chinese Centre for Environmental Research, Institute of Earth Sciences, University of Silesia in Katowice, Katowice, 40-007, Poland
  • dCollege of Resources and Environment, University of Chinese Academy of Sciences, Beijing, 100049, China
  • eFaculty of Geography and Environmental Sciences, Al-Farabi Kazakh National University, Almaty, 050040, Kazakhstan
* E-mail address: (SUN Lingxiao).

Received date: 2025-10-14

  Revised date: 2025-12-24

  Accepted date: 2026-01-04

  Online published: 2026-03-11

Abstract

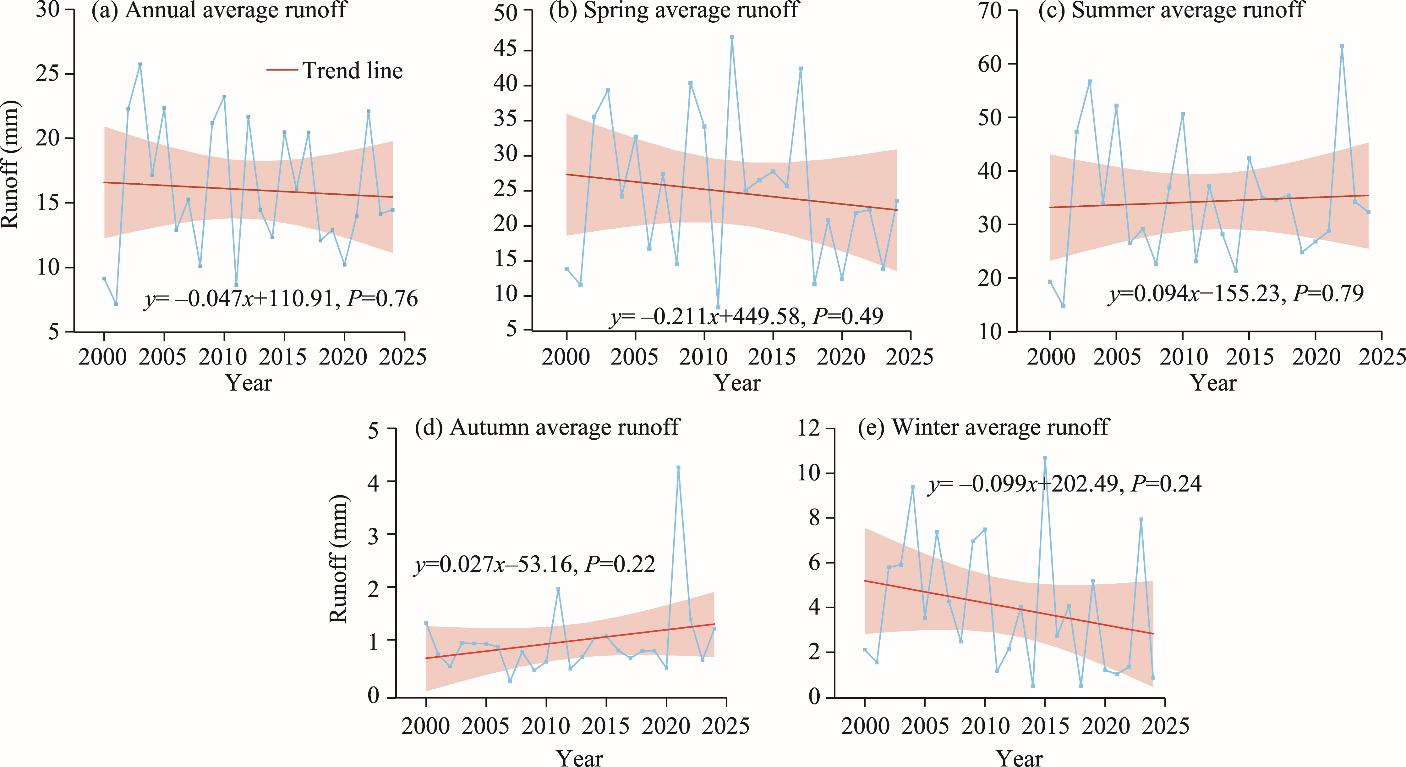
Based on monthly runoff and climate datasets spanning 2000-2024, this study employed the Theil-Sen’s slope estimation, Mann-Kendall (M-K) trend test, as well as Pearson correlation and Spearman rank correlation analyses to systematically examine the spatiotemporal patterns of runoff and its climatic driving mechanisms across Tajikistan, providing a scientific basis for sustainable water resource utilization and management in the study area. Results indicated that during 2000-2024, the annual runoff in Tajikistan exhibited statistically non-significant long-term trend (P=0.76), while displaying pronounced seasonal variability and strong spatial heterogeneity. Spring and summer average runoff primarily exhibited slight declining tendencies, while winter average runoff exhibited pronounced reduction in localized regions, such as the Syr Darya Basin, the Vakhsh River Basin, and the lower reaches of the Zeravshan River Basin. Precipitation emerged as the dominant positive driver of runoff, exhibiting moderate to strong positive correlations across over 78.00% of the country, whereas potential evapotranspiration consistently functioned as a negative driver. Rising temperatures exerted a dual competitive effect on runoff: in high-elevation, glacier-covered regions, rising temperatures temporarily increased runoff by accelerating glacier melt; however, at the national scale, the negative impact of rising temperature on runoff has played a slightly dominant role to a certain extent by enhancing evapotranspiration. Collectively, these results indicated that the present stability of runoff in Tajikistan is strongly dependent on the short-term compensatory effects of glacier melt and the risk of future runoff decline is likely to intensify as glacier reserves continue to diminish. This study provides a critical scientific evidence to inform sustainable water resource management in Tajikistan and underscores the need for glacier conservation and integrated water resource management strategies.

Cite this article

LI Chunlan , YU Yang , SUN Lingxiao , HE Jing , LU Yuanbo , GUO Zengkun , FANG Gonghuan , Alexandr ULMAN , Vitaliy SALNIKOV , Ireneusz MALIK , Małgorzata WISTUBA . Spatiotemporal heterogeneity of runoff in Tajikistan and its driving mechanisms under climate change[J]. Regional Sustainability, 2026 , 7(1) : 100297 . DOI: 10.1016/j.regsus.2026.100297

1. Introduction

Global climate change has considerably altered the hydrological cycle of the Earth system. Mountainous cold regions that primarily rely on ice- and snow-melt runoff for water supply exhibit heightened sensitivity and complex responses to climate change (IPCC, 2021; Chang et al., 2023; Xia et al., 2025). Central Asia, a typical arid-semiarid region, heavily depends on cryosphere-derived water from high-mountainous regions. Tajikistan, known as the “Water Tower of Central Asia”, is the source of major rivers such as the Amu Darya and Syr Darya. These rivers are vital for the socioeconomic development of Tajikistan and serve as a foundation for agricultural irrigation and ecological security in downstream countries, including Uzbekistan and Kazakhstan (Sorg et al., 2012; Li and Chen, 2018; Immerzeel et al., 2020). Observational data indicated that over the past five decades, Tajikistan has experienced substantial warming, leading to large-scale glacial retreat and changes in precipitation patterns, which have profoundly affected the spatiotemporal distribution of the associated runoff (Niederer et al., 2008; Hagg et al., 2013; Hu et al., 2017). Against this backdrop, systematically analyzing the spatiotemporal heterogeneity of runoff in Tajikistan and clarifying its relationships with climatic drivers holds paramount scientific and practical significance for adaptive water resource management in the country.
In recent years, numerous studies based on multisource observations and model simulations have revealed the profound impact of climate change on the hydrological cycle in Central Asia. Through global analysis, Hugonnet et al. (2021) demonstrated that glaciers, including those in the Tianshan Mountains, experienced accelerated melting between 2000 and 2019, directly affecting runoff seasonality. Siegfried et al. (2012) employed coupled models to demonstrate that climate change induced snow-ice melt directly affects seasonal runoff variation, leading to earlier spring floods and altered summer base flows. Furthermore, despite increased precipitation over the past few decades, the effects of rising winter temperatures on the hydrological cycle have become more pronounced, with considerable reductions in runoff in some basins due to the retreat of snow and ice cover (Deng et al., 2015; Chen et al., 2017). White et al. (2014) predicted that even if precipitation increases in the future, runoff in the Caspian Sea Basin may decrease by 10.00%-20.00% due to a substantial temperature rise (e.g., by 5.000℃), which is simulated by their water balance model. Additionally, increased evapotranspiration has been identified as a key factor driving future runoff reductions. Aizen et al. (2007) analyzed hydrological cycle models and demonstrated that rising temperatures lead to sharp increases in evapotranspiration, potentially causing substantial reductions of runoff in the future. Collectively, these studies highlight the nonlinear impact of climate change on runoff. The above-mentioned research reveals the complexity of runoff variation mechanisms in glacial watersheds, while at the same time, significant differences in conclusions have emerged. At a large extent, this discrepancy originates from the differences in research methods and spatiotemporal scales. For instance, by focusing on the global glacier mass balance and utilizing large-scale remote sensing techniques, Hugonnet et al. (2021) were able to effectively capture macroscale trends in glacier mass balance. However, such approaches fail to reflect microscale variability in precipitation gradients within a watershed. White et al. (2014) employed a physically water balance model capable of simulating future scenarios but highly sensitive to initial conditions and parameterization schemes. In addition, Deng et al. (2015) focused on long-term trend of climate change over nearly five decades and captured the cumulative effect of climate warming. Such differences in methodology and scale, rather than solely in geographical characteristics, are likely the primary cause of inconsistent conclusions regarding runoff driving mechanisms in Central Asia.
When the research scale shifts from large river basins to national or sub-basin levels, runoff responses exhibit substantial spatiotemporal heterogeneity. Some studies have highlighted that glacier melt, driven by rising temperature, is the primary cause of increased runoff. For instance, based on long-term statistical analysis, Karthe et al. (2015) attributed the runoff increase in Central Asia over the past few decades primarily to glacier melt. However, other studies have emphasized the dominant role of precipitation changes. For example, using the elasticity coefficient method within Budyko’s framework to analyze the Tarim River Basin of China, Shi and Gao (2022) found that increased precipitation was the main driver of the increase of runoff, contributing more than 80.00%. Additional research has indicated that the heterogeneity of runoff responses is jointly shaped by precipitation changes and basin-specific characteristics. Sun et al. (2024) demonstrated that despite the substantial contribution of glacier meltwater, regional differences in precipitation changes are equally critical. In regions dominated by westerly circulation and local convection, runoff responses to precipitation vary considerably. These research conclusions are highly dependent on the selected analytical framework. For example, long-sequence statistical methods can more easily capture the cumulative effects of glacier melt, while the elasticity method based on Budyko’s water-energy balance hypothesis emphasizes the balance between precipitation and potential evapotranspiration. The differences in theoretical foundations, along with the presence of spatial heterogeneity, further complicate the interpretation of driving mechanisms, thereby leading attribution conclusions that often emphasize different dominant factors. These debatable findings highlight that across different geographical units and periods, the dominant drivers may differ due to variations in glacier coverage, topography, and climatic conditions (Sorg et al., 2012; Zhu et al., 2024). Although model studies offer future projections, systematic analyses based on recent observational data at the national scale for Tajikistan remain limited and the spatiotemporal heterogeneity of the driving mechanisms is still unclear.
In summary, existing research is subject to the following primary limitations: (1) most studies have focused on large transboundary river basins, but have not conducted systematic comparison and mapping of spatiotemporal evolution patterns of Tajikistan at the national scale; (2) there exists a lack of comprehensive multivariable analyses using complete datasets of runoff, precipitation, potential evapotranspiration, the maximum temperature, and the minimum temperature across Tajikistan from 2000 to 2024; and (3) the mechanisms underlying how asymmetric changes in the maximum and minimum temperatures and their interaction with potential evapotranspiration jointly shape the spatiotemporal distribution of runoff remain unclear. However, accurately characterizing spatiotemporal heterogeneity is essential for subsequent quantitative attribution analysis. Using the Mann-Kendall (M-K) trend analysis, Theil-Sen’s slope estimation, and spatial analysis techniques, this study systematically characterized the annual, seasonal, and spatial evolution patterns of runoff in Tajikistan during 2000-2024 based on hydrometeorological observations, remote-sensing data, and multisource datasets. Additionally, through multivariable correlation analyses, the study explored the relationships of runoff changes with temperature, precipitation, and potential evapotranspiration patterns. Finally, this study aims to identify the dominant drivers in Tajikistan and provide a scientific basis for adaptive water resource management and enhanced regional water security.

2. Materials and methods

2.1. Study area

Tajikistan (36°40′N-41°05′N, 67°31′E-75°14′E), a typical inland mountainous country in the southeastern Central Asia, covers an area of 143,100 km2 (Fig. 1). It shares borders with China to the east and southeast, Afghanistan to the south, Uzbekistan to the west, and Kyrgyzstan to the north. Known as the “Land of High Mountains”, 93.00% of Tajikistan’s territory is mountainous regions, with over half of the country lying above an elevation of 3000 m. The terrain rises abruptly from west to east, comprising distinct geomorphological units, namely, the northern Ferghana Basin, the central mountainous ranges, the Pamir Plateau in the east, and the Vakhsh Valley in the southwest (Liu, 2010; Jiayinaguli et al., 2013).
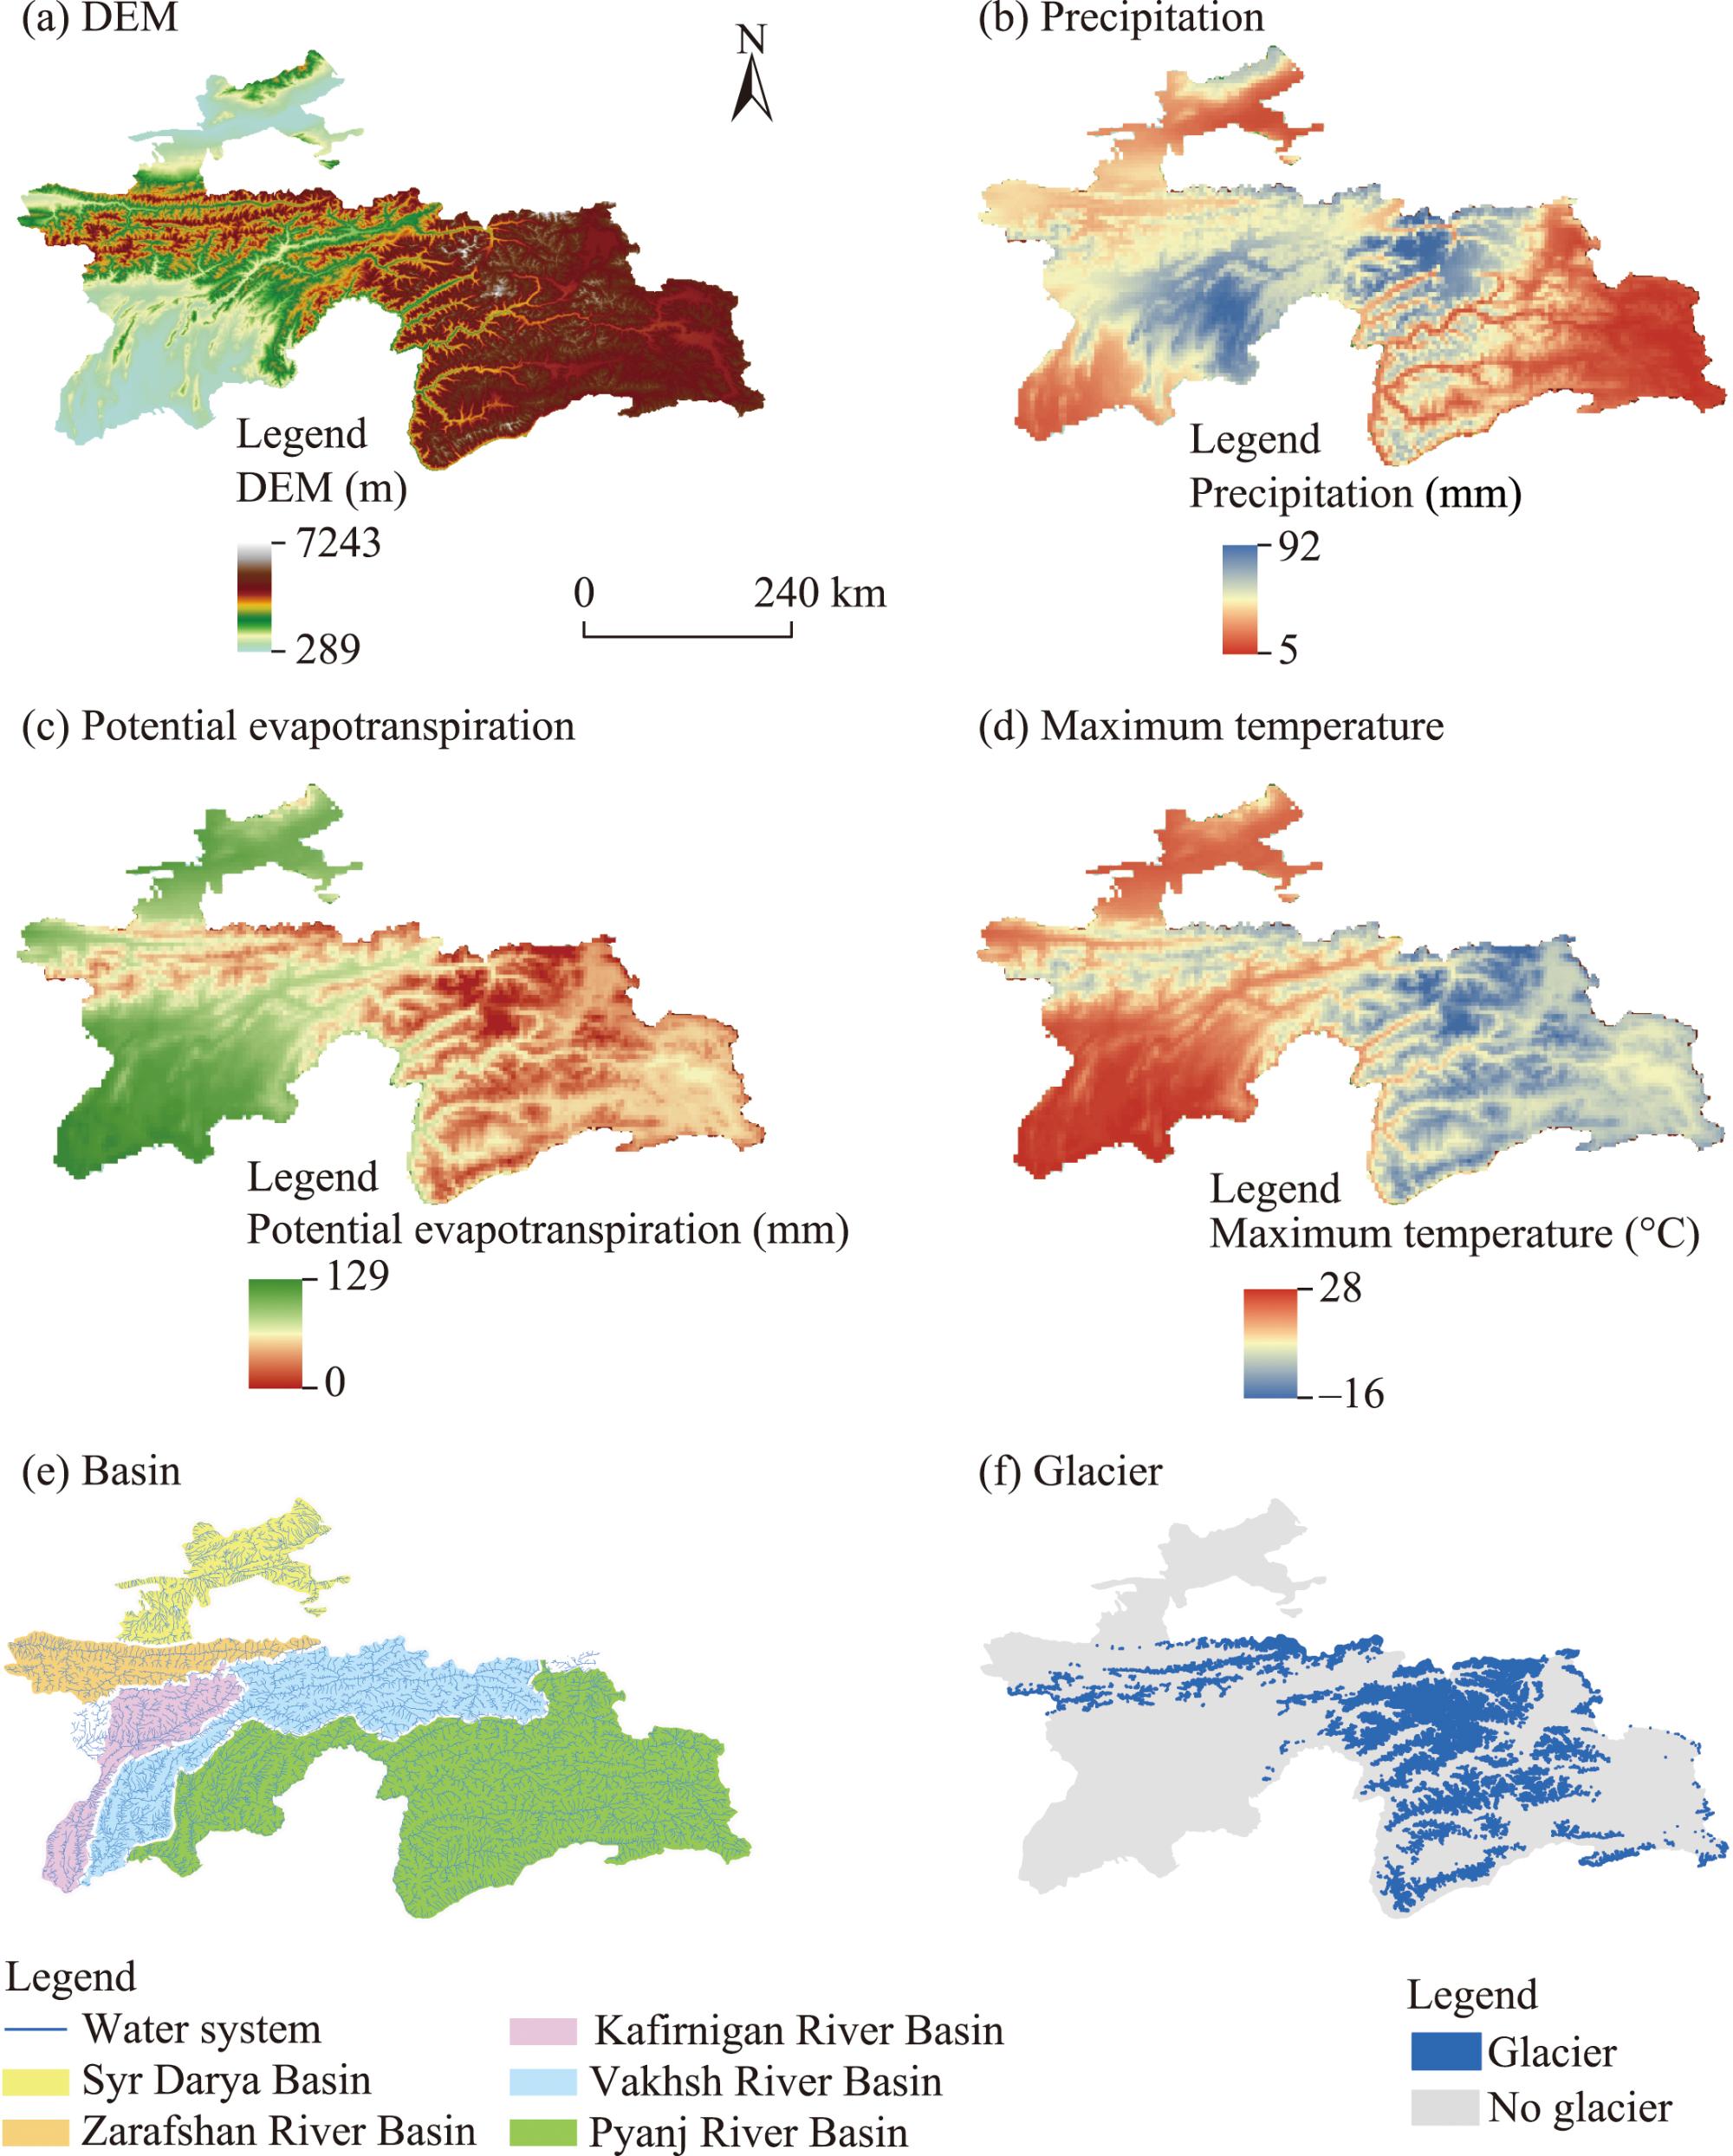
Fig. 1. Spatial distribution of DEM (a), precipitation (b), potential evapotranspiration (c), maximum temperature (d), basin (e), and glacier (f) in Tajikistan. DEM, digital elevation model. Note that the figure is based on the standard map (GS(2025)1508) of the Map Service System (http://bzdt.ch.mnr.gov.cn/download.html) marked by the Ministry of Natural Resources of the People’s Republic of China, and the boundary of the standard map has not been modified.
Tajikistan experiences a markedly continental climate with distinct vertical zonation. The climate transitions from a subtropical type in the southwestern valleys to temperate in mid-elevation mountainous regions and frigid alpine conditions above 3000 m, resulting in substantial temperature gradient from north to south (Liu, 2010). This intricate topography and climatic diversity have given rise to a dense river network dominated by the Aral Sea drainage system. Key rivers include the upper Amu Darya (Pyandzh River and Vakhsh River), Zeravshan River, and Syr Darya. Runoff primarily relies on glacier melt and seasonal snowpack, positioning Tajikistan as a critical “Water Tower of Central Asia”. The dynamics of its water resources are crucial for downstream ecological and socioeconomic stability.

2.2. Data sources and processing

The runoff and climate datasets used in this study were first released in January 2018 by John Timothy ABATZOGLOU from the Department of Geography at the University of Idaho on the Scientific Data website (https://www.climatologylab.org/terraclimate.html). The initial release data covered a monthly dataset from 1958 to 2015, which has subsequently been incrementally updated to include data through 2024. All datasets are based on the World Geodetic System (WGS) 1984 coordinate system and have a spatial resolution of 4 km. In particular, runoff, precipitation, and potential evapotranspiration were recorded in millimeters (mm), while temperature was recorded in degrees Celsius (°C). Python Geospatial Data Abstraction Library (GDAL) library was used for clipping and mosaicking the data in Tajikistan. Additionally, seasonal and interannual datasets were generated using the maximum value composite method. Seasons were defined following the standards of the World Meteorological Organization: spring (March-May), summer (June-August), autumn (September-November), and winter (December-February in the next year).

2.3. Coefficient of variation (CV)

To quantify the discrete degree and heterogeneity of the spatial distribution of runoff, this study calculated the spatial CV of runoff at the annual and seasonal scales to reflect the spatiotemporal variability of runoff in Tajikistan from 2000 to 2024. The calculation formula is as follows:
$\text{CV}=\frac{\sigma }{\mu }$
where σ is the spatial standard deviation of pixel value; and μ is the spatial mean of pixel value. A larger CV value indicates stronger spatial variability and a more uneven distribution of runoff.

2.4. Theil-Sen’s slope estimation and Mann-Kendall (M-K) trend analysis

This study combined the Theil-Sen’s slope estimation and M-K trend analysis to evaluate long-term trends and seasonal patterns in runoff (Sen, 1968; Abghari et al., 2013; Ali et al., 2019). These methods are advantageous owing to their minimal data distribution requirements and strong resistance to outliers. However, the standard M-K trend analysis needs to assume the independence of data points in a series. Hydrological time series often exhibit autocorrelation, which may compromise the accuracy of trend significance assessment. To ensure the robustness of trend analysis results, we pretested for first-order autocorrelation in the primary runoff series and found it to be non-significant (P>0.05). We then integrated the M-K trend analysis results with the actual slope rates from the Theil-Sen’s slope estimation, focusing on spatially consistent and physically meaningful trend patterns to reduce potential biases from statistical assumptions. The Theil-Sen’s slope estimation formula is as follows:
$\beta =\text{Median}\left(\frac{{x}_{j}-{x}_{i}}{j-i}\right)\text{,}\forall i<j$
where β is the Theil-Sen’s slope estimation value, representing the trend of runoff change; i and j denote the time points; and xi and xj represent the runoff values at time points i and j, respectively. In particular, β>0 indicates an increasing variation trend of runoff over the time series, whereas β<0 suggests a decreasing variation trend of runoff.
The M-K trend analysis is a nonparametric method used to evaluate the statistical significance of trends in a time series (Ahmed et al., 2017). Its calculation formulas are expressed as follows:
$Z=\left\{\begin{array}{l}{\scriptscriptstyle \frac{S-1}{\sqrt{\mathrm{var}(S)}}}\text{, }S>0\\ 0\text{,}S=0\\ {\scriptscriptstyle \frac{S+1}{\sqrt{\mathrm{var}(S)}}}\text{, }S<0\end{array}\right.$
$S={\displaystyle \sum _{i=1}^{n-1}{\displaystyle \sum _{j=i+1}^{n}\text{sgn}({x}_{j}-{x}_{i})}}$
$\text{sgn}({x}_{j}-{x}_{i})=\left\{\begin{array}{l}1\text{, }{x}_{j}-{x}_{i}>0\\ 0\text{, }{x}_{j}-{x}_{i}=0\\ -1\text{, }{x}_{j}-{x}_{i}<0\end{array}\right.$
$\text{var}(S)=\frac{n(n-1)(2n+5)}{18}$
where Z represents the standardized test statistic value for the M-K trend analysis; S is the M-K trend analysis statistic value; var(S) is the variance of S; sgn() is a sign function; and n denotes the length of the time series. In this study, a significance test was conducted on the annual and seasonal runoff trends in Tajikistan at a confidence level of α=0.05. Following the methodology reported by Ali et al. (2019), the runoff variation trends were categorized into six levels, as detailed in Table 1.
Table 1 Theil-Sen’s slope estimation and Mann-Kendall (M-K) trend analysis classification
No. S |Z| Change trend
1 S<0 |Z|≥2.58 Extremely significant decrease
2 S<0 1.96≤|Z|<2.58 Significant decrease
3 S<0 |Z|<1.96 Non-significant decrease
4 S>0 |Z|≥2.58 Extremely significant increase
5 S>0 1.96≤|Z|<2.58 Significant increase
6 S>0 |Z|<1.96 Non-significant increase

Note: S is the M-K trend analysis statistic value; Z represents the standardized test statistic value for the M-K trend analysis.

2.5. Variance inflation factor (VIF)

The VIF is a common metric for diagnosing multicollinearity among independent variables. To prevent multicollinearity among climate factors from affecting subsequent statistical analyses, this study calculated the VIF for precipitation, potential evapotranspiration, the maximum temperature, and the minimum temperature. Typically, a high VIF may require removing certain independent variables or selecting variables to address multicollinearity. Generally, when VIF<5.00, essentially no multicollinearity exists among the input variables. When 5.00≤VIF<10.00, a moderate correlation exists among the input variables, but the collinearity problem is not severe and usually does not considerably affect the analysis results. When VIF≥10.00, serious collinearity exists among the input variables, which may affect the analysis results (Islam et al., 2023; Zhu et al., 2023). The VIF is calculated using the following equation:
${\text{VIF}}_{l}=\frac{1}{1-{R}_{l}^{2}}$
where VIFl is the variance inflation factor for the lth independent variable; and R2 l is the coefficient of determination from the regression of the lth independent variable on all other independent variables.

2.6. Correlation analysis

To analyze the impact of climatic factors on runoff, this study employed the Pearson correlation coefficient to quantify the relationships between runoff and key climatic variables, including precipitation, potential evapotranspiration, the maximum temperature, and the minimum temperature. The calculation equation is as follows:
${r}_{xy}=\frac{{\displaystyle \sum _{i=1}^{n}({x}_{i}-\overline{x})({y}_{i}-\overline{y})}}{\sqrt{{\displaystyle \sum _{i=1}^{n}{({x}_{i}-\overline{x})}^{2}{\displaystyle \sum _{i=1}^{n}{({y}_{i}-\overline{y})}^{2}}}}}$
where rxy denotes the correlation coefficient, ranging from -1.000 and 1.000; x represents the runoff (mm); y represents a set of climatic variables, including precipitation, potential evapotranspiration, the maximum temperature, and the minimum temperature;
$\overline{x}$
refers to the mean runoff over the study period in Tajikistan (mm); and
$\overline{y}$
represents the mean values of the precipitation, potential evapotranspiration, the maximum temperature, or the minimum temperature during the same period. Correlation levels are classified as follows: when |rxy|>0.800, it indicates a high degree of correlation; when 0.500<|rxy|<0.800, it indicates a moderate degree of correlation; when 0.300<|rxy|<0.500 it indicates a weak degree of correlation; and when |rxy|<0.300, it indicates no correlation (Ren et al., 2017).
This study also employed the Spearman rank correlation analysis to comprehensively evaluate the relationship between runoff and climatic factors and to verify the robustness of Pearson correlation analysis results under non-normal or nonlinear relationship. The Spearman rank correlation coefficient (ρ), calculated based on variable ranks, is insensitive to data distribution and can capture monotonic nonlinear relationship. The equation is as follows:
$\rho =1-\frac{6{\displaystyle \sum {d}_{i}^{2}}}{m({m}^{2}-1)}$
where di represents the difference in ranks between the runoff value and the climate variable value for the ith observation; and m is the sample size.

3. Results

3.1. Temporal and spatial dynamic changes of runoff

3.1.1. Temporal variation of runoff

Between 2000 and 2024, runoff in Tajikistan exhibited complex interannual and seasonal variabilities. At the interannual scale, the annual average runoff indicated a slight decline (-0.047 mm); however, the high P-value (0.76) obtained from statistical tests suggested that the change is not significant (Fig. 2a). This implied that interannual runoff fluctuations are primarily driven by stochastic climatic factors, such as interannual variability in temperature and precipitation, rather than by long-term trends. The 95% confidence interval further indicated substantial uncertainty in interannual runoff variation, with significant year-to-year fluctuations potentially influenced by multiple climatic and environmental factors, such as interannual differences in precipitation and the impact of temperature changes on snow-melt.
Fig. 2. Variation trends of the annual (a), spring (b), summer (c), autumn (d), and winter (e) average runoff in Tajikistan during 2000-2024. The shaded region in the figure represents the 95% confidence interval.
At the seasonal scale, none of the runoff trends were statistically significant, but distinct differences were observed in their fluctuation characteristics. Spring average runoff (Fig. 2b) showed a slightly decreasing trend (-0.211 mm/a; P=0.49), while summer average runoff (Fig. 2c) exhibited a slightly increasing trend (0.094 mm/a; P=0.79). Autumn (Fig. 2d) and winter (Fig. 2e) average runoff demonstrated slightly increasing (0.027 mm/a; P=0.22) and decreasing (-0.099 mm/a; P=0.24) trends, respectively, both of which were not statistically significant. Except for autumn, the 95% confidence intervals for all seasons revealed considerable fluctuation ranges, reflecting the influence of complex factors, such as the distribution of seasonal precipitation and the magnitude of seasonal snow-melt, on seasonal runoff. These factors resulted in substantial year-to-year variations in runoff within the same season. Overall, runoff in Tajikistan showed non-significant variation trends at the interannual or seasonal scales.

3.1.2. Spatial distribution of runoff

The spatial distribution of runoff in Tajikistan showed that runoff exhibits significant spatiotemporal heterogeneity between 2000 and 2024 (Fig. 3). The annual average runoff indicated that high-runoff zones were predominantly located on the eastern Pamir Plateau and surrounding high-mountainous regions (Fig. 3a), with peak annual average runoff reaching 173.000 mm. A general decreasing trend from the southeastern Tajikistan to the northwestern Tajikistan was observed, reflecting the strong impact of topography and elevation on runoff. At the seasonal scale, summer exhibited the highest runoff (Fig. 3c), with the maximum value reaching 662.000 mm, notably higher than that in other seasons. The high-runoff zones were concentrated in regions with strong ice- and snow-melt water contributions, indicating that ice- and snow-melt water is the primary source of summer average runoff. Spring average runoff was the second highest (Fig. 3b), with the maximum value of 121.000 mm. High values were observed in the southwestern and central regions of Tajikistan, indicating that spring ice- and snow-melt water, combined with increased precipitation, has substantially enhanced water resources in these regions. In contrast, autumn (Fig. 3d) and winter (Fig. 3e) average runoff decreased substantially, with the maximum values of 47.000 and 50.000 mm, respectively. This may be related to reduced ice- and snow-melt water as well as the transformation of precipitation pattern under low-temperature conditions, reflecting the highly uneven seasonal distribution of runoff in Tajikistan, with typical ice- and snow-melt water as well as precipitation mixed supply characteristics.
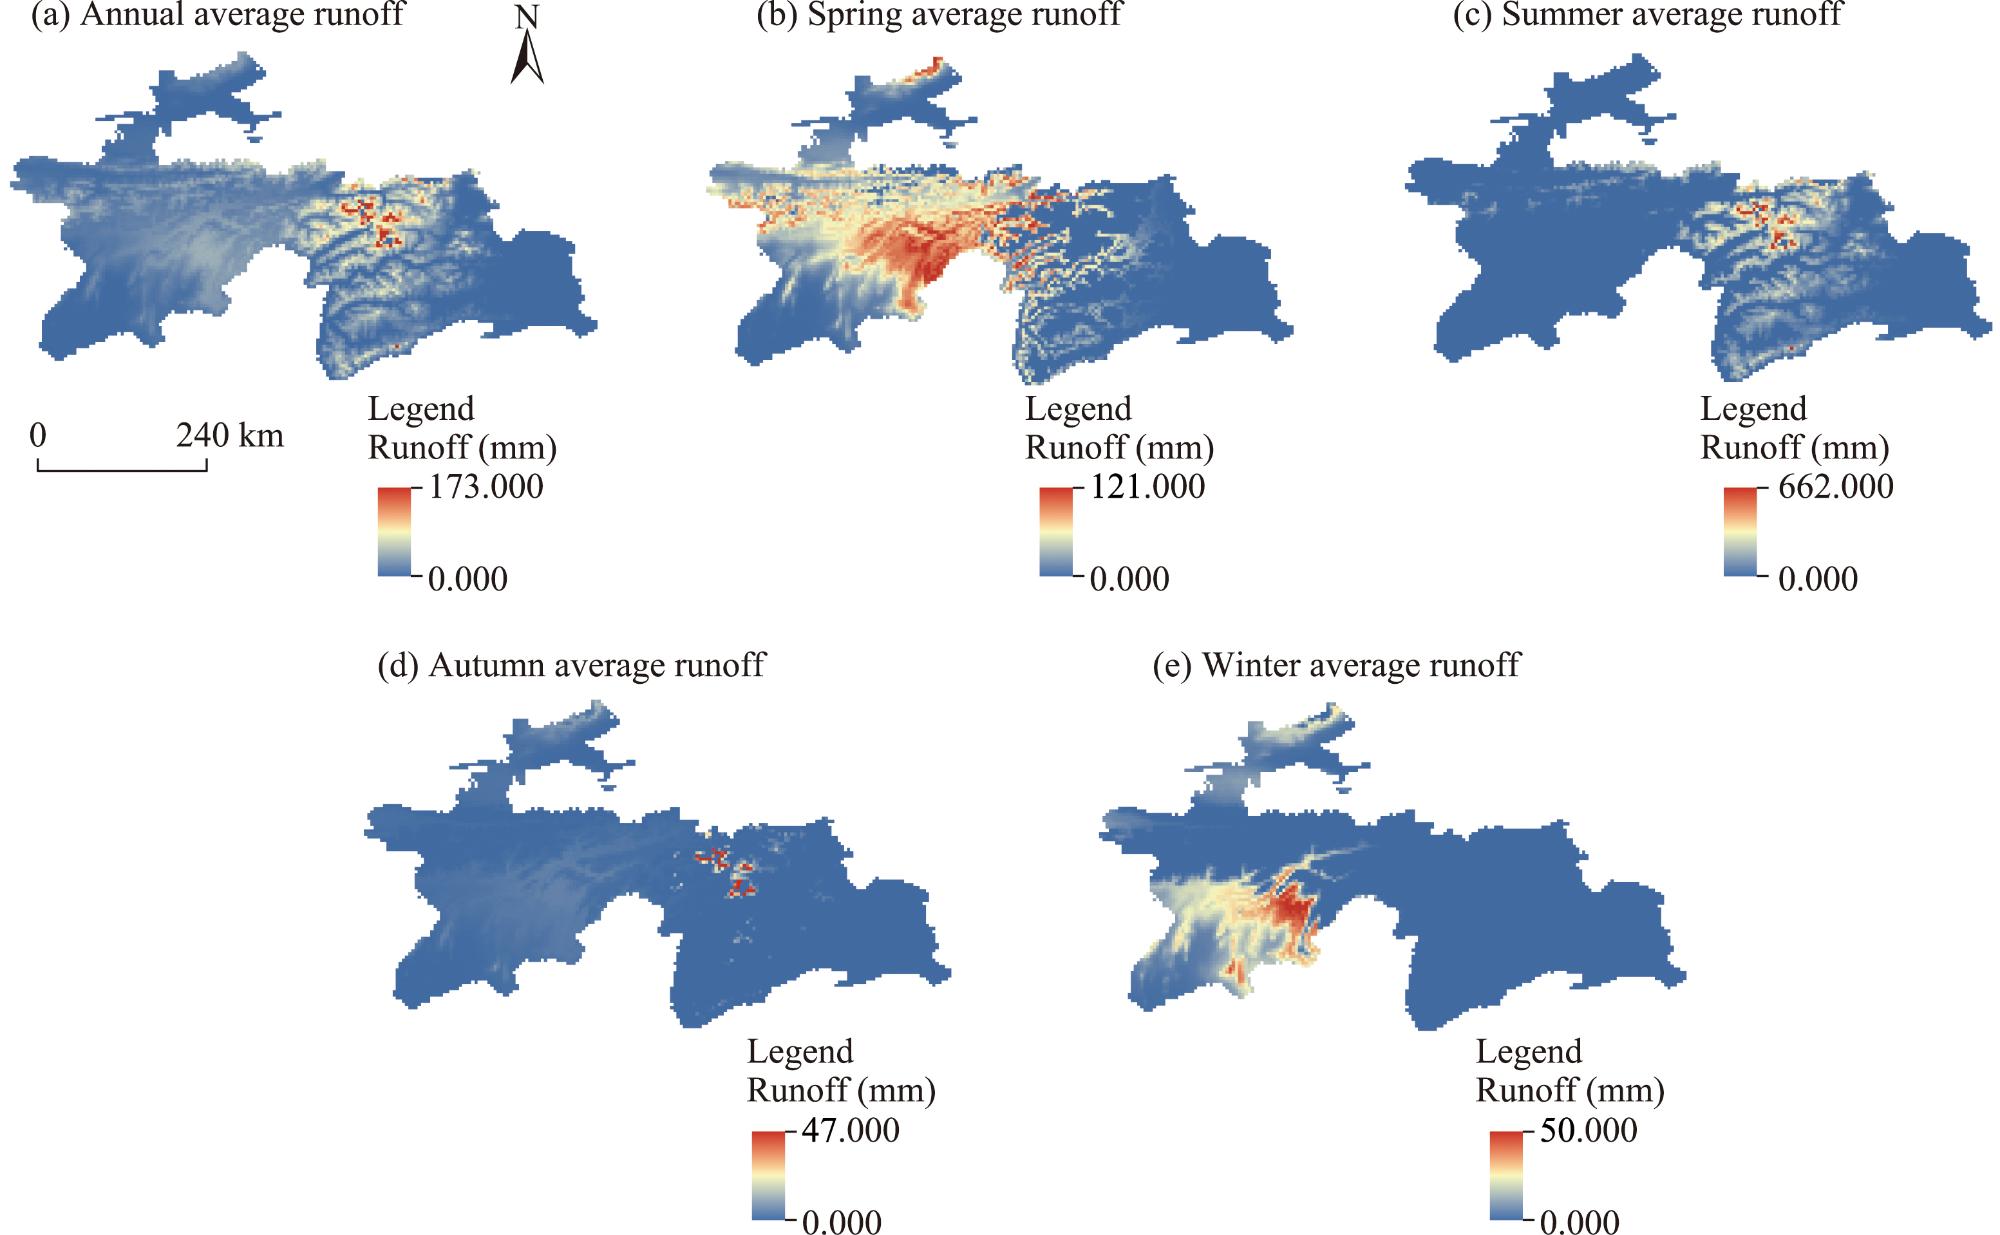
Fig. 3. Spatial distribution of the annual (a), spring (b), summer (c), autumn (d), and winter (e) average runoff in Tajikistan during 2000-2024.

3.1.3. Runoff variation degree

This study calculated runoff variation degree and its area proportion (Fig. 4; Table 2) to quantitatively evaluate spatial heterogeneity of runoff. Results indicated significant seasonal difference in the spatial variation of runoff in Tajikistan. Summer, the most hydrologically unstable season, featured a coexistence of moderate variability (45.63% of the country and high) and extremely high variabilities (totaling 48.72% of the country; Fig. 4c). Spring average runoff was mainly characterized by moderate and high variabilities (Fig. 4b), with areas accounting for 32.51% and 34.63% of the country, respectively. Extremely high variability zones were predominantly located on the eastern Pamir Plateau and in the western mountainous regions of the country, comprising 23.35% of the country. Autumn average runoff exhibited a striking “bimodal” pattern (Fig. 4d): moderate variability zones (59.03%) were predominant, while extremely high variability zones were concentrated in the western and central mountainous regions, reflecting complex hydrological processes influenced by both precipitation as well as ice- snow-melt water. Winter average runoff exhibited the most distinctive hydrological condition (Fig. 4e). Despite being dominated by stable baseflow, as much as 39.16% of the country exhibited high and extremely high variabilities. This is likely linked to the highly uneven spatial distribution of mountainous snow and winter water management activities.
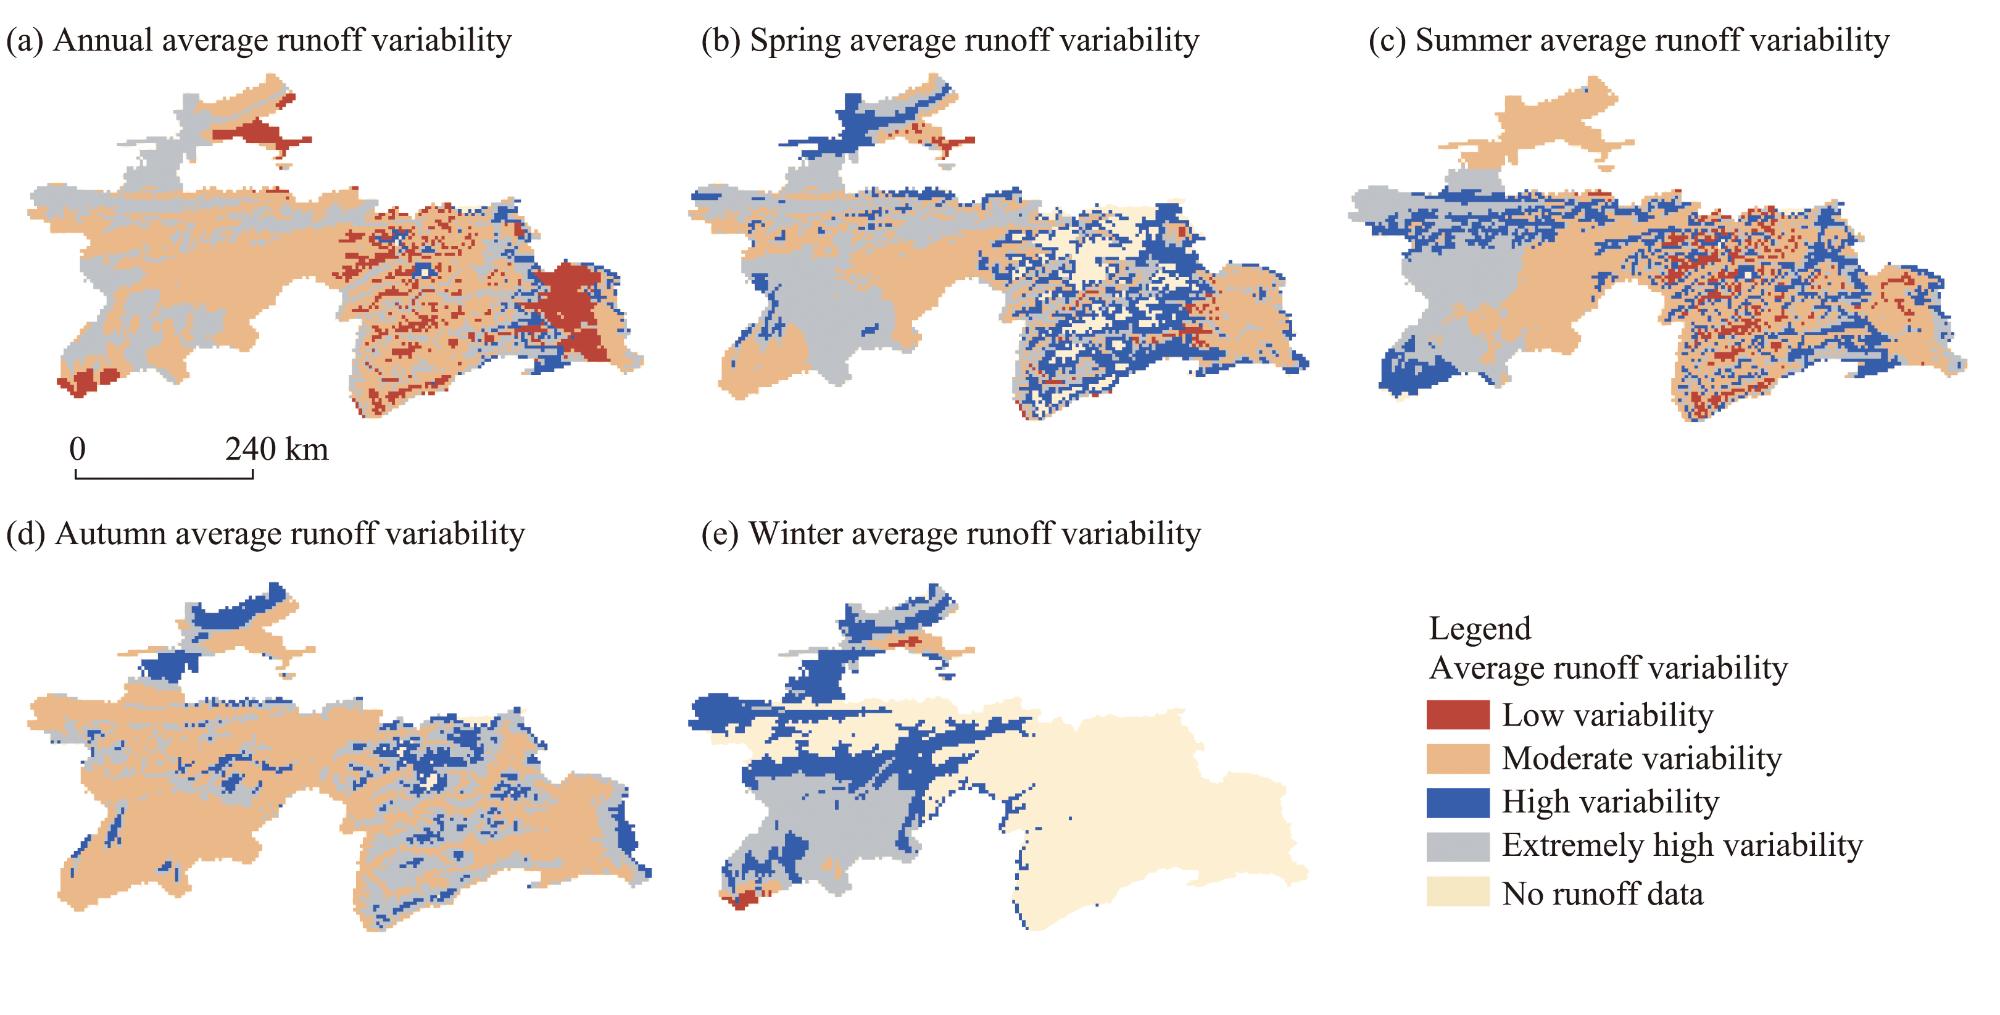
Fig. 4. Spatial distribution of the annual (a), spring (b), summer (c), autumn (d), and winter (e) average runoff variabilities in Tajikistan during 2000-2024.
Table 2 Annual and seasonal average runoff variation degree and its area proportion in Tajikistan during 2000-2024.
Coefficient of variation Runoff variation degree Area percentage of average runoff with different runoff degrees (%)
Annual average runoff Spring average runoff Summer average runoff Autumn average runoff) Winter average runoff
CV<0.3 Low variability 13.50 1.59 5.52 - 0.64
0.3≤CV<0.6 Moderate variability 51.77 32.51 45.63 59.03 1.94
0.6≤CV<1.0 High variability 30.80 34.63 26.46 28.06 17.44
CV≥1.0 Extremely high variability 3.93 23.35 22.26 12.54 21.72

Note: -, no percentage of autumn average runoff.

At an annual scale (Fig. 4a), approximately 51.77% region in Tajikistan experienced moderate runoff variability. This suggested that spatial differences and variations in recharge mechanisms offset and integrate over the course of the year. Ultimately, this yielded a relatively homogenized runoff pattern at the national scale in statistical terms. Regions with high runoff variability accounted for 30.80%, while those with extremely high variability made up just 3.93% of the country. However, these zones were primarily located on the southeastern Pamir Plateau, indicating more intense long-term hydrological fluctuations in regions with extreme topography. It should be noted that although regions with extremely high runoff variability were small, they were highly spatially concentrated and often located in key water source conservation zones. As such, they exerted a significant impact on the stability of downstream water resources.

3.1.4. Spatial variation trend of runoff

The spatial analysis of runoff variation trend was based on the Theil-Sen’ slope estimation and M-K trend analysis. The significance level for trend test was set at P<0.05, and the six categories defined in Table 1 were strictly applied.
The annual and seasonal average runoff variations across Tajikistan showed significant spatial heterogeneity. Most regions exhibited non-significant variation trends in runoff, with only isolated regions showing increases or decreases (Fig. 5). In spring, significant increases in runoff (Fig. 5b) were concentrated on the southeastern Pamir Plateau and in the western high-elevation mountainous regions, primarily within the Pyandzh and Zeravshan river basins. Increased ice- and snow-melt water is likely the primary driver of rising runoff in these high-elevation zones. In summer, regions with significant increases in runoff (Fig. 5c) were predominantly located in central Tajikistan, within the Vakhsh River Basin. In contrast, significant decreases in runoff were observed in the southwestern mid- to low-elevation regions. This is attributable to the minimal glacier coverage in these zones, resulting in a lack of sustained glacier-melt water. Additionally, enhanced summer evapotranspiration and human activities, such as agricultural irrigation diversions, may weaken or even counteract the positive effect of increased precipitation on runoff. In autumn, runoff variation trends were non-significant across most regions of the country (Fig. 5d). This reflected the unique hydrological characteristics in autumn, wherein glacier melt diminishes with falling temperatures, runoff relies primarily on base flow and soil water, and hydrological processes tend to stabilize. However, a few zones in the eastern, central, and western regions of the country showed significant increasing trends in runoff, potentially linked to precipitation patterns and basin topography. Winter runoff variation trends were also largely non-significant nationwide (Fig. 5e), consistent with the natural pattern of the minimal glacier melting under low temperatures and stable base flow-dominated hydrological processes. Nevertheless, significant decreases in runoff were observed in the southwestern low-elevation regions, located within the Vakhsh River and Syr Darya basins. This suggested possible impacts from human activities, such as winter irrigation water storage and interbasin water transfers, or insufficient recharge resulted from the reduced winter precipitation. Overall, ice- and snow-melt water in high-elevation regions and precipitation changes are key factors influencing runoff variation trends in Tajikistan, with diverse responses observed across different basins.
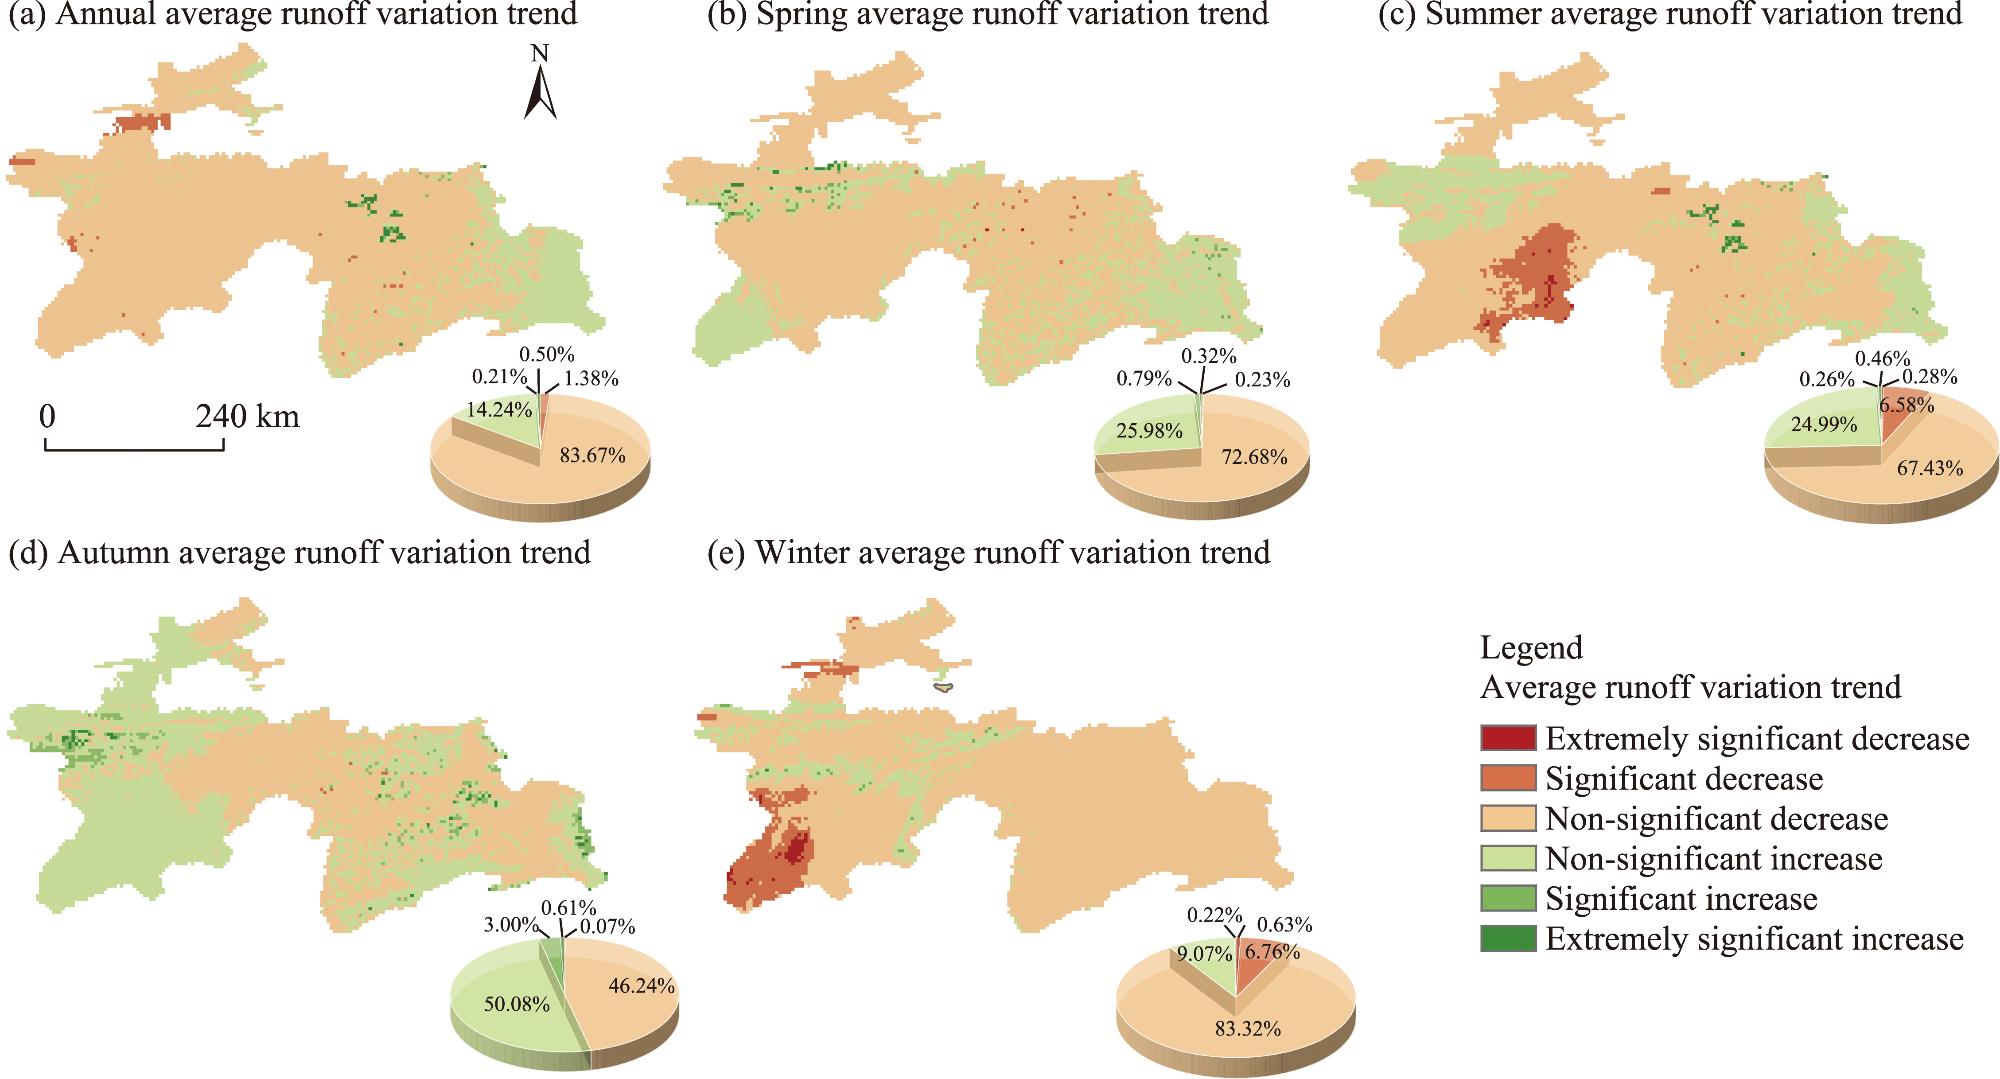
Fig. 5. Spatial distribution of the annual (a), spring (b), summer (c), autumn (d), and winter (e) average runoff variation trend in Tajikistan during 2000-2024. Pie chart represents the area percentage of each runoff variation trend.
From the interannual perspective (Fig. 5a), runoff in most regions of Tajikistan showed a slight downward trend, with no statistically significant trends. Notably, central regions exhibited significant increasing trends, whereas significant decreasing trends were observed in the northwestern regions, particularly in the Syr Darya Basin. These patterns indicated that interannual runoff variations in Tajikistan were influenced by multiple factors, resulting in diverse responses across different basins and elevation zones. Spatial runoff variations were likely shaped by regional topography and climatic factors, including precipitation and ice- and snow-melt water, with dominant drivers varying markedly across four seasons.
At the seasonal level, spring average runoff was primarily characterized by a non-significant decrease (72.68%; Fig. 5b), with 25.98% of the country exhibiting a non-significant increase. Summer average runoff exhibited a combined non-significant and significant increases (25.45%), while 6.86% of the significant decrease zones were concentrated in the northwestern region (Fig. 5c). Autumn average runoff variation was the most balanced, with non-significant decrease (46.24%) nearly equaling non-significant increase (50.08%; Fig. 5d). Winter average runoff was predominantly marked by a non-significant decrease (83.32%; Fig. 5e), alongside localized significant and extremely significant decreases in the southwestern and northwestern regions, totaling 7.39%. Annual average runoff (Fig. 5a) demonstrated that non-significant decreases dominated at 83.67% of the country, with significantly changing zones each accounting for less than 2.00%. This indicated that between 2000 and 2024, runoff in Tajikistan remained relatively stable overall, without widespread statistically significant increasing or decreasing trends. These statistical results aligned closely with the spatial distribution patterns, jointly revealing the relative stability of Tajikistan’s water resources under current climate change. This study also highlights the need to monitor local regions with significant runoff decreases, particularly in the southwestern regions of Tajikistan.

3.2. Temporal variation trend of runoff and climatic factors

Based on observed precipitation data from 2000 to 2024, precipitation in Tajikistan exhibited significant seasonal variation (Fig. 6). Winter precipitation showed a significant downward trend (-0.646 mm/a; P=0.03), representing that the only seasonal trend is statistically significant (Fig. 6a1). In contrast, spring precipitation displayed a non-significant increasing trend (0.271 mm/a; P=0.61), while the annual and other seasonal precipitation trends exhibited slight, non-significant declines. These results indicated a notable structural shift in Tajikistan’s precipitation pattern during the observation period, with winter drying emerging as the most prominent signal. The relationship between runoff and precipitation revealed that the annual runoff trend does not fully align with precipitation trend (Fig. 6a2). Despite a slight downward trend in the annual runoff, a decline in annual precipitation was more pronounced. This suggested that although precipitation is decreasing, the runoff response remains relatively moderate, implying potential compensatory mechanisms.
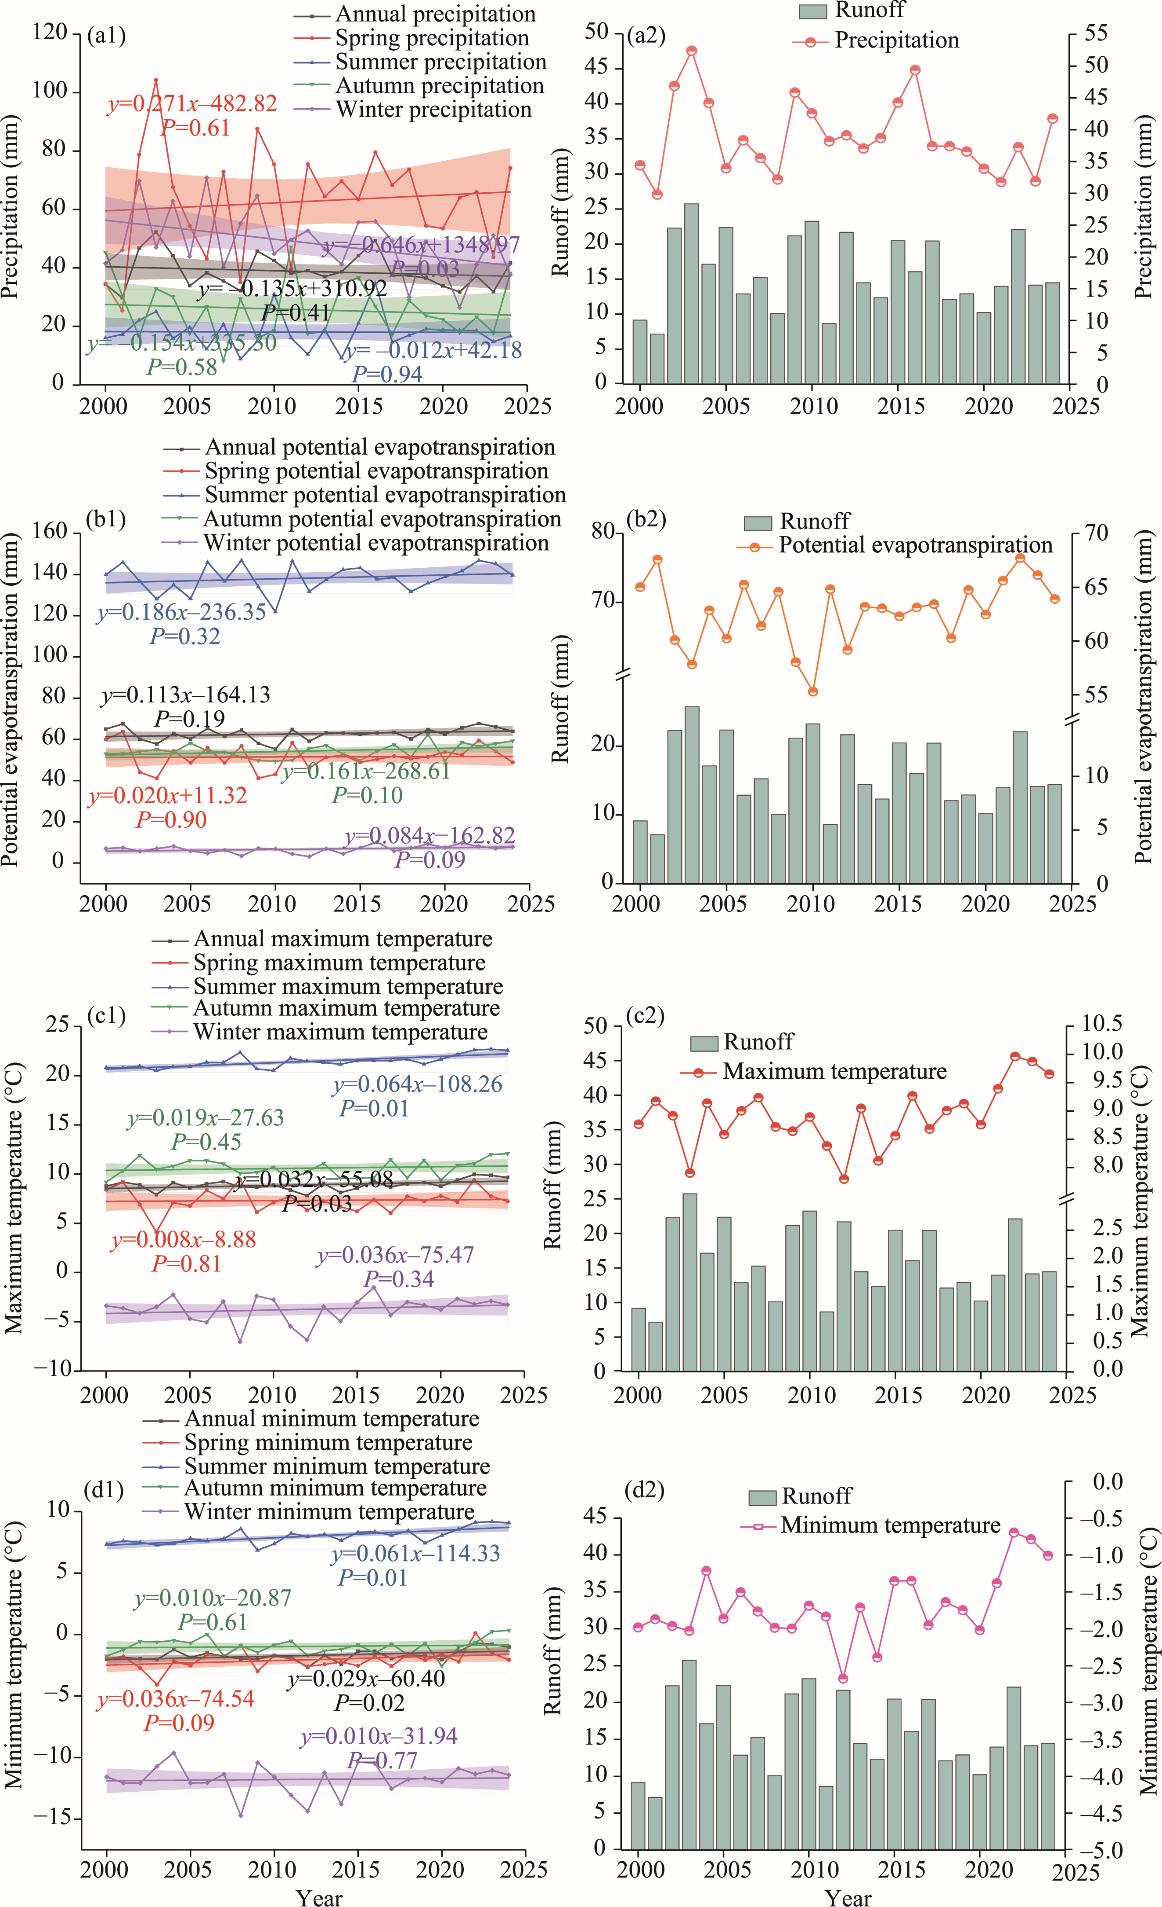
Fig. 6. Annual and seasonal variation trends of precipitation (a1), potential evapotranspiration (b1), maximum temperature (c1), and minimum temperature (d1), as well as the relationships of runoff with precipitation (a2), potential evapotranspiration (b2), maximum temperature (c2), and minimum temperature (d2) in Tajikistan during 2000-2024. The shaded region in the figure represents the 95% confidence interval.
Annual and seasonal potential evapotranspiration values in Tajikistan exhibited consistent upward trends, although none of these trends have reached a statistically significant level (P>0.05; Fig. 6b1). Summer potential evapotranspiration showed the most substantial increase (0.186 mm/a; P=0.32), followed by autumn potential evapotranspiration (0.161 mm/a; P=0.10), with the smallest increase occurring in spring. In Figure 6b2, runoff exhibited a slight downward trend, while potential evapotranspiration showed an upward trend. This suggested that increasing potential evapotranspiration may enhance water loss and negatively impact runoff. This relationship indicated that increased potential evapotranspiration under climate change may affect surface water availability, highlighting the need to consider the regulatory role of potential evapotranspiration in runoff for water resource management strategies.
Based on the observed maximum temperature data in Tajikistan from 2000 to 2024, Tajikistan exhibited a significant interannual warming trend accompanied by pronounced seasonal variation (Fig. 6c1). The maximum temperature exhibited a significant upward trend of 0.032°C/a (P=0.03). This trend was primarily driven by a pronounced increase in summer maximum temperature, which significantly rose at a rate of 0.064°C (P<0.01), representing the largest increase among all seasons and the only seasonal trend to be statistically significant. In contrast, changes in the maximum temperatures in spring (P=0.81), autumn (P=0.45), and winter (P=0.34) remained statistically non-significant. The relationship between the maximum temperature and runoff revealed a distinct dual effect (Fig. 6c2). The maximum temperature significantly increased at 0.032°C/a, whereas runoff exhibited a slight decreasing trend of -0.047 mm/a (Fig. 2a), indicating a negative correlation. This phenomenon highlighted the complex mechanisms by which temperature increases affect hydrological processes in Tajikistan. On one hand, a significant rise in summer maximum temperature accelerated glacier melts in high-mountainous regions, positively influencing runoff and accounting for the increased runoff observed in high-elevation regions. On the other hand, rising temperature enhanced potential evapotranspiration, thereby increasing water loss and negatively impacting runoff.
Based on observed the minimum temperature data in Tajikistan from 2000 to 2024, Tajikistan exhibited a warming pattern similar to that of the maximum temperature, with distinct asymmetric characteristics (Fig. 6d1). The minimum temperature showed a significantly increasing trend of 0.029°C/a (P=0.02). This trend was predominantly driven by the summer minimum temperature, which sharply rise at a rate of 0.061°C/a (P<0.01). Notably, spring minimum temperature also displayed a strong increasing trend of 0.036°C/a (P=0.09), approaching significance, while changes in autumn and winter remain relatively weak and statistically non-significant. The relationship between the minimum temperature and runoff had distinct hydroclimatic implications (Fig. 6d2). A significant increase in the minimum temperature contrasted with the slight decreasing trend in runoff (-0.047 mm/a), underscoring the complex mechanisms through which temperature increases affect hydrological processes.

3.3. Climatic factor collinearity and correlation analysis

3.3.1. Climatic factor collinearity analysis

Climatic factors exhibited certain collinearities, which may affect the independent interpretation of the contributions of individual factors. This study calculated the VIF values for each climatic factor (precipitation, potential evapotranspiration, the maximum temperature, and the minimum temperature) to assess the degree of collinearity. The results indicated that precipitation (VIF=1.86) and potential evapotranspiration (VIF=1.95) have low VIF values (<2.00), showing weak correlations with other variables and high independence. However, the VIF values of the maximum temperature (VIF=5.91) and the minimum temperature (VIF=5.75) felled within the range of 5.00-6.00, indicating moderate collinearity, but still within an acceptable range. Overall, multicollinearity was not severe in these climatic factors and was unlikely to lead to substantial deviations in interpreting the correlation analysis results.

3.3.2. Linear correlation analysis of runoff and climatic factors

Based on spatial correlation analyses of runoff and climatic factors in Tajikistan from 2000 to 2024 (Fig.7), this study identified substantial spatial variations in the relationships between runoff and its climatic drivers. Runoff and precipitation were primarily positively correlated across Tajikistan, with exhibiting moderate positive correlation (72.31% of the country) and high positive correlation (10.83%) concentrated in the eastern Pyanj and the northwestern Syr Darya Basin (Fig. 7a). This indicated that increased precipitation generally exerted a broad positive influence on runoff. In contrast, runoff and potential evapotranspiration exhibited a clear negative correlation, with 71.56% of the country showing moderate negative correlation and 2.83% of the country exhibiting high negative correlation (Fig. 7b). Notably, in the middle and lower reaches of the Syr Darya and the southwestern lowlands, the negative correlation between potential evapotranspiration and runoff weakened locally, resulting in patchy regions with non-significant correlation. This may be attributed to extensive irrigation networks that have altered the local water-energy balance. The relationship between temperature and runoff was considerably more complex. The correlation between runoff and the maximum temperature remained relatively weak. In regions with low glacier coverage, such as the Pyanj Basin and the middle and lower reaches of the Zeravshan River, regions with no correlation constituted by 51.44%, while low and moderate negative correlation zones accounted for 47.89% (Fig. 7c). The negative correlation between runoff and the maximum temperature was primarily distributed in the upper Syr Darya Basin, the Kafirnigan River Basin, and the lower Vakhsh River Basin, where high summer temperatures accelerated ice- and snow-melt water while simultaneously enhancing evapotranspiration, producing a nonlinear net effect. In contrast, the middle Vakhsh River Basin and the middle Panj River Basin exhibited no correlation or only low negative correlation, possibly due to the dominance of glacier meltwater supply and the lag effect of temperature changes on meltwater release in these regions. The correlation between runoff and the minimum temperature was even weaker, with 77.93% of the country showing no correlation and 20.59% of the country exhibiting low negative correlation (Fig. 7d), suggesting that changes in the minimum temperature exerted limited influence on runoff.
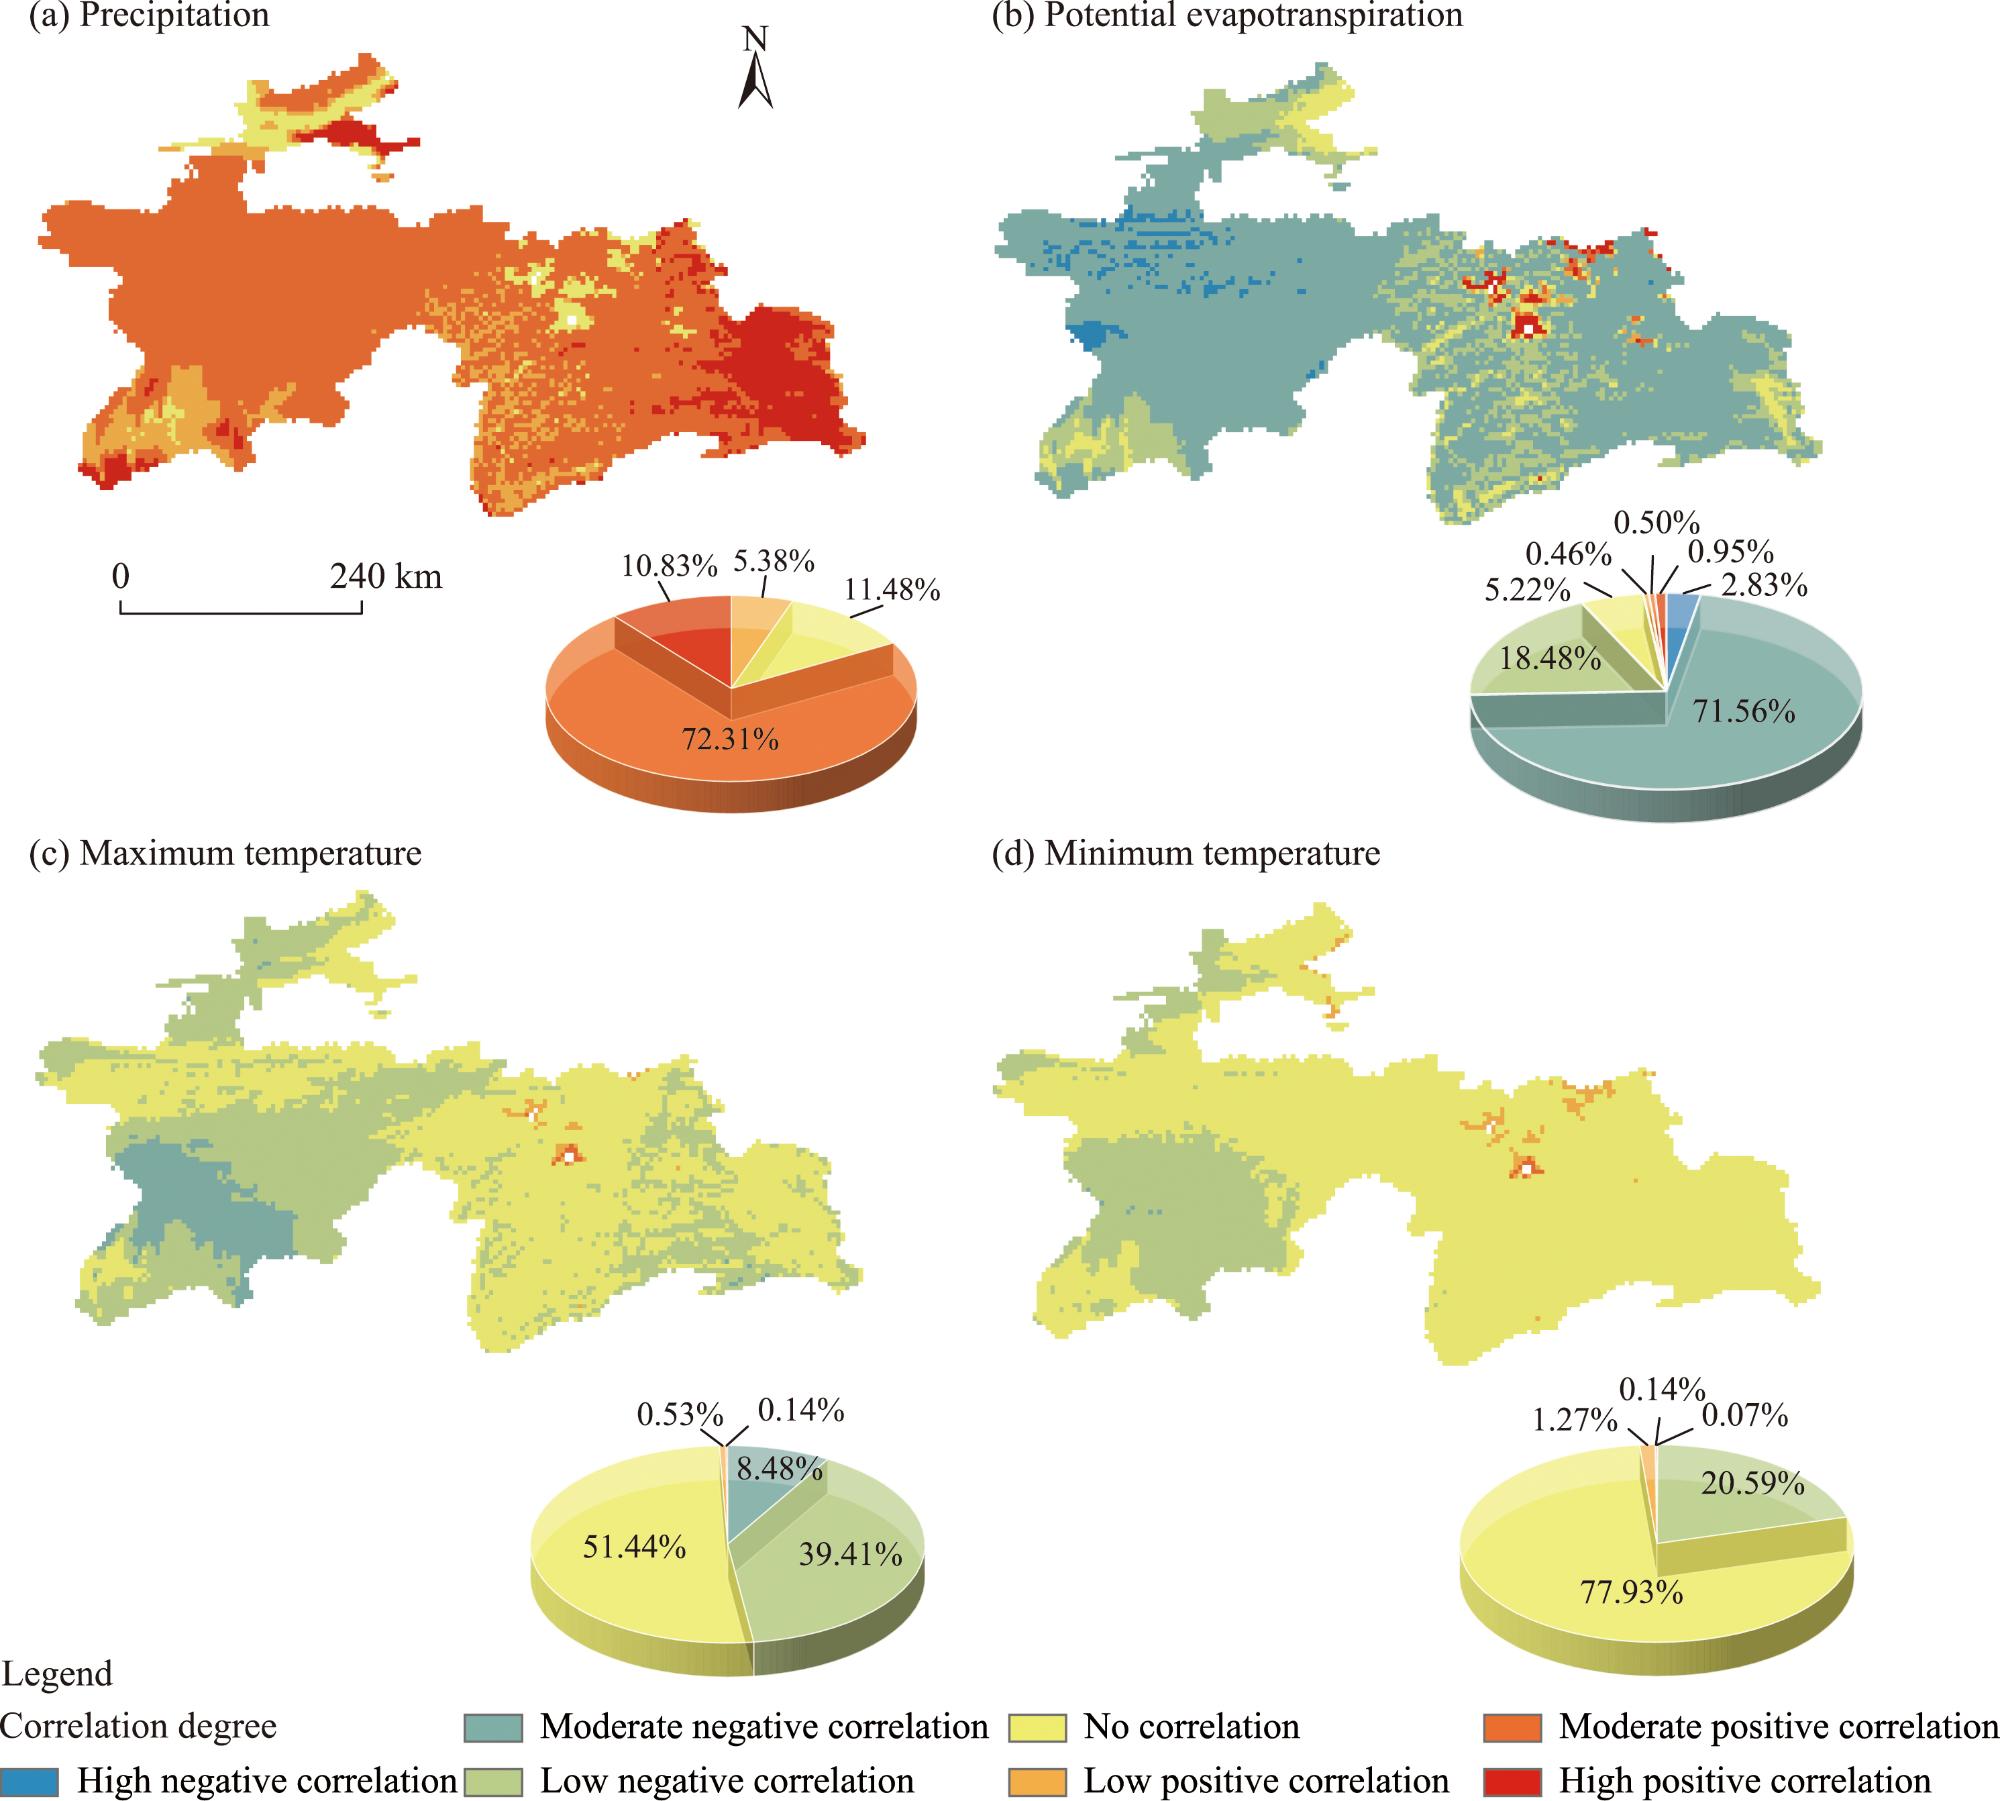
Fig. 7. Spatial distribution of the correlation degree (based on the Pearson correlation coefficient) of runoff with precipitation (a), potential evapotranspiration (b), maximum temperature (c), and minimum temperature (d) in Tajikistan during 2000-2024. Pie chart represents the area percentage of each correlation degree.
These spatial correlation patterns collectively revealed the complexity of Tajikistan’s hydrological responses to climate change: precipitation served as the primary positive driver of runoff, while potential evapotranspiration was the most consistent negative driver. Although rising maximum temperature may increase runoff in glacial regions by accelerating meltwater, this effect is offset at the national scale by the negative impact of enhanced evapotranspiration.

3.3.3. Nonlinear correlation analysis of runoff and climatic factors

This study conducted a Spearman rank correlation analysis (Fig. 8) and compared it with the Pearson correlation analysis results to verify the robustness of the Pearson correlation analysis results and investigate possible monotonic nonlinear relationships between runoff and climatic factors. The two methods revealed largely consistent spatial patterns, although they differed in correlation strength and local details.
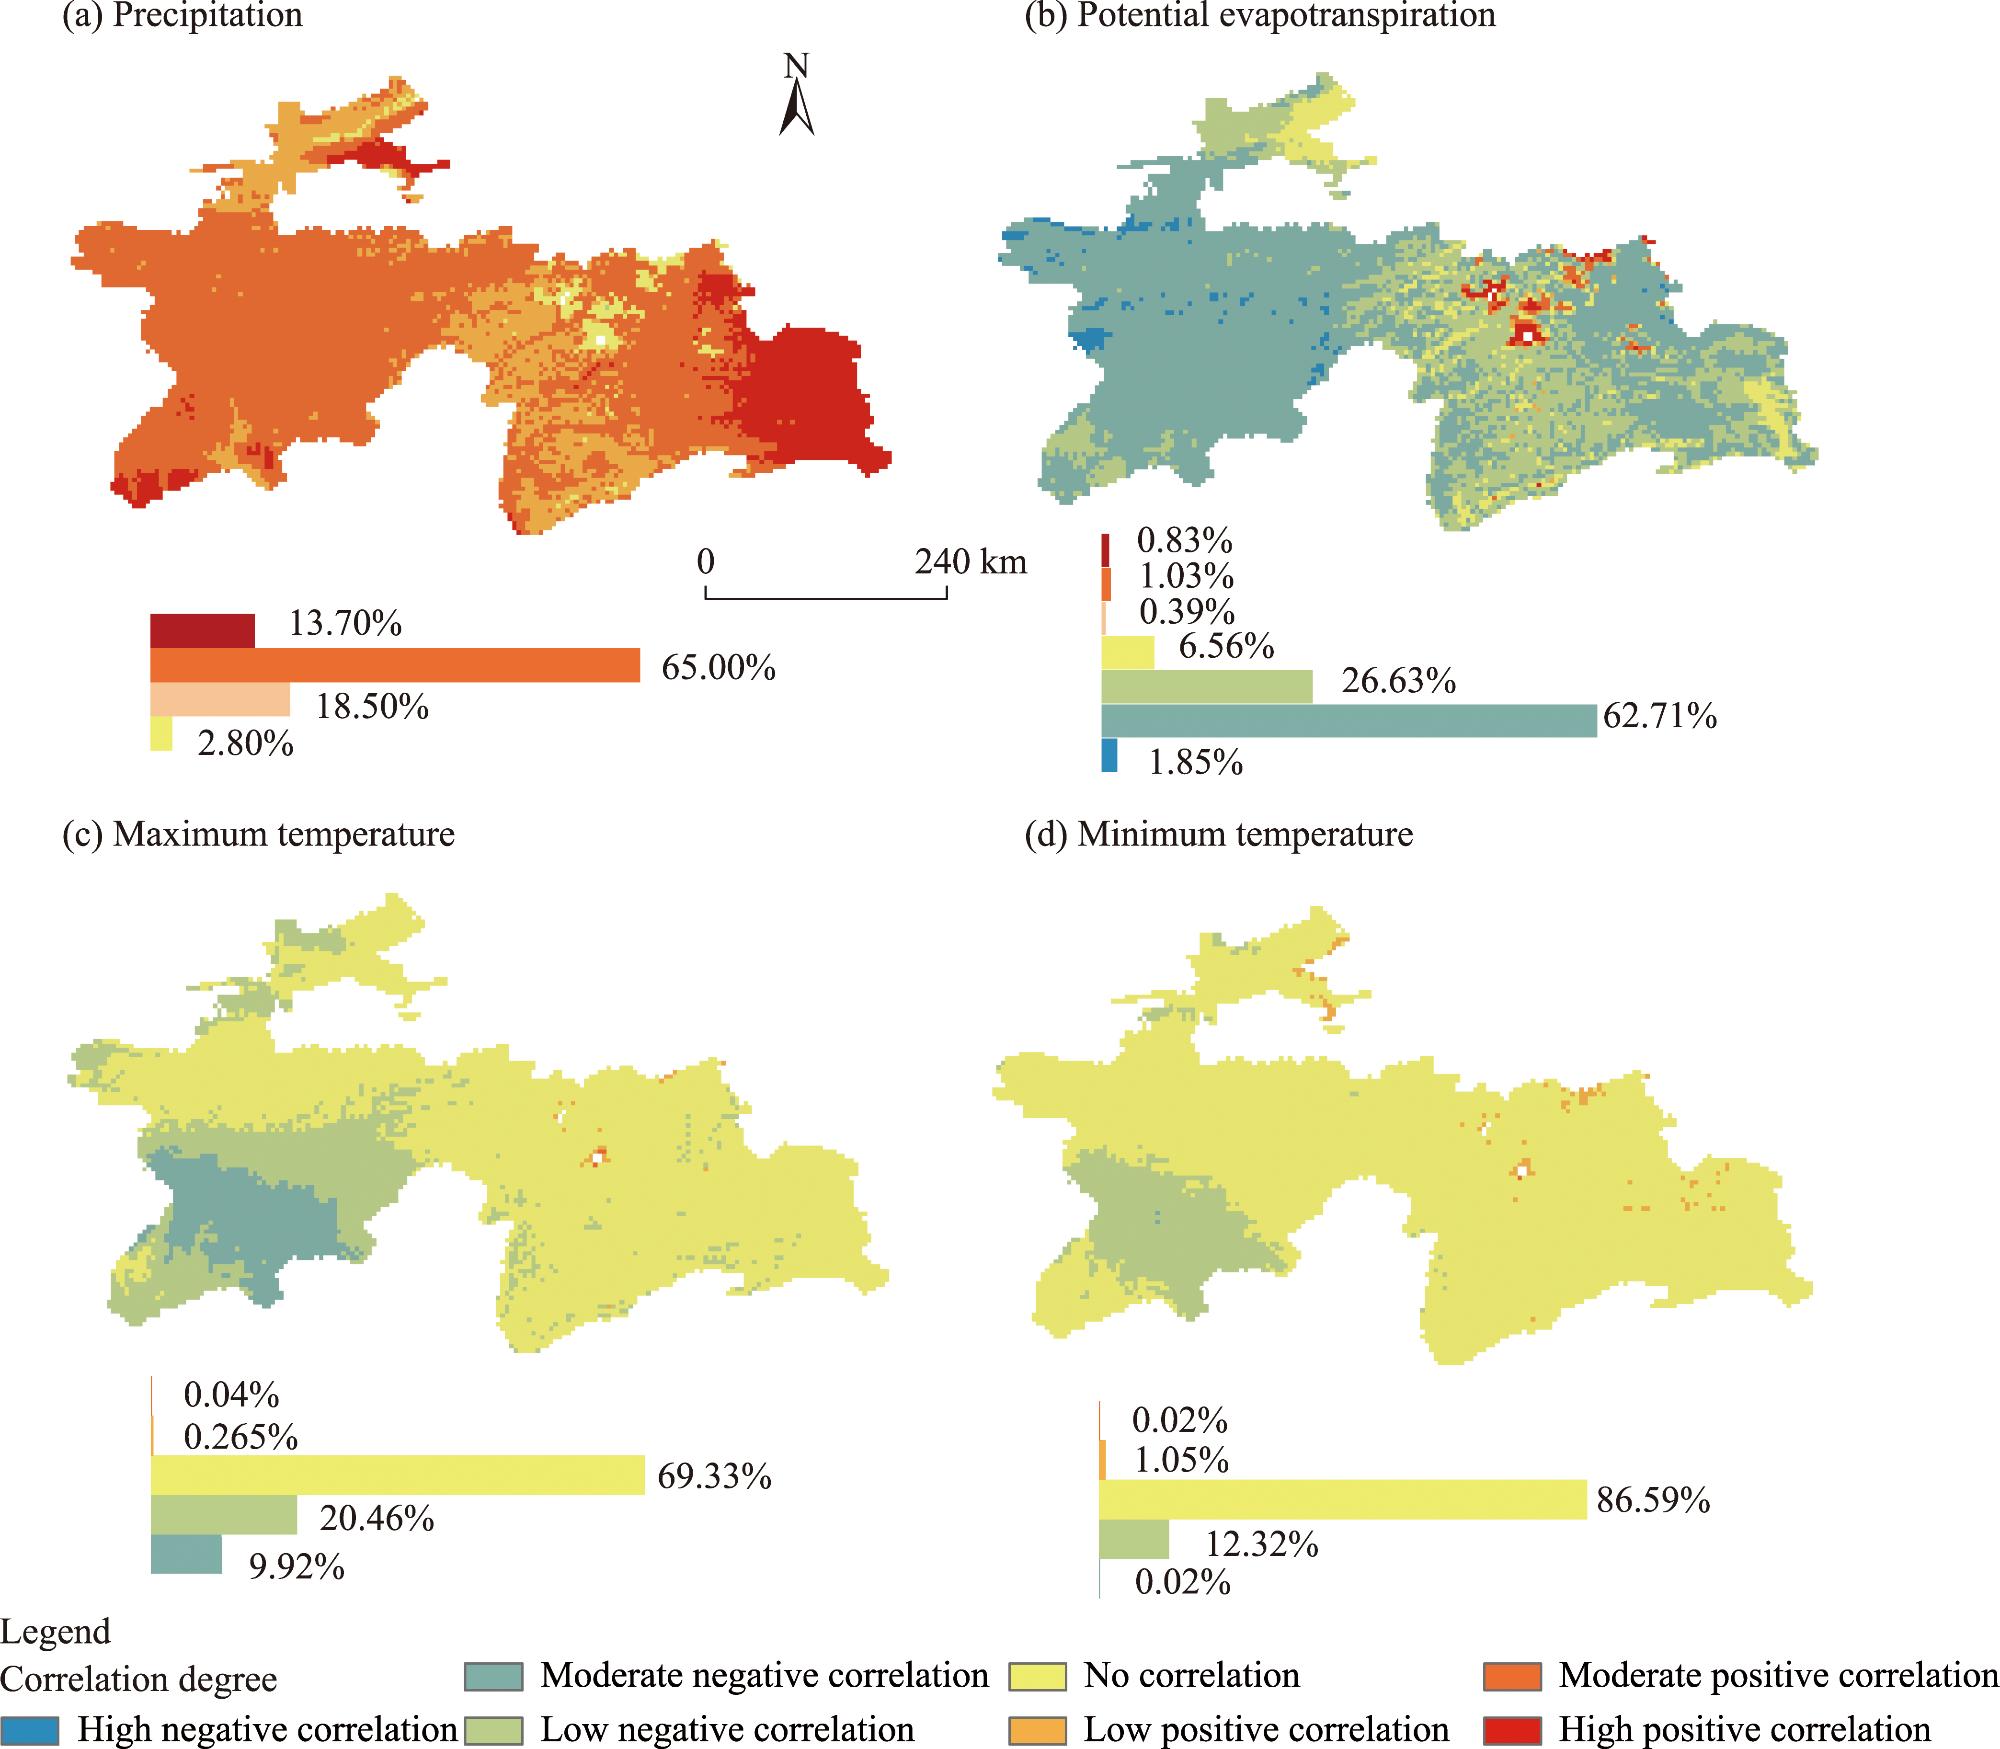
Fig. 8. Spatial distribution of correlation degree (based on the Spearman rank correlation coefficient) of runoff with precipitation (a), potential evapotranspiration (b), maximum temperature (c), and minimum temperature (d) in Tajikistan during 2000-2024. Bar chart represents the area percentage of each correlation degree.
The correlation between runoff and precipitation exhibited widespread positive correlations in both analyses. In the Spearman rank correlation analysis, zones with moderate to high positive correlations accounted for 78.73% of the country, slightly lower than the 83.14% observed in the Pearson correlation analysis. However, the Spearman rank correlation analysis identified slightly higher proportions of regions with low positive or no correlation (Fig. 7a and 8a), indicating that the relationship between runoff and precipitation in certain regions may not follow a strictly linear pattern. The strong negative correlation between runoff and potential evapotranspiration remained stable in both analyses, with the Spearman rank correlation analysis showing that regions with moderate to high negative correlations constituted 64.56% of the country (Fig. 8b), further confirming the role of potential evapotranspiration as a key negative driver.
Differences in the responses of runoff to temperature were more pronounced. Pearson correlation analysis between runoff and the maximum temperature showed a low negative correlation across a larger region (39.41%) (Fig. 7c), mainly in the Kafirnigan River Basin, the Vakhsh River Basin, and the northwestern Syr Darya Basin. In contrast, Spearman rank correlation analysis indicated that 69.33% of the regions in Tajikistan have no correlation, with the uncorrelated regions extending further into the eastern Pamir Plateau compared with 51.44% of the regions in the country in the Pearson correlation analysis. Both methods detected low positive correlations in less than 0.67% of the country (Figs. 7c and 8c). This suggested that the widespread low negative correlation between runoff and the maximum temperature at the national scale may be partly overestimated under a linear framework, and the actual relationship likely reflected a non-significant monotonic pattern. For the minimum temperature, the proportion of regions (86.59%) with no correlation in Spearman rank correlation analysis was substantially higher than the proportion of regions (77.93%) with no correlation in Pearson correlation analysis (Figs. 7d and 8d), further confirming the limited direct influence of the minimum temperature on runoff.

4. Discussion

4.1. Runoff stability mechanism

This study systematically evaluated the spatiotemporal variations in runoff and its response to climatic drivers in Tajikistan from 2000 to 2024. The results indicated that although the annual runoff showed non-significant variation trend at the national scale (P=0.76), pronounced seasonal variations and spatial heterogeneities existed. This seemingly contradictory phenomenon underscored the complexity of hydrological responses in high-mountainous regions under climate change, highlighting the interplay of multiple drivers such as glacier melt, shifting precipitation patterns, and increased evapotranspiration.
This study found statistically non-significant trend in the annual runoff in Tajikistan, which aligns with some findings from recent studies in Central Asia. However, it differed from the commonly expected inference that climate warming accelerates glacier melt and thereby substantially increases runoff. Through global analysis, Hugonnet et al. (2021) confirmed that glaciers, including those in the Tianshan Mountains, experienced accelerated melting between 2000 and 2019. This accelerated melting has undoubtedly provided a substantial water source for downstream regions, contributing to the increase of runoff. This buffering effect is evident in the high-elevation glacial regions of the eastern Tajikistan, where runoff has been sustained or even increased despite the reduction of precipitation. However, our results also revealed a significant decrease in winter precipitation (-0.646 mm/a; P=0.03), coupled with a continuous rise in potential evapotranspiration (the highest increase occurring in summer, with the increase rate of 0.186 mm/a), both of which exerted a clear dissipative effect on runoff. Using glacier hydrological models, Huss and Hock (2018) predicted that glacier-fed basins would experience a peak in runoff before subsequent decline. In light of this study’s finding of non-significant variation trend in national annual runoff (Fig. 2a), coupled with a significant reduction in winter precipitation, it can be inferred that Tajikistan may currently be in a plateau phase near the runoff peak. Short-term gains from glacier melt have offset the negative impacts of reduced precipitation on runoff and increased potential evapotranspiration on runoff, thereby maintaining the overall runoff stability.
The correlation analysis in this study provided direct evidence to quantify the relative contributions of individual driving factors. The results indicated that precipitation served as the primary positive driver, with regions exhibiting moderate to high positive correlations between runoff and precipitation accounting for over 70.00% of the country (Figs. 7a and 8a), consistent with the findings from Immerzeel et al. (2010). Nevertheless, observed changes in precipitation patterns have imposed substantial stress on water resources: winter precipitation has shown a significant declining trend (Fig. 6), in line with the aridification trend in Central Asia (Chen et al., 2018; Wei et al., 2020). Meanwhile, potential evapotranspiration, as a consistent negative driver, exerted a widespread negative influence, with regions showing moderate to high negative correlations accounting for over 64.00% of the country (Figs. 7b and 8b), supporting the assertion by Massari et al. (2021) that increased potential evapotranspiration exacerbates runoff deficits. By integrating quantitative evidence from these three processes, a preliminary assessment of their relative intensities can be made: at present, the positive effect of precipitation dominates spatially (covering the largest area), yet a decline in winter precipitation and an increase in potential evapotranspiration together impose a clear and persistent negative pressure. Although this study did not analyze glacier melt, including the glacier melting rate of the country, previous research (Hugonnet et al., 2021) indicated that its positive contribution to runoff, while substantial in magnitude, is geographically limited, creating a complex trade off dynamic with the two aforementioned widespread factors.
Rising temperatures exert a dual influence in this competitive hydrological context. This study revealed a predominantly negative correlation between runoff and the maximum temperature at the national scale, with zones showing either no correlation or negative correlation together covering over 99.00% of the country (Fig. 8c). This contrasted sharply with the intuitive expectation that rising temperatures primarily accelerate glacier melting. These observations suggested a dual competing mechanism by which temperature affects high-mountainous hydrology. In high-elevation glaciated regions, increases in summer maximum temperatures enhance glacier melt, which is the primary driver of the observed runoff increase in the eastern high-mountainous regions of Tajikistan. However, in regions with low glacier coverage, rising temperatures primarily increase potential evapotranspiration, thereby reducing available water resources. The relative contributions of these two effects can be evaluated using spatial statistics and trend analyses. First, regions where the maximum temperature negatively correlated with runoff cover over 40.00% of the country, significantly higher than the regions with positive correlation (<0.67%), indicating that the overall inhibitory effect is statistically dominant. Second, the annual maximum temperature showed a significant increasing trend (Fig. 6), while the annual runoff exhibited a slight decreasing trend (Fig. 2a). This inverse relationship further indicated the predominance of the negative effect. Meanwhile, a significant increase in the minimum temperature (Fig. 6) carried important hydrological implications. Pepin et al. (2015) demonstrated that elevation-dependent warming in mountainous regions influences hydrological processes by reducing glacier surface refreezing and modifying snow properties. Thus, the observed slight national decrease in runoff represents the net outcome of competing processes: widespread inhibitory effects (enhanced potential evapotranspiration) and localized positive effects (glacier melt). This clearly supports the existence of a “dual-mechanism competition”, in which warming increases runoff locally through glacier melt but reduces it over broader regions via enhanced potential evapotranspiration.

4.2. Combined impacts of human activities and basin heterogeneity

This study primarily highlighted the impact of climatic factors on runoff variations through statistical correlation analysis and did not explicitly quantify the relative contributions of human activities. Nevertheless, spatial analysis revealed significant decrease of runoff in the central Syr Darya Basin, which strongly suggests the superimposed effects of anthropogenic interventions (Fig. 5a). Micklin (2016) documented that the Aral Sea has undergone rapid desiccation and salinization, primarily driven by unsustainable irrigation expansion and large-scale water withdrawals from the Amu Darya and Syr Darya. The observed runoff decline of the Syr Darya Basin likely reflected the combined influence of climate change and human activities, including upstream reservoir regulation and transboundary water allocation. Further evidence from Duan et al. (2023) and Peng et al. (2025) indicated that human activities have become the dominant driver in certain basins. Moreover, Jiang et al. (2025) demonstrated that land-use changes can alter runoff by revising catchment-scale runoff generation and convergence processes. The interaction of human activities with climate-driven hydrological variabilities results in pronounced spatial heterogeneity in runoff responses across different basins, underscoring the need to consider both natural and anthropogenic factors in regional water resource management.
The localized runoff reductions observed in the middle and downstream reaches of the Syr Darya, reflect the influence of human activities, whose intensity and spatial patterns likely interact in complex ways with the natural characteristics of the watershed. For instance, in basins with the minimal glacier coverage and intensive agricultural irrigation (e.g., the middle and downstream regions of the Syr Darya), water resource systems may be particularly sensitive to human interventions, such as water diversions and reservoir operations, due to the absence of a stable glacier meltwater base flow to buffer variability (Sorg et al., 2012). In contrast, on the Pamir Plateau, which is rich in glacier resources, robust glacier meltwater replenishment may mask or delay the direct impacts of human activities on the annual runoff, making hydrological responses more strongly influenced by climate change. Moreover, the intensity of land use, particularly the expansion of irrigated agriculture, can further change runoff responses to climate and management measures by altering the runoff generation and convergence characteristics of the underlying surface (Jiang et al., 2025). These interactions between watershed characteristics (e.g., glacier coverage and land-use intensity) and human activities are central to shaping the spatial heterogeneity of runoff changes in Tajikistan. However, due to limitations in available data and methodological constraints, this study cannot strictly quantify or verify these interactions. Future research should integrate high-resolution watershed property data—such as precise maps of irrigated areas and reservoir operation rules—with distributed hydrological models capable of linking natural processes and human water resource use behaviors. Such an approach would help elucidate the differential impacts of human activities across distinct watershed types and provide robust scientific evidence to support adaptive water management strategies tailored to the specific characteristics of Tajikistan.

4.3. Integrated driving mechanisms and future research directions

By combining existing research and fundamental hydrological principles, we can anticipate the future trajectories of Tajikistan’s primary runoff drivers and their impact on water resources. First, the contribution of glacier-melt water is expected to continue increasing due to ongoing warming (Hugonnet et al., 2021), likely sustaining or slightly enhancing runoff replenishment. However, Huss and Hock (2018) found that with continuous depletion of glacier storage, the meltwater runoff driven by warming will inevitably reach a peak and subsequently decline using glacier hydrological models. Consequently, the “hydrological buffering” effect of glaciers is considerably time-limited, and its positive contribution to runoff is projected to progressively weaken over the next few decades. Second, potential evapotranspiration and actual evapotranspiration are anticipated to intensify further with continuously increasing temperature. This energy-driven, water-consuming process represents a nearly monotonically increasing negative effect on runoff. Hydrological cycle modeling indicates that a significant temperature rise (e.g., a 5.000°C rise) may reduce regional runoff by 10.00%-20.00%, with the magnitude of this effect expected to grow over time, particularly in semi-arid downstream regions (White et al., 2014). Finally, future precipitation patterns remain highly uncertain. Nevertheless, Chen et al. (2018) suggested that structural shifts—such as reductions in winter precipitation—may persist using the regional climate models, further constraining the recharge of water resources.
Collectively, the aforementioned dynamics indicate a critical challenge for Tajikistan’s future water security: the short-term gains from glacier melt will gradually diminish, while a long-term increase in water loss via evapotranspiration will continue to grow, widening the gap between them. Coupled with the potential decline of winter precipitation, the risk of future runoff reductions is substantial. This inference underscores the extreme urgency for long-term adaptive planning and transboundary water resource co-management, beyond short-term statistical assessments.
Although this study elucidated the spatiotemporal differentiation of runoff driving mechanisms in Tajikistan, several limitations warrant attention in future research. Firstly, the limited validation and quantitative attribution: the study relies on statistical correlations, which cannot precisely quantify the contribution of individual drivers. As highlighted by Lutz et al. (2014), future research should employ distributed hydrological models with glacier modules, integrated with in situ hydrometeorological station data, to achieve more accurate attribution of each driving factor. Secondly, relatively short analysis period: the study period (2000-2024) may be insufficient for robust hydrological trend detection, rendering results sensitive to extreme years and potentially affecting trend significance assessments. Incorporating longer-term datasets would enhance the statistical robustness of trend analyses. Thirdly, methodological limitations in trend detection: although nonparametric trend tests were applied to mitigate distributional assumptions and weak autocorrelation was confirmed in runoff series, analyses of longer-term or more strongly autocorrelated variables (e.g., temperature) would benefit from pre-whitened or variance-corrected M-K trend test to improve trend detection accuracy. Fourthly, human activity impacts were not fully quantified: while this study identifies the potential exacerbation of local water stress by human activities, it cannot precisely separate the contributions of climate and anthropogenic drivers in specific basins (e.g., the Syr Darya Basin) due to data and methodological constraints. Future research should adopt physically based attribution methods to quantify the relative contributions of each factor for informed basin management. Finally, the limited resolution of glacier observations: higher-resolution data are required to capture detailed glacier dynamics. As demonstrated by Brun et al. (2017) on the Pamir Plateau, multisource remote sensing offers significant potential for assessing glacier mass balance. In summary, future studies should develop a comprehensive assessment framework that integrates climate, glaciers, hydrology, and human activities to provide more robust and actionable scientific support for water security in Tajikistan.

5. Conclusions

This study systematically revealed the spatiotemporal heterogeneity of runoff in Tajikistan from 2000 to 2024 and its underlying climatic driving mechanisms, providing a scientific basis for water resource management at both national and transboundary downstream basin scales. Although national annual runoff remained generally stable, significant seasonal and spatial variations were observed, with spring and summer runoff showing a slight decline and winter runoff showing a marked decline in low-altitude regions such as the northwestern Syr Darya Basin. Precipitation was identified as the most critical positive driving factor while potential evapotranspiration consistently functioned as a negative driving factor. Rising temperatures exhibited a dual competing effect: in glacier-covered regions, rising temperatures temporarily increased runoff by accelerating ice melt, while at the national scale, the negative impact of rising temperatures on runoff has played a slightly dominant role to a certain extent by enhancing evapotranspiration. In addition, human activities, including irrigation water withdrawals and reservoir regulation, exacerbated local runoff reductions, particularly in the Syr Darya Basin, reinforcing the spatial heterogeneity of runoff alongside climatic factors. Notably, the current stability of runoff largely depends on the short-term buffering effect of ice- and glacier-melt water; as glaciers continue to retreat and evapotranspiration intensifies, Tajikistan faces increasing risks of future runoff reduction, underscoring the urgent need for transboundary collaborative adaptive water resource management.

Authorship contribution statement

LI Chunlan: conceptualization, formal analysis, methodology, supervision, validation, visualization, writing - original draft, and writing - review & editing; YU Yang: methodology and software; SUN Lingxiao: conceptualization, software, validation, visualization, and writing - review & editing; HE Jing: data curation and supervision; LU Yuanbo: data curation; GUO Zengkun: data curation; FANG Gonghuan: data curation; Alexandr ULMAN: visualization; Vitaliy SALNIKOV: visualization; Ireneusz MALIK: validation; and Małgorzata WISTUBA: validation. All authors approved the manuscript.

Declaration of conflict of interest

YU Yang is a Young Editorial Board member of Regional Sustainability and was not involved in the editorial review or the decision to publish this article; and Ireneusz MALIK is an Editorial Board member of Regional Sustainability and was not involved in the editorial review or the decision to publish this article. All authors declare that they have no known competing financial interests or personal relationships that could have appeared to influence the work reported in this paper.

Acknowledgements

This research was funded by the Strategic Priority Research Program of the Chinese Academy of Sciences (XDB0720203) and the National Key Research and Development Program of China (2023YFF0805603).
[1]
Abghari H., Tabari H., Hosseinzadeh Talaee P., 2013. River flow trends in the west of Iran during the past 40 years: Impact of precipitation variability. Global and Planetary Change. 101, 52-60.

DOI

[2]
Ahmed K., Shahid S., Chung E.S., et al., 2017. Spatial distribution of secular trends in annual and seasonal precipitation over Pakistan. Climate Research. 74, 95-107.

DOI

[3]
Aizen V.B., Aizen E.M., Kuzmichenok V.A., 2007. Geo-informational simulation of possible changes in Central Asian water resources. Global and Planetary Change. 56(3), 341-358.

DOI

[4]
Ali R., Kuriqi A., Abubaker S., et al., 2019. Long-term trends and seasonality detection of the observed flow in Yangtze River using Mann-Kendall and Sen’s innovative trend method. Water. 11(9), 1855, doi: 10.3390/w11091855.

[5]
Brun F., Berthier E., Wagnon P., et al., 2017. A spatially resolved estimate of High Mountain Asia glacier mass balances from 2000 to 2016. Nature Geoscience. 10(9), 668-673.

DOI

[6]
Chang Z.H., Gao H.K., Yong L.L., et al., 2023. Projected future changes in cryosphere and hydrology of a mountainous catchment in the Upper Heihe River, China. Hydrology and Earth System Sciences. 28(16), 1-43.

DOI

[7]
Chen Y.N., Li Z., Fang G.H., et al., 2017. Impact of climate change on water resources in the Tianshan Mountains, Central Asia. Acta Geographica Sinica. 72(1), 18-26 (in Chinese).

[8]
Chen Y.N., Li Z., Fang G.H., et al., 2018. Large hydrological processes changes in the transboundary rivers of Central Asia. Journal of Geophysical Research: Atmospheres. 123(10), 5059-5069.

DOI

[9]
Deng H.J., Chen Y.N., Wang H.J., et al., 2015. Climate change with elevation and its potential impact on water resources in the Tianshan Mountains, Central Asia. Global and Planetary Change. 135, 28-37.

DOI

[10]
Duan Y.J., He Y., Zhao J., et al., 2023. Analysis of impact of human activities on runoff changes in Yue River Basin of the Qinling Mountains. Arid Zone Research. 40(4), 605-614 (in Chinese).

DOI

[11]
Hagg W., Hoelzle M., Wagner S., et al., 2013. Glacier and runoff changes in the Rukhk catchment, upper Amu-Darya basin until 2050. Global and Planetary Change. 110, 62-73.

DOI

[12]
Hu Z.Y., Zhou Q.M., Chen X., et al., 2017. Variations and changes of annual precipitation in Central Asia over the last century. International Journal of Climatology. 37(5), 157-170.

DOI

[13]
Hugonnet R., McNabb R., Berthier E., et al., 2021. Accelerated global glacier mass loss in the early twenty-first century. Nature. 592(7856), 726-731.

DOI

[14]
Huss M., Hock R., 2018. Global-scale hydrological response to future glacier mass loss. Nature Climate Change. 8(2), 135-140.

DOI

[15]
Immerzeel W.W., Van Beek L.P., Bierkens M.F., 2010. Climate change will affect the Asian water towers. Science. 328(5984), 1382-1385.

DOI PMID

[16]
Immerzeel W.W., Lutz A.F., Andrade M., et al., 2020. Importance and vulnerability of the world’s water towers. Nature. 577(7790), 364-369.

DOI

[17]
IPCC (Intergovernmental Panel on Climate Change), 2021. Climate Change 2021: The Physical Science Basis. Contribution of Working Group I to the Sixth Assessment Report. Cambridge: Cambridge University Press.

[18]
Islam A.R.M.T., Al Awadh M., Mallick J., et al., 2023. Estimating ground-level PM2.5 using subset regression model and machine learning algorithms in Asian megacity, Dhaka, Bangladesh. Air Quality, Atmosphere & Health. 16(6), 1117-1139.

[19]
Jiang Y.Q., Wang L.C., Xie T.N., et al., 2025. Study on the effect of underlying surface changes on runoff generation in the urbanized watershed. Scientific Reports. 15(1), 15056, doi: 10.1038/s41598-025-95295-1.

[20]
Jiayinaguli W., Wu Y.F., Batur B., et al., 2013. Climate warming trend of Tajikistan in the past 100 years. Plateau and Mountain Meteorology Research. 33(3), 48-54 (in Chinese).

[21]
Karthe D., Chalov S., Borchardt D., 2015. Water resources and their management in Central Asia in the early twenty first century: Status, challenges and future prospects. Environmental Earth Sciences. 73(2), 487-499.

DOI

[22]
Li L.F., Chen J.J., 2018. Cross border water resources in Central Asia: Development dilemma and governance challenges. Journal of International Politics Studies. 39(3), 89-107 (in Chinese).

[23]
Liu Q.Y., 2010. Tajikistan. Beijing: Social Sciences Academic Press, 1-5 (in Chinese).

[24]
Lutz A.F., Immerzeel W.W., Shrestha A.B., et al., 2014. Consistent increase in High Asia’s runoff due to increasing glacier melt and precipitation. Nature Climate Change. 4(7), 587-592.

DOI

[25]
Massari C., Avanzi F., Bruno G., et al., 2021. Evapotranspiration enhancement drives the European water-budget deficit during multi-year droughts. Hydrology and Earth System Sciences Discussions. 26(6), 1-24.

[26]
Micklin P., 2016. The future Aral Sea: Hope and despair. Environmental Earth Sciences. 75(9), 844, doi: 10.1007/s12665-016-5614-5.

[27]
Niederer P., Bilenko V., Ershova N., et al., 2008. Tracing glacier wastage in the Northern Tien Shan (Kyrgyzstan/Central Asia) over the last 40 years. Climatic Change. 86(1-2), 227-234.

DOI

[28]
Peng K., Zhang Y.Y., Tang Q.H., et al., 2025. Decomposing the effects of changes in catchment characteristics on runoff into chain transmission effects of climate change and human activities using an improved Budyko framework. Earth’s Future. 13, e2025EF006041, doi: 10.1029/2025EF006041.

[29]
Pepin N., Bradley R.S., Diaz H.F., et al., 2015. Elevation-dependent warming in mountain regions of the world. Nature Climate Change. 5(5), 424-430.

DOI

[30]
Ren X., Zheng J.H., Mu C., et al., 2017. Correlation analysis of the spatial-temporal variation of grassland net primary productivity and climate factors in Xinjiang in the past 15 years. Ecological Science. 36(3), 43-51 (in Chinese).

[31]
Sen P.K., 1968. Estimates of the regression coefficient based on Kendall’s tau. Journal of the American Statistical Association. 63, 1379-1389.

DOI

[32]
Shi G.S., Gao B., 2022. Attribution analysis of runoff change in the upper reaches of the Kaidu River basin based on a modified Budyko framework. Atmosphere. 13(9), 1385, doi: 10.3390/atmos13091385.

[33]
Siegfried T., Bernauer T., Guiennet R., et al., 2012. Will climate change exacerbate water stress in Central Asia? Climatic Change. 112(3/4), 881-899.

DOI

[34]
Sorg A., Bolch T., Stoffel M., et al., 2012. Climate change impacts on glaciers and runoff in Tien Shan (Central Asia). Nature Climate Change. 2(10), 725-731.

DOI

[35]
Sun H., Yao T.D., Su F.G., et al., 2024. Spatiotemporal responses of runoff to climate change in the southern Tibetan Plateau. Hydrology and Earth System Sciences. 28(18), 4361-4381.

DOI

[36]
Wei W., Wang B.T., Zhang K.B., 2020. Analysis on spatiotemporal trend of drought in the Central Asia region during 1901-2015 based on SPEI. Journal of Beijing Forestry University. 42(4), 113-121 (in Chinese).

[37]
White C.J., Tanton T.W., Rycroft D.W., 2014. The impact of climate change on the water resources of the Amu Darya basin in Central Asia. Water Resources Management. 28(15), 5267-5281.

DOI

[38]
Xia H.H., Yang L.S., Feng Q., et al., 2025. Progress of research on the impact of climate change on hydrological processes in cold regions in alpine mountains of western China. Journal of Salt Lake Research. 33(4), 12-25 (in Chinese).

[39]
Zhu L., Deng Y., Bai G.G., et al., 2024. Runoff characteristics and their response to meteorological condition in the Yarlung Zangbo River Basin: Spatial heterogeneity due to the glacier coverage difference. Remote Sensing. 16(24), 4646, doi: 10.3390/rs16244646.

[40]
Zhu S.T., Tang J.Y., Zhou X.L., et al., 2023. Spatiotemporal analysis of the impact of urban landscape forms on PM2.5 in China from 2001 to 2020. International Journal of Digital Earth. 16(1), 3417-3434.

DOI

Outlines

/