
Coupling dynamics of SDGs in Tajikistan from 2001 to 2023
Received date: 2025-08-29
Revised date: 2025-10-25
Accepted date: 2026-01-06
Online published: 2026-03-11
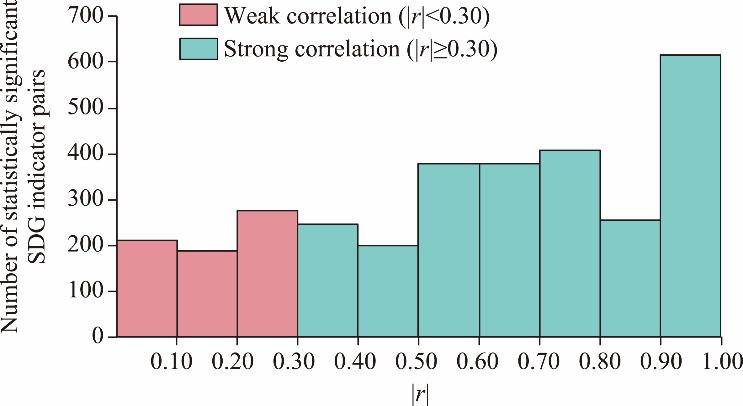
Since the United Nations launched the Sustainable Development Goals (SDGs) in 2015, global implementation has steadily advanced, yet prominent challenges persist. Progress has been uneven across regions and countries, with Tajikistan representing a typical example of such disparities. Based on 81 SDG indicators for Tajikistan from 2001 to 2023, this study applied a three-level coupling network framework: at the microscale, it identified synergies and trade-offs between indicators; at the mesoscale, it examined the strength and direction of linkages within four SDG-related components (society, finance, governance, and environment); and at the global level, it focused on the overall SDG interlinkages. Spearman’s rank correlation, sliding window method, and topological properties were employed to analyze the coupling dynamics of SDGs. Results showed that over 70.00% of associations in the global SDG network were of medium-to-low intensity, alongside extremely strong ones (|r| value approached 1.00, where r is the correlation coefficient). SDG interactions were generally limited, with stable local synergy clusters in core livelihood sectors. Network modularity fluctuated, reflecting a cycle of differentiation, integration, and fragmentation, while coupling efficiency varied with the external environment. Each component exhibited distinct functional characteristics. The social component maintained high connectivity through the “poverty alleviation-education-healthcare” loop. The environmental component shifted toward coordinated eco-economic governance. The governance-related component broke interdepartmental barriers, while the financial component showed weak links between resource-based indicators and consumption/employment indicators. Tajikistan’s SDG coupling evolved through three phases: survival-oriented (2001-2012), policy integration (2013-2018), and shock adaptation (2019-2023). These phases were driven by policy changes, resource industries, governance optimization, and external factors. This study enriches the analytical framework for understanding the dynamic coupling of SDGs in mountainous resource-dependent countries and provides empirical evidence to support similar countries in formulating phase-specific SDG promotion strategies.
Ranna HAZIHAN , DU Hongru , HE Chuanchuan , Kobiljon Khushvakht KHUSHVAKHTZODA , Bobozoda KOMIL . Coupling dynamics of SDGs in Tajikistan from 2001 to 2023[J]. Regional Sustainability, 2026 , 7(1) : 100295 . DOI: 10.1016/j.regsus.2026.100295
Table 1 Description of the selected indicators and identifiers. |
| Component type | Indicators and identifiers |
|---|---|
| Social component | The proportion of the population below the poverty line of 6.85 USD/d at 2017 purchasing power parity (SDG 1_S01), dietary energy supply (SDG 2_S02), prevalence of malnutrition (SDG 2_S03), the percentage of stunted children under 5 years of age (SDG 2 _S04), prevalence rate of anemia among pregnant women (SDG 2_S05), infant mortality rate (SDG 2_S06), adolescent fertility rate (SDG 2_S07), maternal mortality ratio (SDG 2_S08), tuberculosis incidence rate (SDG 3_S09), life expectancy at birth (SDG 3_S10), preschool enrollment rate (SDG 4_S11), primary school enrollment rate (SDG 4_S12), secondary school enrollment rate (SDG 4_S13), tertiary education enrollment rate (SDG 4_S14), male-female enrollment ratio in primary and secondary schools (SDG 4_S15), overall youth literacy rate (SDG 4_S16), higher education, teaching staff (SDG 5_S17), access to clean fuels and cooking technologies (SDG 7_S18), urban population growth rate (SDG 11_S19), the proportion of slum dwellers within the urban population (SDG 11_S20), and population using the internet (SDG 17_S21). |
| Financial component | Household final consumption expenditure (SDG 1_F01), current health expenditure (SDG 3_F02), female labor force participation rate (SDG 5_F03), female employment in industry (SDG 5_F04), primary energy intensity (SDG 7_F05), renewable energy consumption (SDG 7_F06), GDP per employed person (SDG 8_F07), GDP growth rate (SDG 8_F08), GDP per capital growth (SDG 8_F09), total unemployed persons (SDG 8_F10), total unemployed women (SDG 8_F11), international tourism receipts (SDG 8_F12), merchandise trade (SDG 8_F13), employees in the service sector (SDG 8_F14), industrial value added (SDG 9_F15), manufacturing value added (SDG 9_F16), research and development expenditure (SDG 9_F17), railway passenger traffic (SDG 9_F18), air transport passenger volume (SDG 9_F19), ratio of actual government expenditure to original approved budget (SDG 16_F20), net barter terms of trade index (SDG 17_F21), merchandise exports to high-income economies (SDG 17_F22), exports of goods and services (SDG 17_F23), merchandise imports from developing economies in East Asia and the Pacific (SDG 17_F24), net official development assistance received (SDG 17_F25), net bilateral aid flows from Development Assistance Committee donors, Republic of Korea (SDG 17_F26), net inflows of foreign direct investment (SDG 17_F27), and net foreign assets (SDG 17_F28). |
| Governance-related component | Grain import dependency ratio (SDG 2_G01), Political Stability and Absence of Violence/Terrorism (SDG 2_G02), physician density (SDG 3_G03), hospital beds (SDG 3_G04), out-of-pocket expenditure as a percentage of current health expenditure (SDG 3_G05), professional and technical institutions (SDG 4_G06), tertiary education institutions (SDG 4_G07), proportion of women in national parliaments (SDG 5_G08), Women, Business and Law Index score (SDG 5_G09), population using at least basic drinking water services (SDG 6_G10), population using safely managed drinking water services (SDG 6_G11), population using at least basic sanitation services (SDG 6_G12), population practicing open defecation (SDG 6_G13), electrification rate (SDG 7_G14), scientific and technical journal articles (SDG 9_G15), railway line density (SDG 9_G16), standard deviation of the Control of Corruption index (SDG 16_G17), and tax revenue (SDG 16_G18). |
| Environmental component | Grain production (SDG 2_E01), per capita food supply variability (SDG 2_E02), proportion of freshwater withdrawal to available water resources (SDG 6_E03), total renewable internal freshwater resources (SDG 7_E04), per capita forest area (SDG 11_E05), adjusted net savings, excluding particulate emission damages (SDG 12_E06), total natural resource rents (SDG 12_E07), adjusted savings: mineral resource depletion (SDG 12_E08), total greenhouse gas emissions (SDG 13_E09), annual average exposure to PM2.5 air pollution (SDG 13_E10), total emissions from crop residue burning (SDG 13_E11), renewable internal freshwater resources per capita (SDG 15_E12), permanent cropland (SDG 15_E13), and permanent meadows and pastures (SDG 15_E14). |
Note: SDG, Sustainable Development Goal; GDP, gross domestic product. Abbreviations are defined in the table and are consistent in subsequent figures and tables. |
Fig. 1. Distribution of correlation strength in Tajikistan’s Sustainable Development Goal (SDG) network. Statistical significance was defined as a P<0.05 after false discovery rate (FDR) correction. r, correlation coefficient. |
Table 2 Connotations and calculation methods of topological properties. |
| Property | Connotation | Calculation formula | Reference |
|---|---|---|---|
| Connectivity (C) | Network coupling strength (reflecting overall connection tightness) | where ∑wobserved is the sum of the weights of all edges observed in practice; and ∑wmax is the theoretical maximum total link weight for the same number of nodes (assuming all possible edge weights are 1). | Wu et al. (2022); Hu et al. (2023) |
| Transitivity (T) | Local stability of the network | where number of triangles is the number of actual triangles formed (where all three nodes are pairwise connected); and number of connected triples is the number of possible triangles (triplets of nodes that could potentially form a triangle). | Wu et al. (2022); Hu et al. (2023) |
| Modularity (Q) | Network inhomogeneity | where m is the total edge weight of the network; n is the total number of nodes; Aij is the edge weight between nodes i and j (0 if not connected); ki and kj are the total connection weight of nodes i and j belong, respectively; ci and cj are the subset or community to which nodes i and j belongs, respectively; and δ(ci, cj) is the Kronecker delta function. If ci=cj, the value equals to 1; otherwise, it is 0. | Hu et al. (2023) |
| Coupling efficiency (Coupling E) | Transmission speed of coupling effects | where tideal is the ideal traversal time; tobserved is the actual traversal time; n is the number of nodes; G represents the network under study; wij is the edge weight between nodes i and j; and 1/wij represents the transmission time between nodes i and j. | Yuan et al. (2021) |
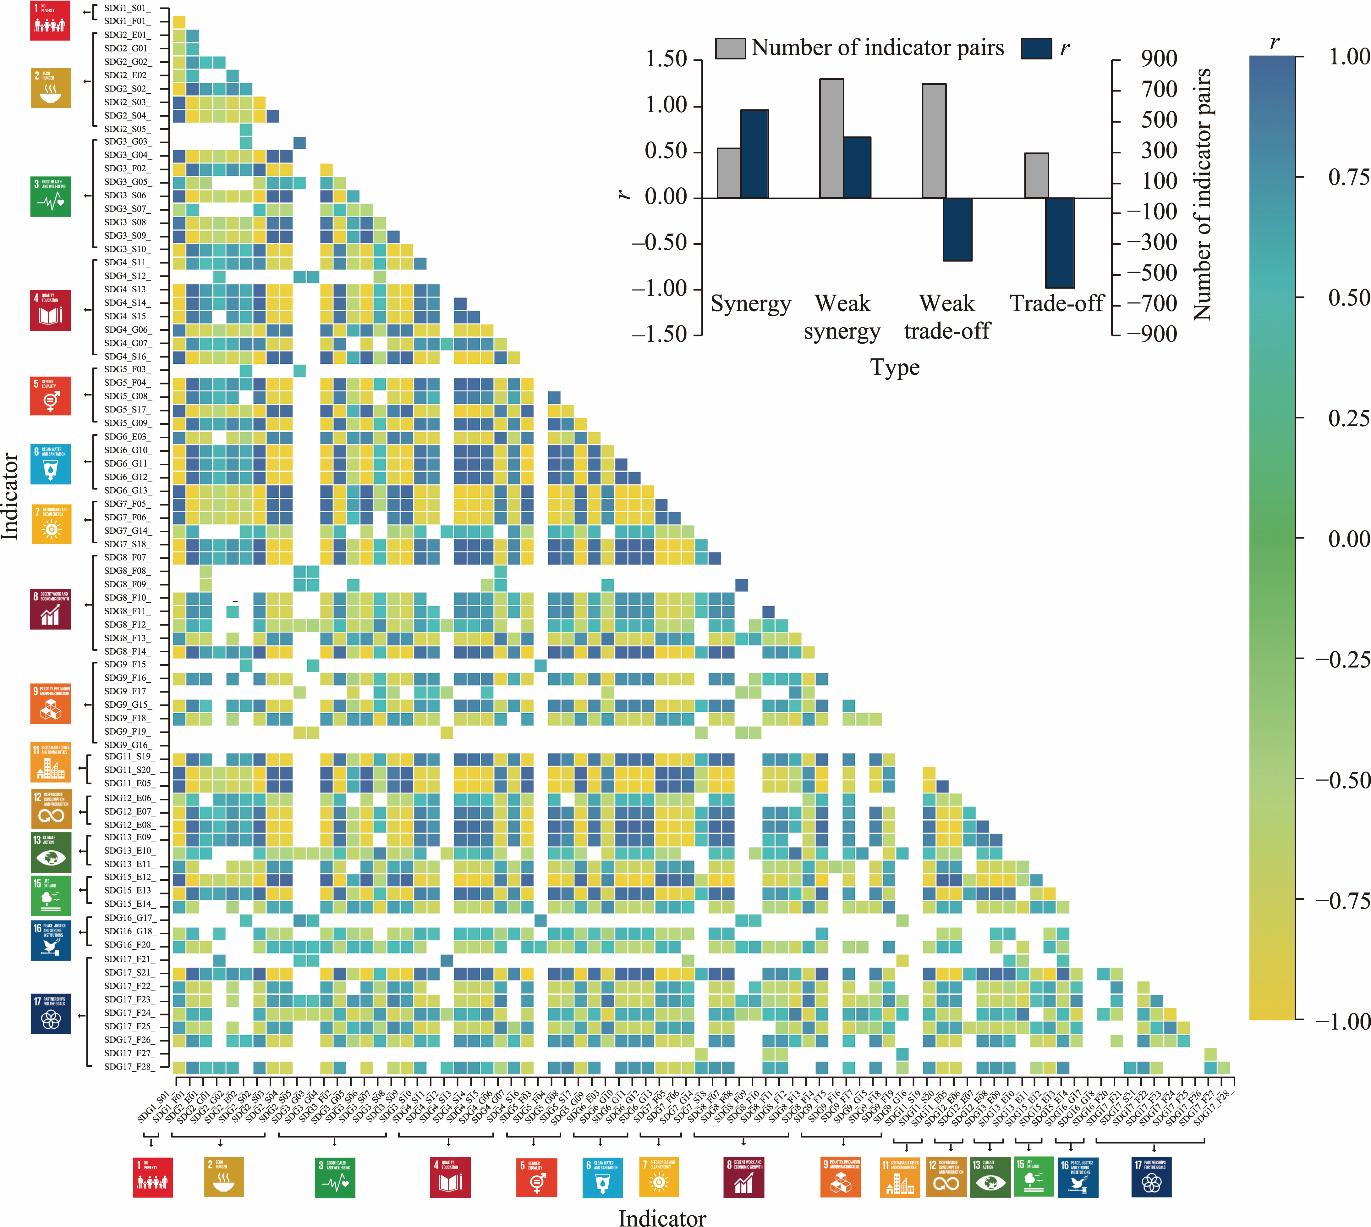
Fig. 2. Heatmap of the synergistic and trade-off relationships among 81 SDG indicators of Tajikistan from 2001 to 2023. The meaning of the heatmap colors is as follows: the bluer the color, the greater the positive value of the Spearman’s rank r of the indicator pair, indicating a stronger synergistic and promoting relationship between the indicators, with the synergistic effect as the main feature; the yellower the color, the greater the negative value of the Spearman’s rank r of the indicator pair, indicating a stronger trade-off and restrictive relationship between the indicators, with more prominent trade-off characteristics. |
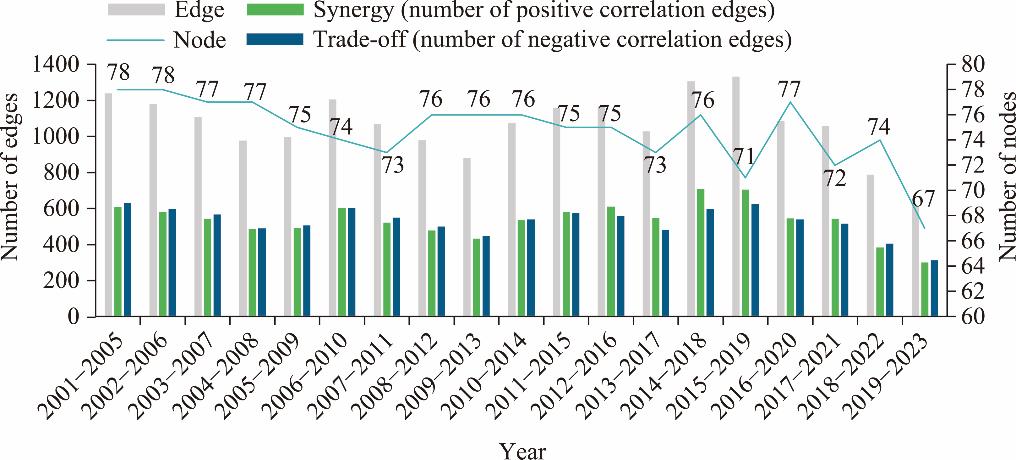
Fig. 3. Dynamic changes of the SDG coupled network structure in Tajikistan from 2001 to 2023. Edge refers to the number of significant associations filtered by Spearman’s rank correlation; synergy corresponds to the number of positive correlation edges; trade-off corresponds to the number of negative correlation edges; node refers to the number of indicators included in the network within the sliding window. |
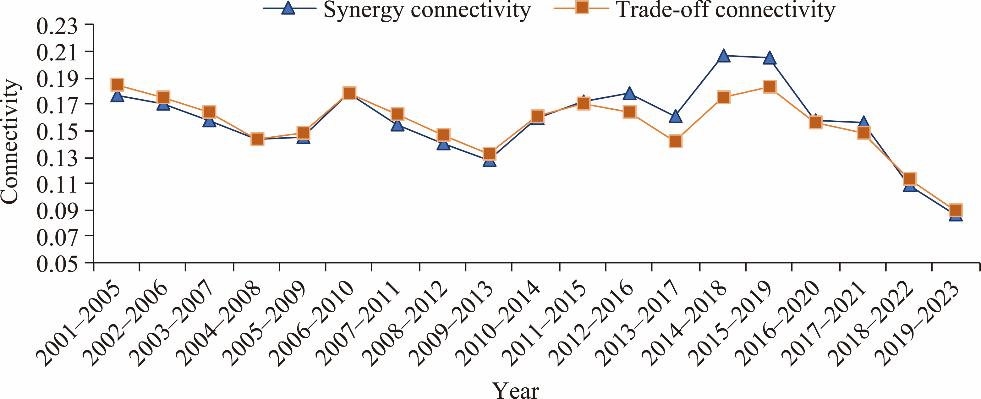
Fig. 4. Connectivity trend changes in the SDG global network in Tajikistan from 2001 to 2023. Synergy connectivity reflects the intensity and scope of positive associations between SDG indicators in the network, while trade-off connectivity reflects the intensity and scope of negative SDG associations. |
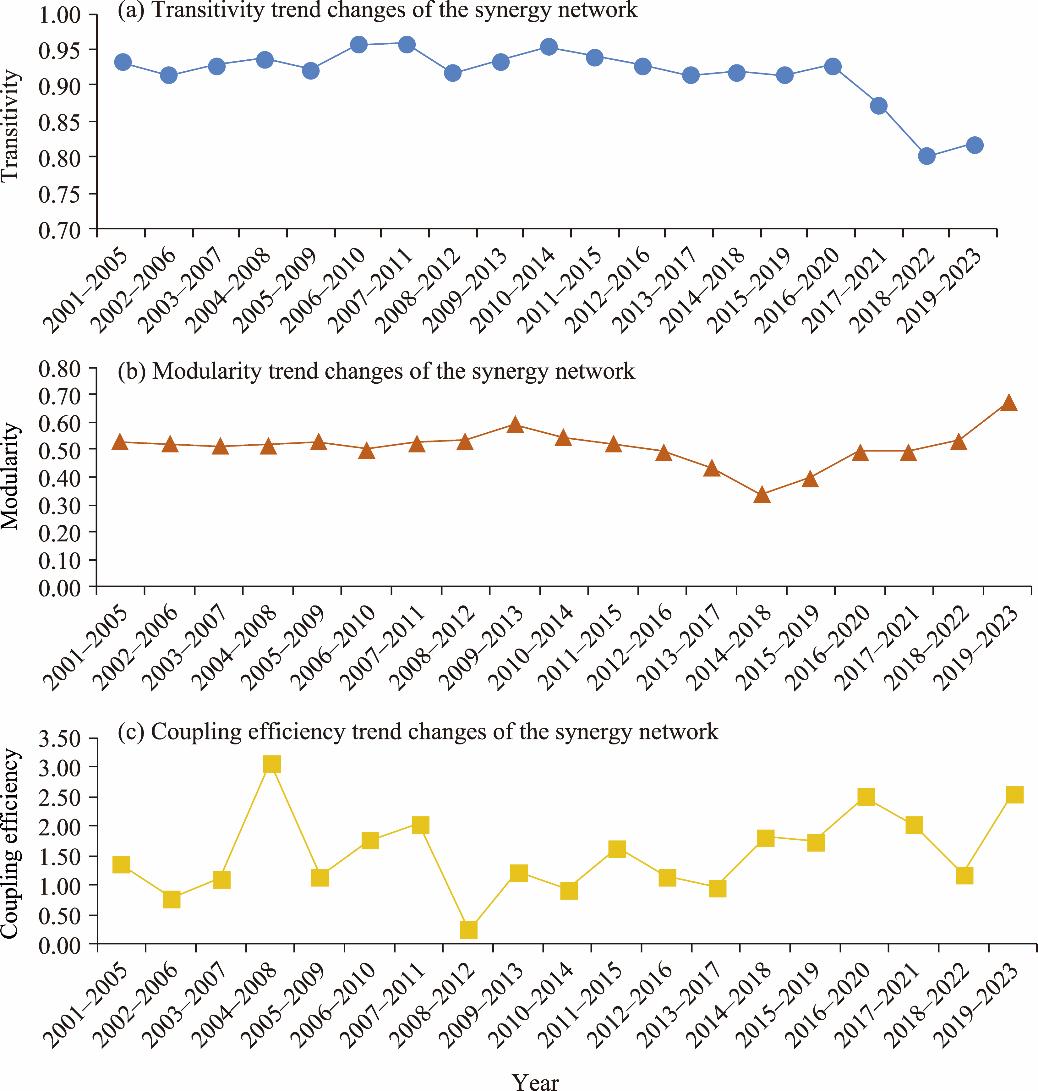
Fig. 5. Changes in global network coupling strength characteristics. (a), transitivity trend changes of the synergy network; (b), modularity trend changes of the synergy network; (c), coupling efficiency trend changes of the synergy network. |
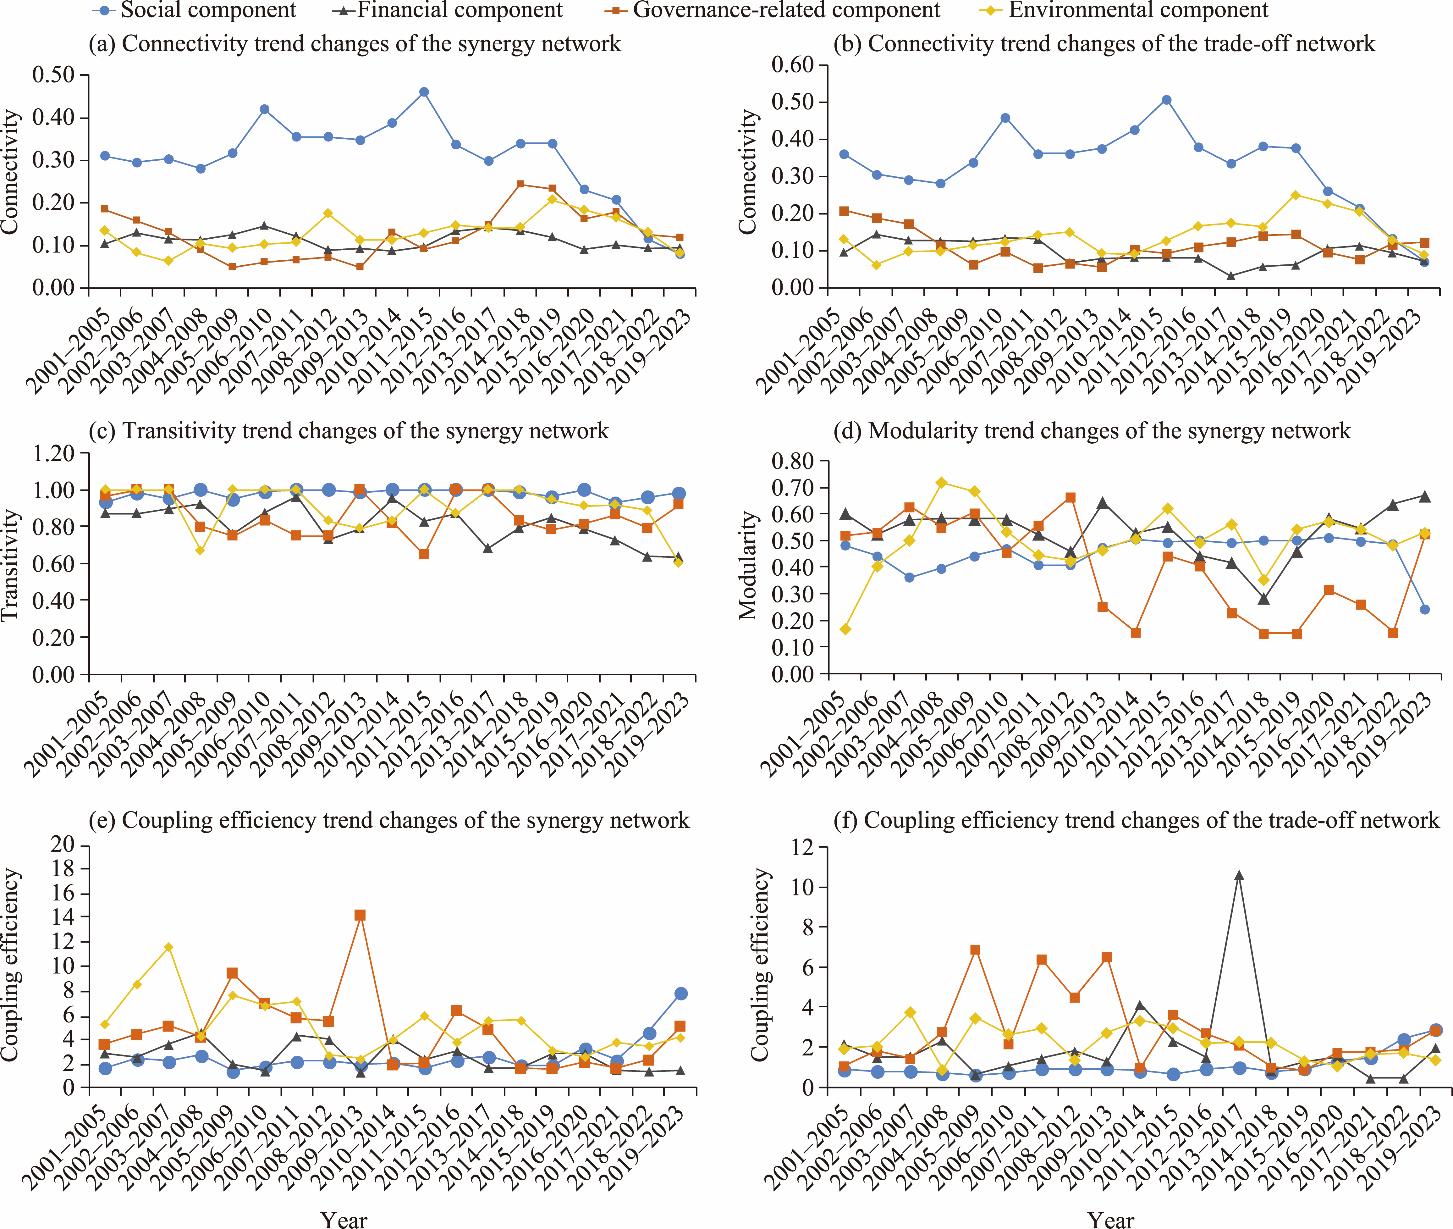
Fig. 6. Changes in the coupling strength characteristics of component networks. (a), connectivity trend changes of the synergy network; (b), connectivity trend changes of the trade-off network; (c), transitivity trend changes of the synergy network; (d), modularity trend changes of the synergy network; (e), coupling efficiency trend changes of the synergy network; (f), coupling efficiency trend changes of the trade-off network. Transitivity, by topological connotation, measures local nodes’ ability to form stable connected clusters, and modularity reflects the independence of network functional subgroups—both necessary for identifying positive, stable subgroups supporting SDG advancement in the synergy network. Whereas the trade-off network centers on negative conflict intensity—rendering properties like transitivity and modularity analytically valueless—these structural metrics were calculated only for the synergy network. |
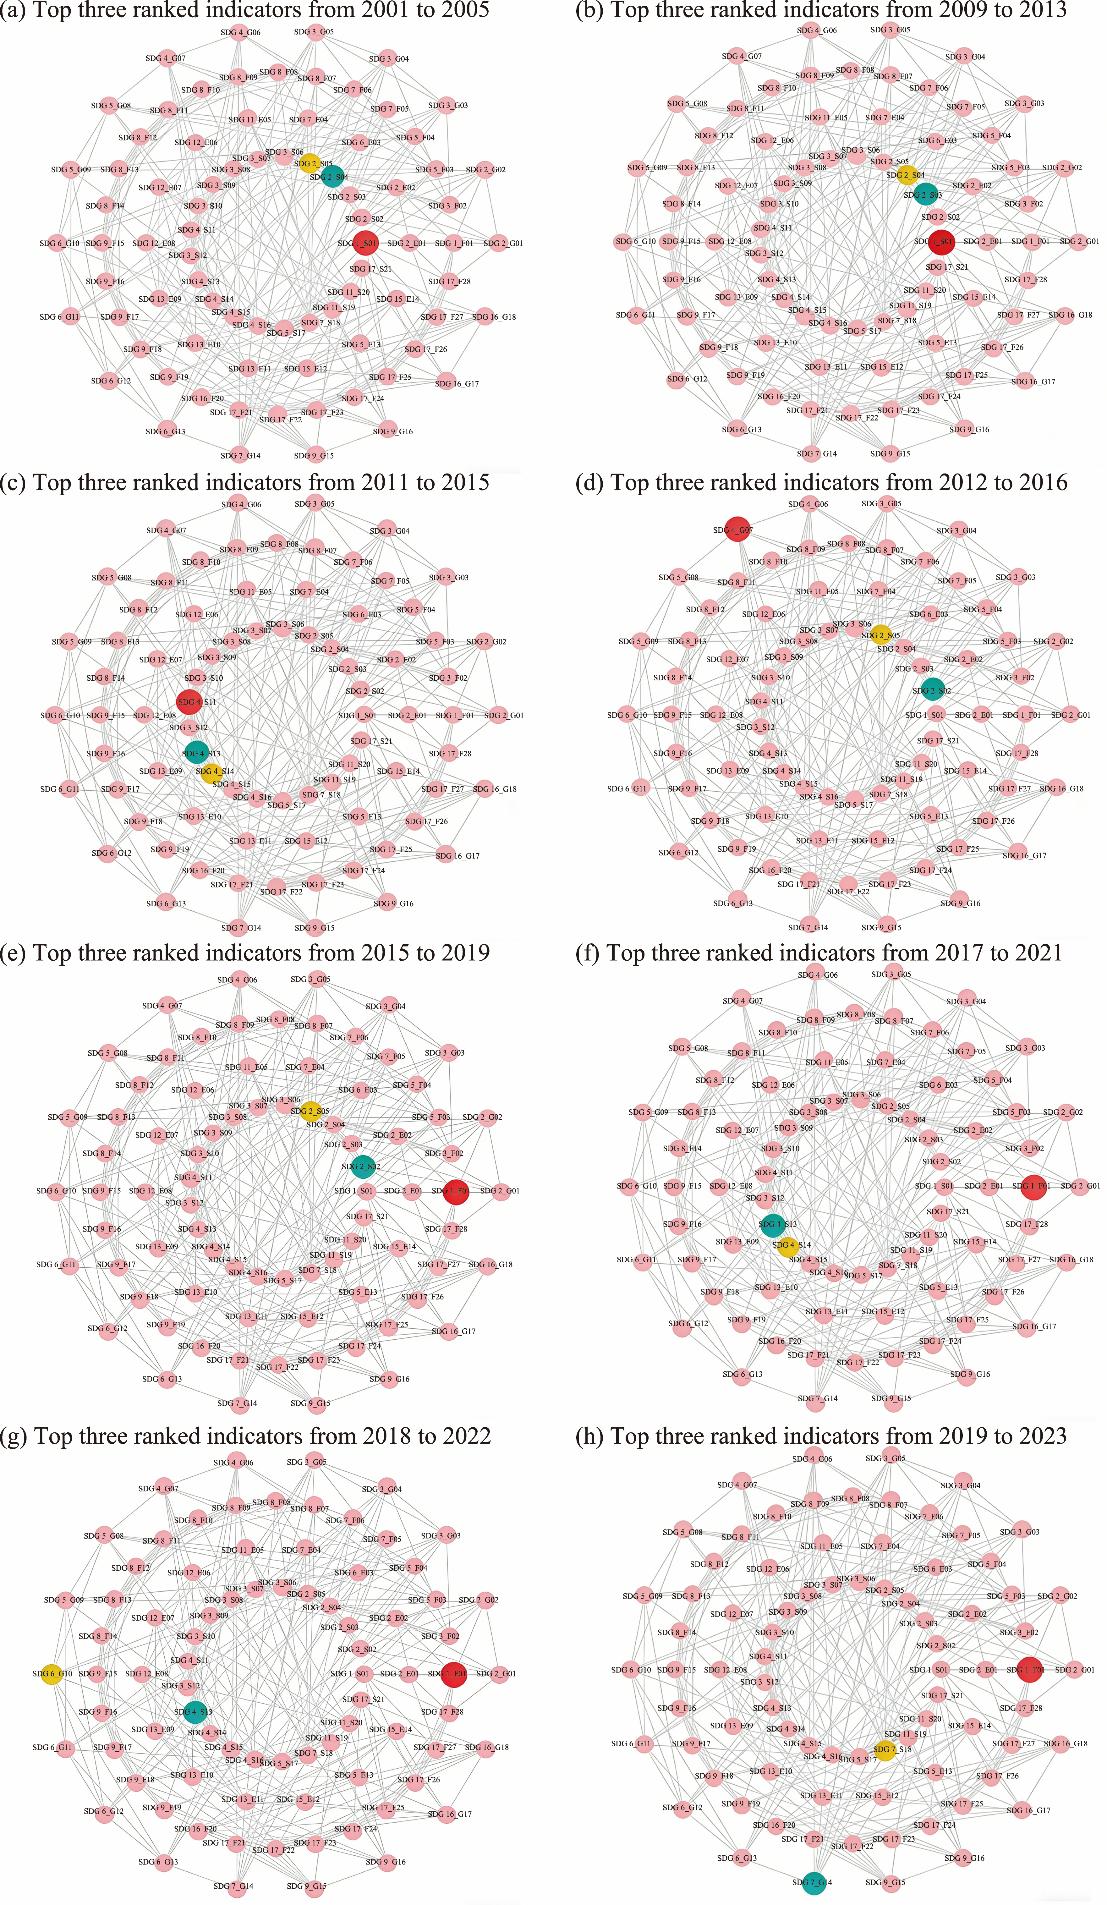
Fig. 7. Collaborative hub of SDG coupling network during 2001-2005 (a), 2009-2013 (b), 2011-2015 (c), 2012-2016 (d), 2015-2019 (e), 2017-2021 (f), 2018-2022 (g), and 2019-2023 (h). Points of different sizes represent synergy hubs in each sliding window. Larger points indicate higher rankings, meaning that the hubs have closer relationships with other indicators and more prominent influence in the network. |
| [1] |
|
| [2] |
|
| [3] |
|
| [4] |
|
| [5] |
|
| [6] |
|
| [7] |
|
| [8] |
|
| [9] |
|
| [10] |
|
| [11] |
|
| [12] |
|
| [13] |
|
| [14] |
|
| [15] |
|
| [16] |
|
| [17] |
|
| [18] |
|
| [19] |
|
| [20] |
|
| [21] |
|
| [22] |
|
| [23] |
|
| [24] |
|
| [25] |
|
| [26] |
Ministry of Defence of the Republic of Tajikistan, 2016. National Development Strategy of the Republic of Tajikistan for the Period until 2030. [2025-06-01]. https://leap.unep.org/en/countries/tj/national-legislation/national-development-strategy-republic-tajikistan-period-until (in Russian).
|
| [27] |
|
| [28] |
|
| [29] |
|
| [30] |
|
| [31] |
|
| [32] |
|
| [33] |
|
| [34] |
Republic of Tajikistan, 2007. National Development Strategy of the Republic of Tajikistan for the Period to 2015. [2025-07-01]. https://leap.unep.org/en/countries/tj/national-legislation/national-development-strategy-republic-tajikistan-period-2015.
|
| [35] |
Republic of Tajikistan, 2008. Concept of Environmental Protection in the Republic of Tajikistan (Decree No. 645). [2025-04-03].http://fp7.cawater-info.net/library/rus/tj_env_concept_2008.pdf (in Russian).
|
| [36] |
Republic of Tajikistan, 2013a. Living Standards Improvement Strategy of Tajikistan for 2013-2015. [2025-04-26]. https://leap.unep.org/en/countries/tj/national-legislation/living-standards-improvement-strategy-tajikistan-2013-2015.
|
| [37] |
Republic of Tajikistan, 2013b. Strategy for Countering Corruption in the Republic of Tajikistan for the Period of 2013 - 2020. [2025-04-30]. https://www.informea.org/en/content/legislation/strategy-countering-corruption-republic-tajikistan-period-2013-2020 (in Russian).
|
| [38] |
Resolution of the Government of Tajikistan, 2007. Poverty Reduction Strategy of the Republic of Tajikistan for 2007-2009 . [2025-04-03]. https://www.informea.org/en/content/legislation/poverty-reduction-strategy-republic-tajikistan-2007-2009.
|
| [39] |
|
| [40] |
|
| [41] |
|
| [42] |
|
| [43] |
|
| [44] |
United Nations, 2015. Transforming Our World: The 2030Agenda for Sustainable Development. New York: United Nations.
|
| [45] |
|
| [46] |
|
| [47] |
|
| [48] |
|
| [49] |
|
| [50] |
|
| [51] |
|
| [52] |
|
/
| 〈 |
|
〉 |