
Vascular plant diversity and distribution pattern in Tajikistan: A global hotspot of diversity
The first and second authors contributed equally to this work
Received date: 2025-08-31
Revised date: 2025-12-08
Accepted date: 2026-01-05
Online published: 2026-03-11
Tajikistan represents a core region of the biodiversity hotspot in Central Asian mountains and has exceptional vascular plant diversity. However, the species diversity of the country faces urgent conservation challenges. There has been a lack of a comprehensive and multidimensional assessment to inform strategic conservation planning. Therefore, this study integrated 4 key biodiversity indices including species richness (SR), phylogenetic diversity (PD), threatened species richness (TSR), and endemic species richness (ESR) to map species diversity distribution patterns, identify conservation gaps, and elucidate their effects of climatic factors. This study revealed that species diversity shows a clear trend of decreasing from the western region to the eastern region of Tajikistan. The central-western mountains (specifically the Gissar-Darvasian and Zeravshanian regions) emerge as irreplaceable biodiversity hotspots. However, we found a severe spatial mismatch between these priority areas and the existing protected areas (PAs). Protection coverage for all hotspots was alarmingly low, ranging from 31.00% to 38.00%. Consequently, a critical 64.80% of integrated priority areas fall outside of the current PAs, representing a major conservation gap. This study identified precipitation seasonality and isothermality as the principal drivers, collectively explaining over 50.00% of the diversity variation and suggesting high vulnerability to hydrological shifts. Furthermore, we detected significant geographic sampling bias in the public biodiversity databases, with the most critical hotspot being systematically under-sampled. This study provides a robust scientific basis for conservation action, highlighting the urgent need to strategically expand PAs in the under-protected southwestern region and to mitigate critical sampling gaps through targeted data digitization and field surveys. These measures are indispensable for securing Tajikistan’s unique biodiversity and achieving the Kunming-Montreal Global Biodiversity Framework Target 3 (“30×30 Protection”).
ZHOU Yixin , MA Suliya , LI Wenjun , Parvina KURBONOVA , Mariyo BOBOEV , LI Yufan , Hikmat HISORIEV , MA Keping , YANG Weikang , ZHANG Yuanming . Vascular plant diversity and distribution pattern in Tajikistan: A global hotspot of diversity[J]. Regional Sustainability, 2026 , 7(1) : 100294 . DOI: 10.1016/j.regsus.2026.100294
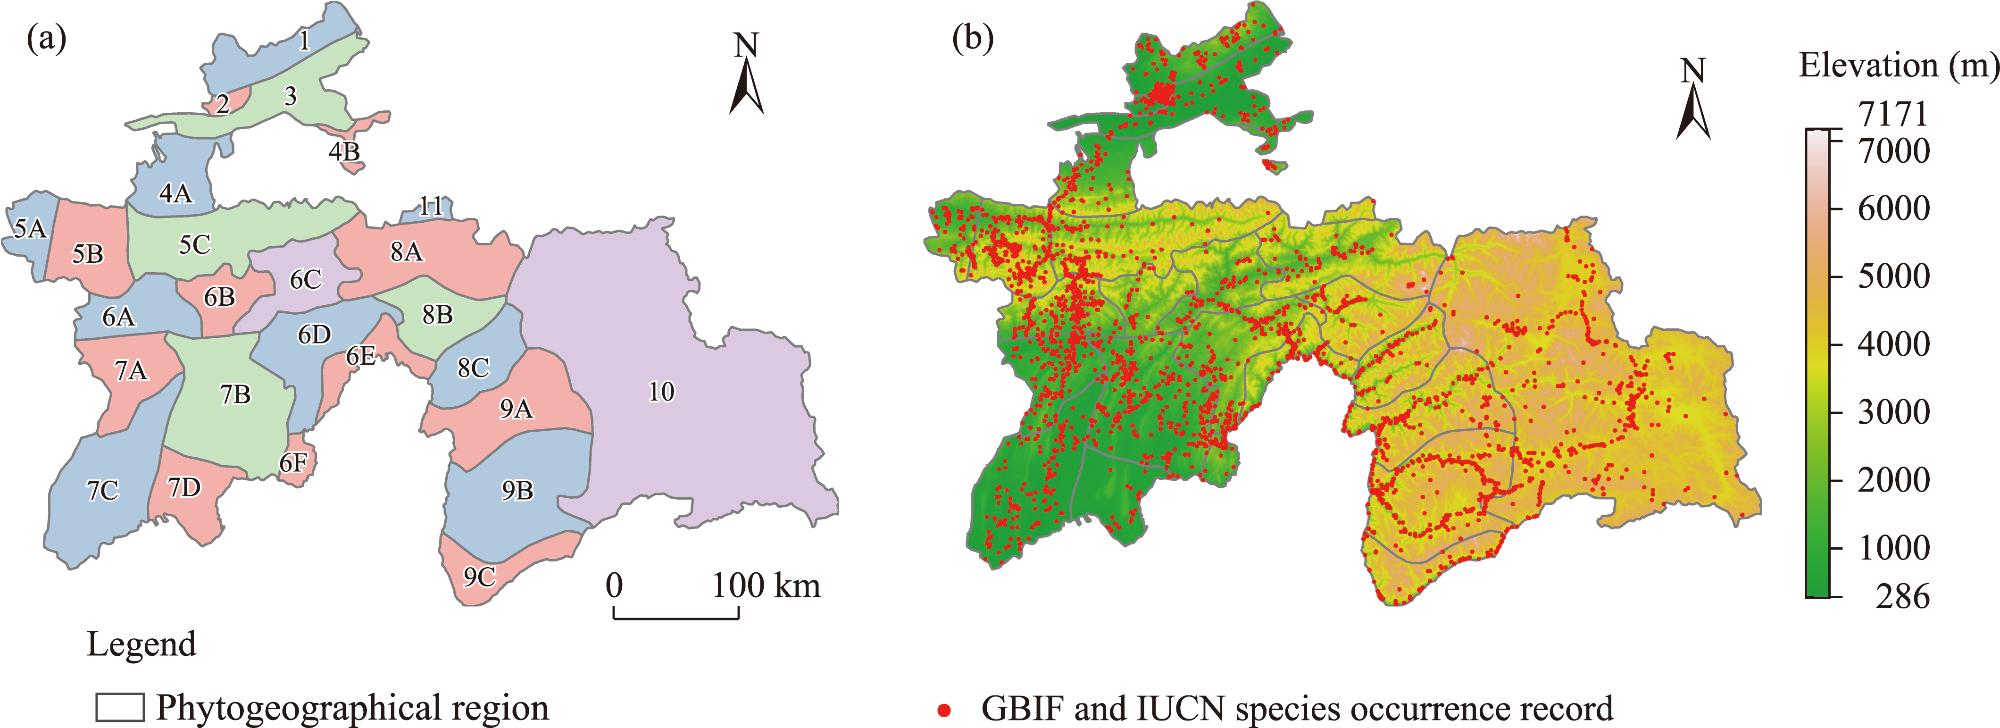
Fig. 1. Spatial distribution of phytogeographic regions (a) and quality-controlled vascular plant occurrence records (b). 1, Kuraminian; 2, Mogoltausian; 3, Prisyrdarian; 4A, Turkestanian A; 4B, Turkestanian B; 5A, Zeravshanian A; 5B, Zeravshanian B; 5C, Zeravshanian C; 6A, Gissar-Darvasian A; 6B, Gissar-Darvasian B; 6C, Gissar-Darvasian C; 6D, Gissar-Darvasian D; 6E, Gissar-Darvasian E; 6F, Gissar-Darvasian F; 7A, South Tadzhikistanian A; 7B, South Tadzhikistanian B; 7C, South Tadzhikistanian C; 7D, South Tadzhikistanian D; 8A, East Tadzhikistanian A; 8B, East Tadzhikistanian B; 8C, East Tadzhikistanian C; 9A, West Pamirian A; 9B, West Pamirian B; 9C, West Pamirian C; 10, East Pamirian; 11, Alajian. These regions were defined following the classification system established by Goncharov in the Flora Tadzhikskoi SSR (Ovchinnikov, 1957-1991). GBIF, Global Biodiversity Information Facility; IUCN, International Union for Conservation of Nature. Abbreviations are defined in the figure and are consistent in subsequent figures. Note that the figure is based on the standard map (GS(2025)1508) of the Map World (https://map.tianditu.gov.cn) marked by the National Platform for Common GeoSpatial Information Services, and the boundary of the standard map has not been modified. |
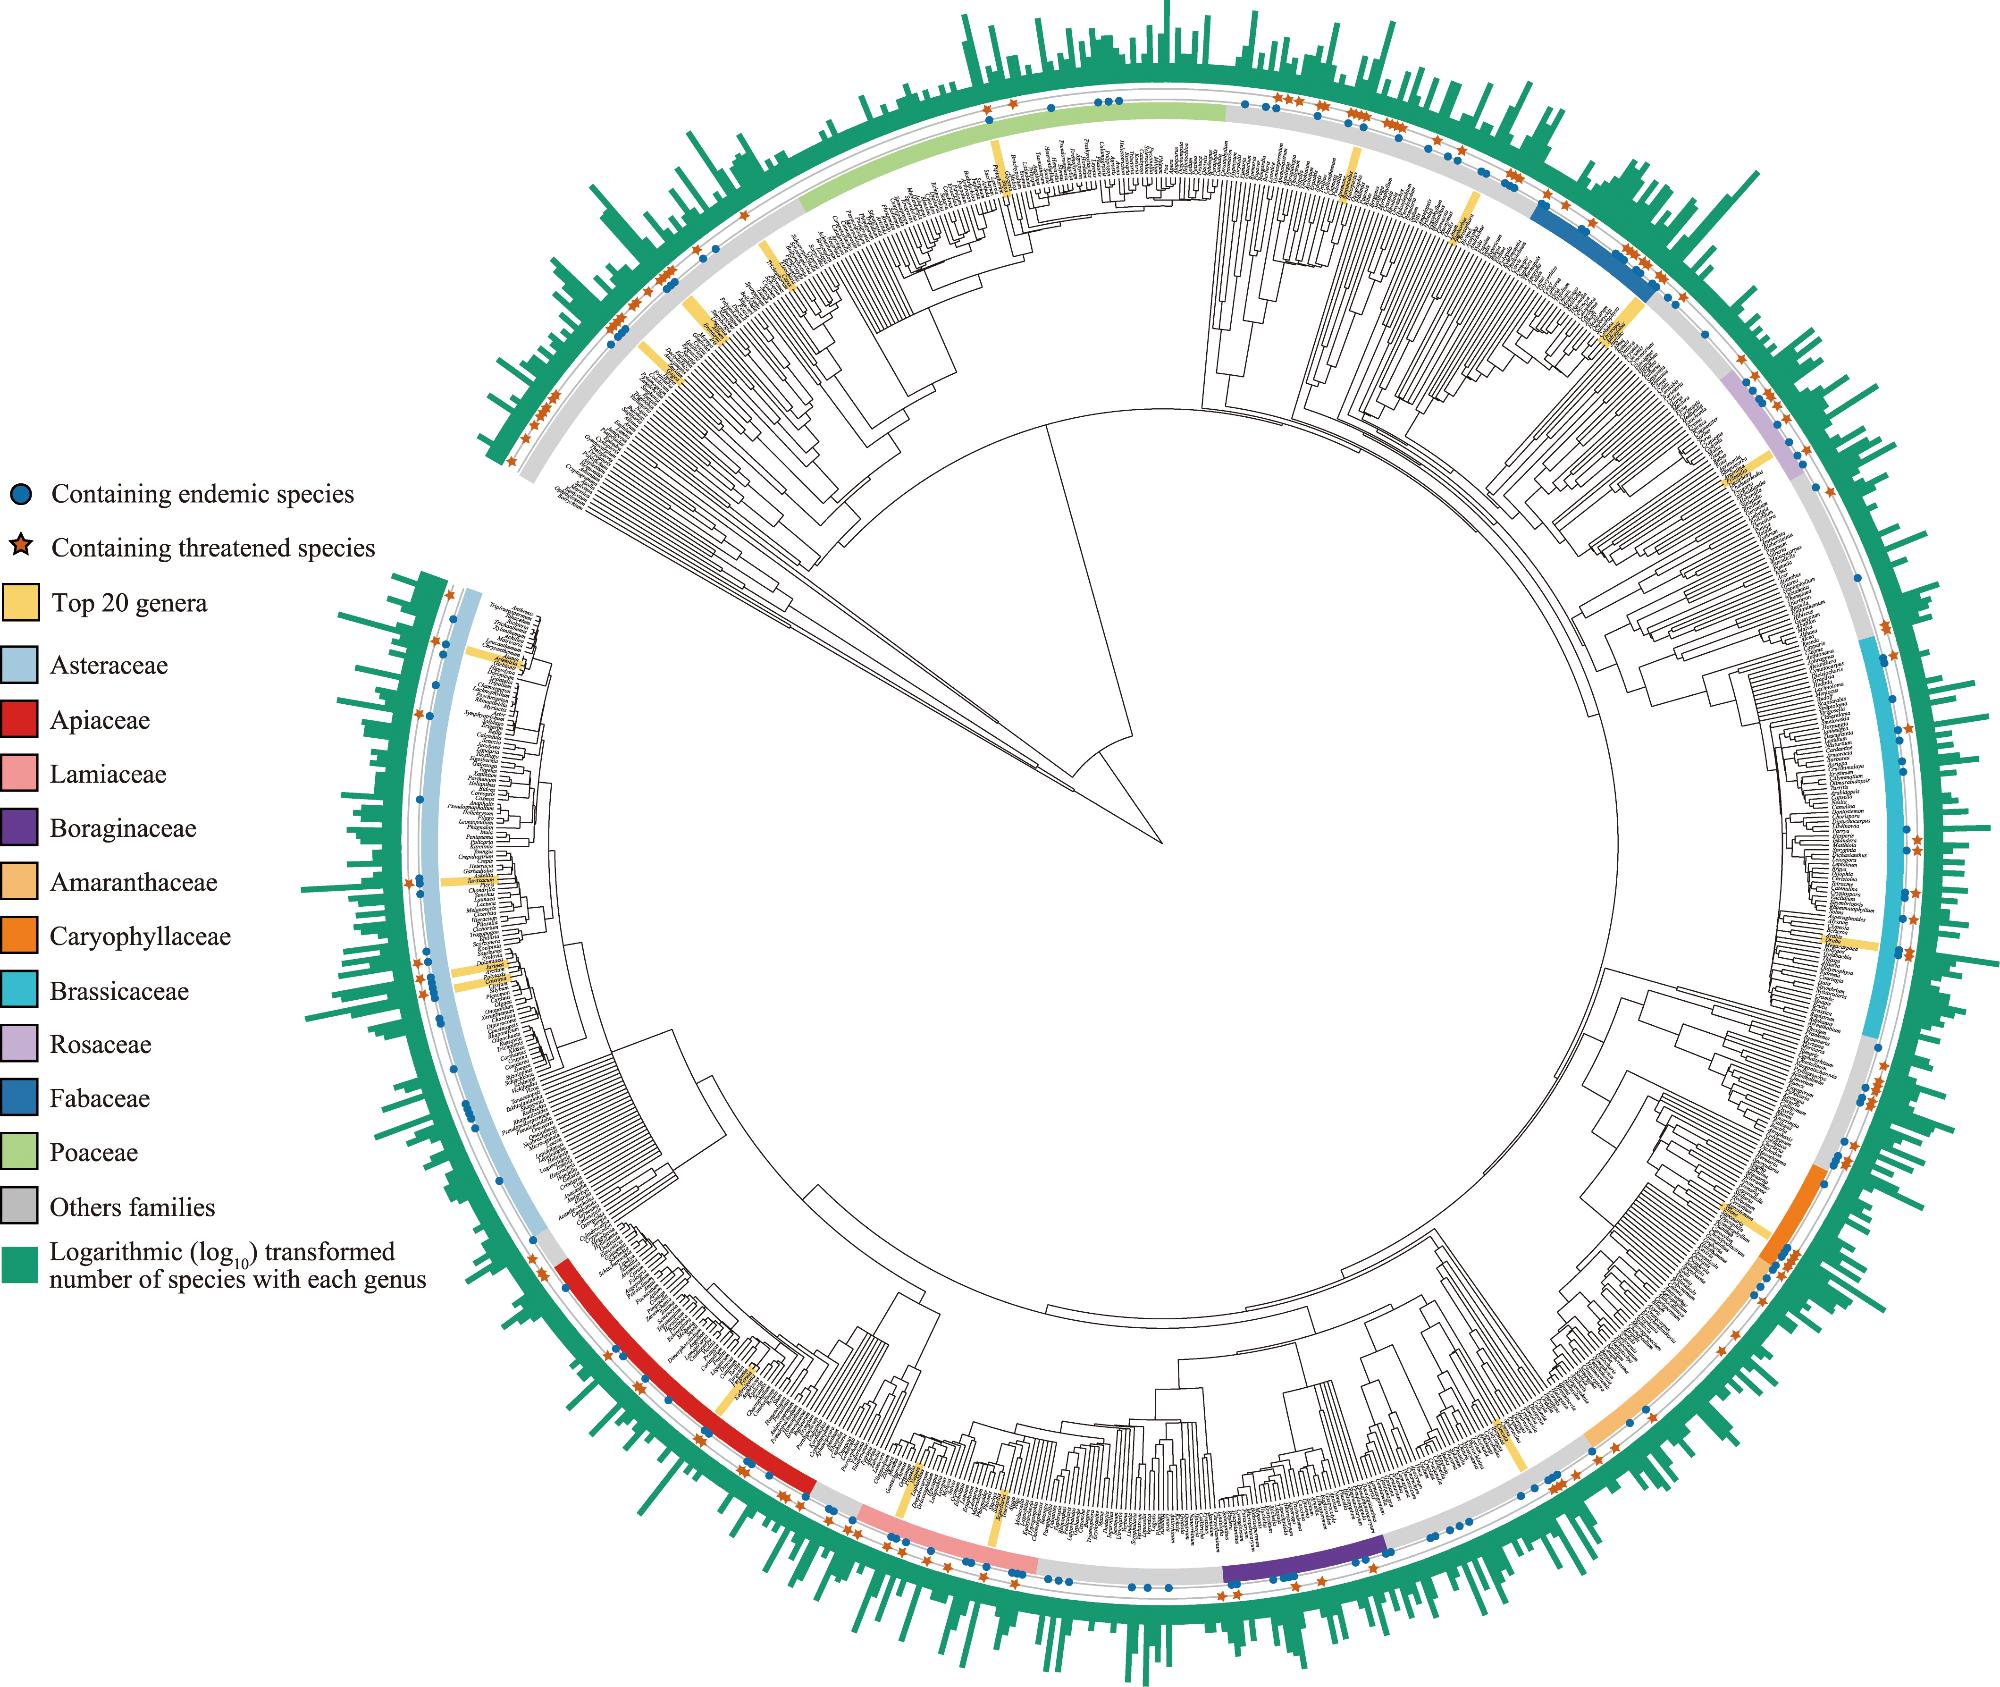
Fig. 2. Genus-level phylogenetic tree of vascular plants in Tajikistan. Genera highlighted in yellow color represent the top 20 genera with the most species richness (SR). Blue circles indicate genera containing endemic species, while brown-red stars denote genera containing threatened species. The colored sectors in the inner ring represent the top 10 families with the greatest SR. The outermost ring displays the logarithmic (log10) transformed the number of species within each genus. |
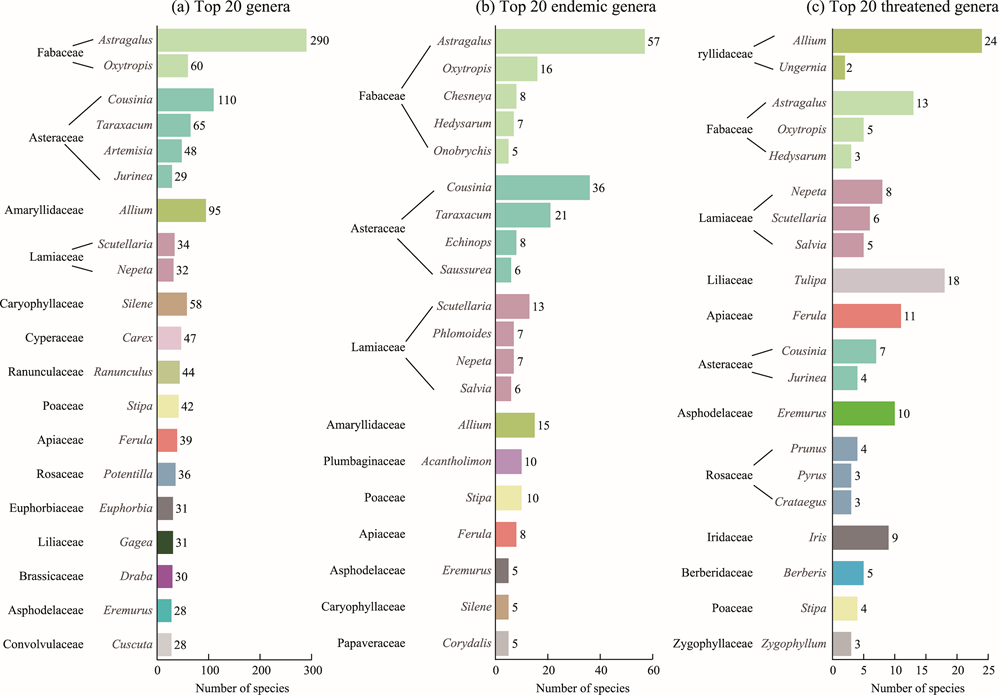
Fig. 3. Top 20 genera (a), top 20 endemic genera (b), and top 20 threatened genera (c) with the most number of species in Tajikistan. Each bar is color-coded by family, demonstrating the taxonomic distribution of diversity across different plant lineages. Genera are ranked in descending order of species number within each category. |
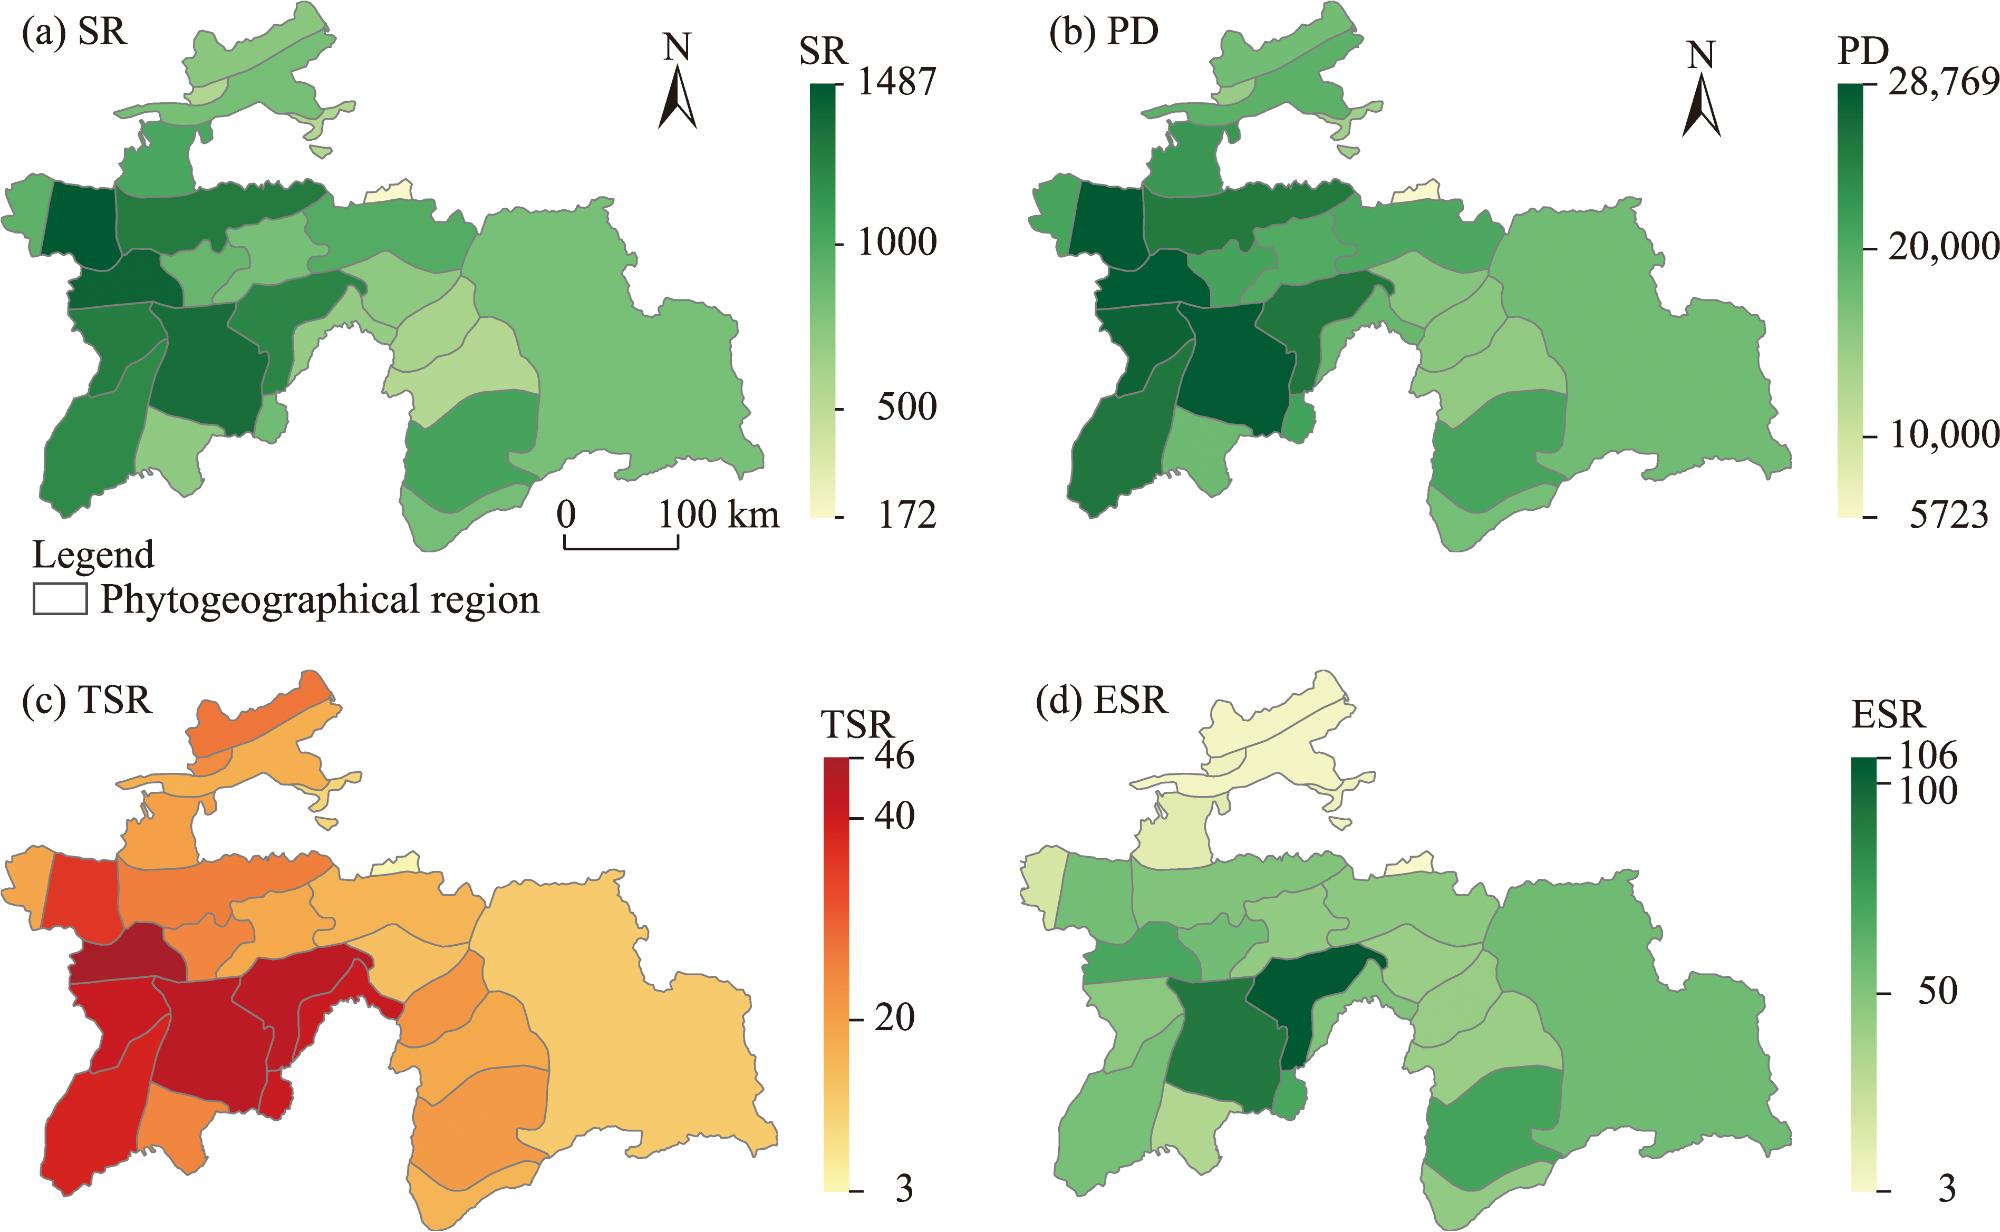
Fig. 4. Geographic distribution patterns of SR (a), PD (b), TSR (c), and ESR (d) in Tajikistan. SR, species richness; PD, phylogenetic diversity; TSR, threatened species richness; ESR, endemic species richness. |
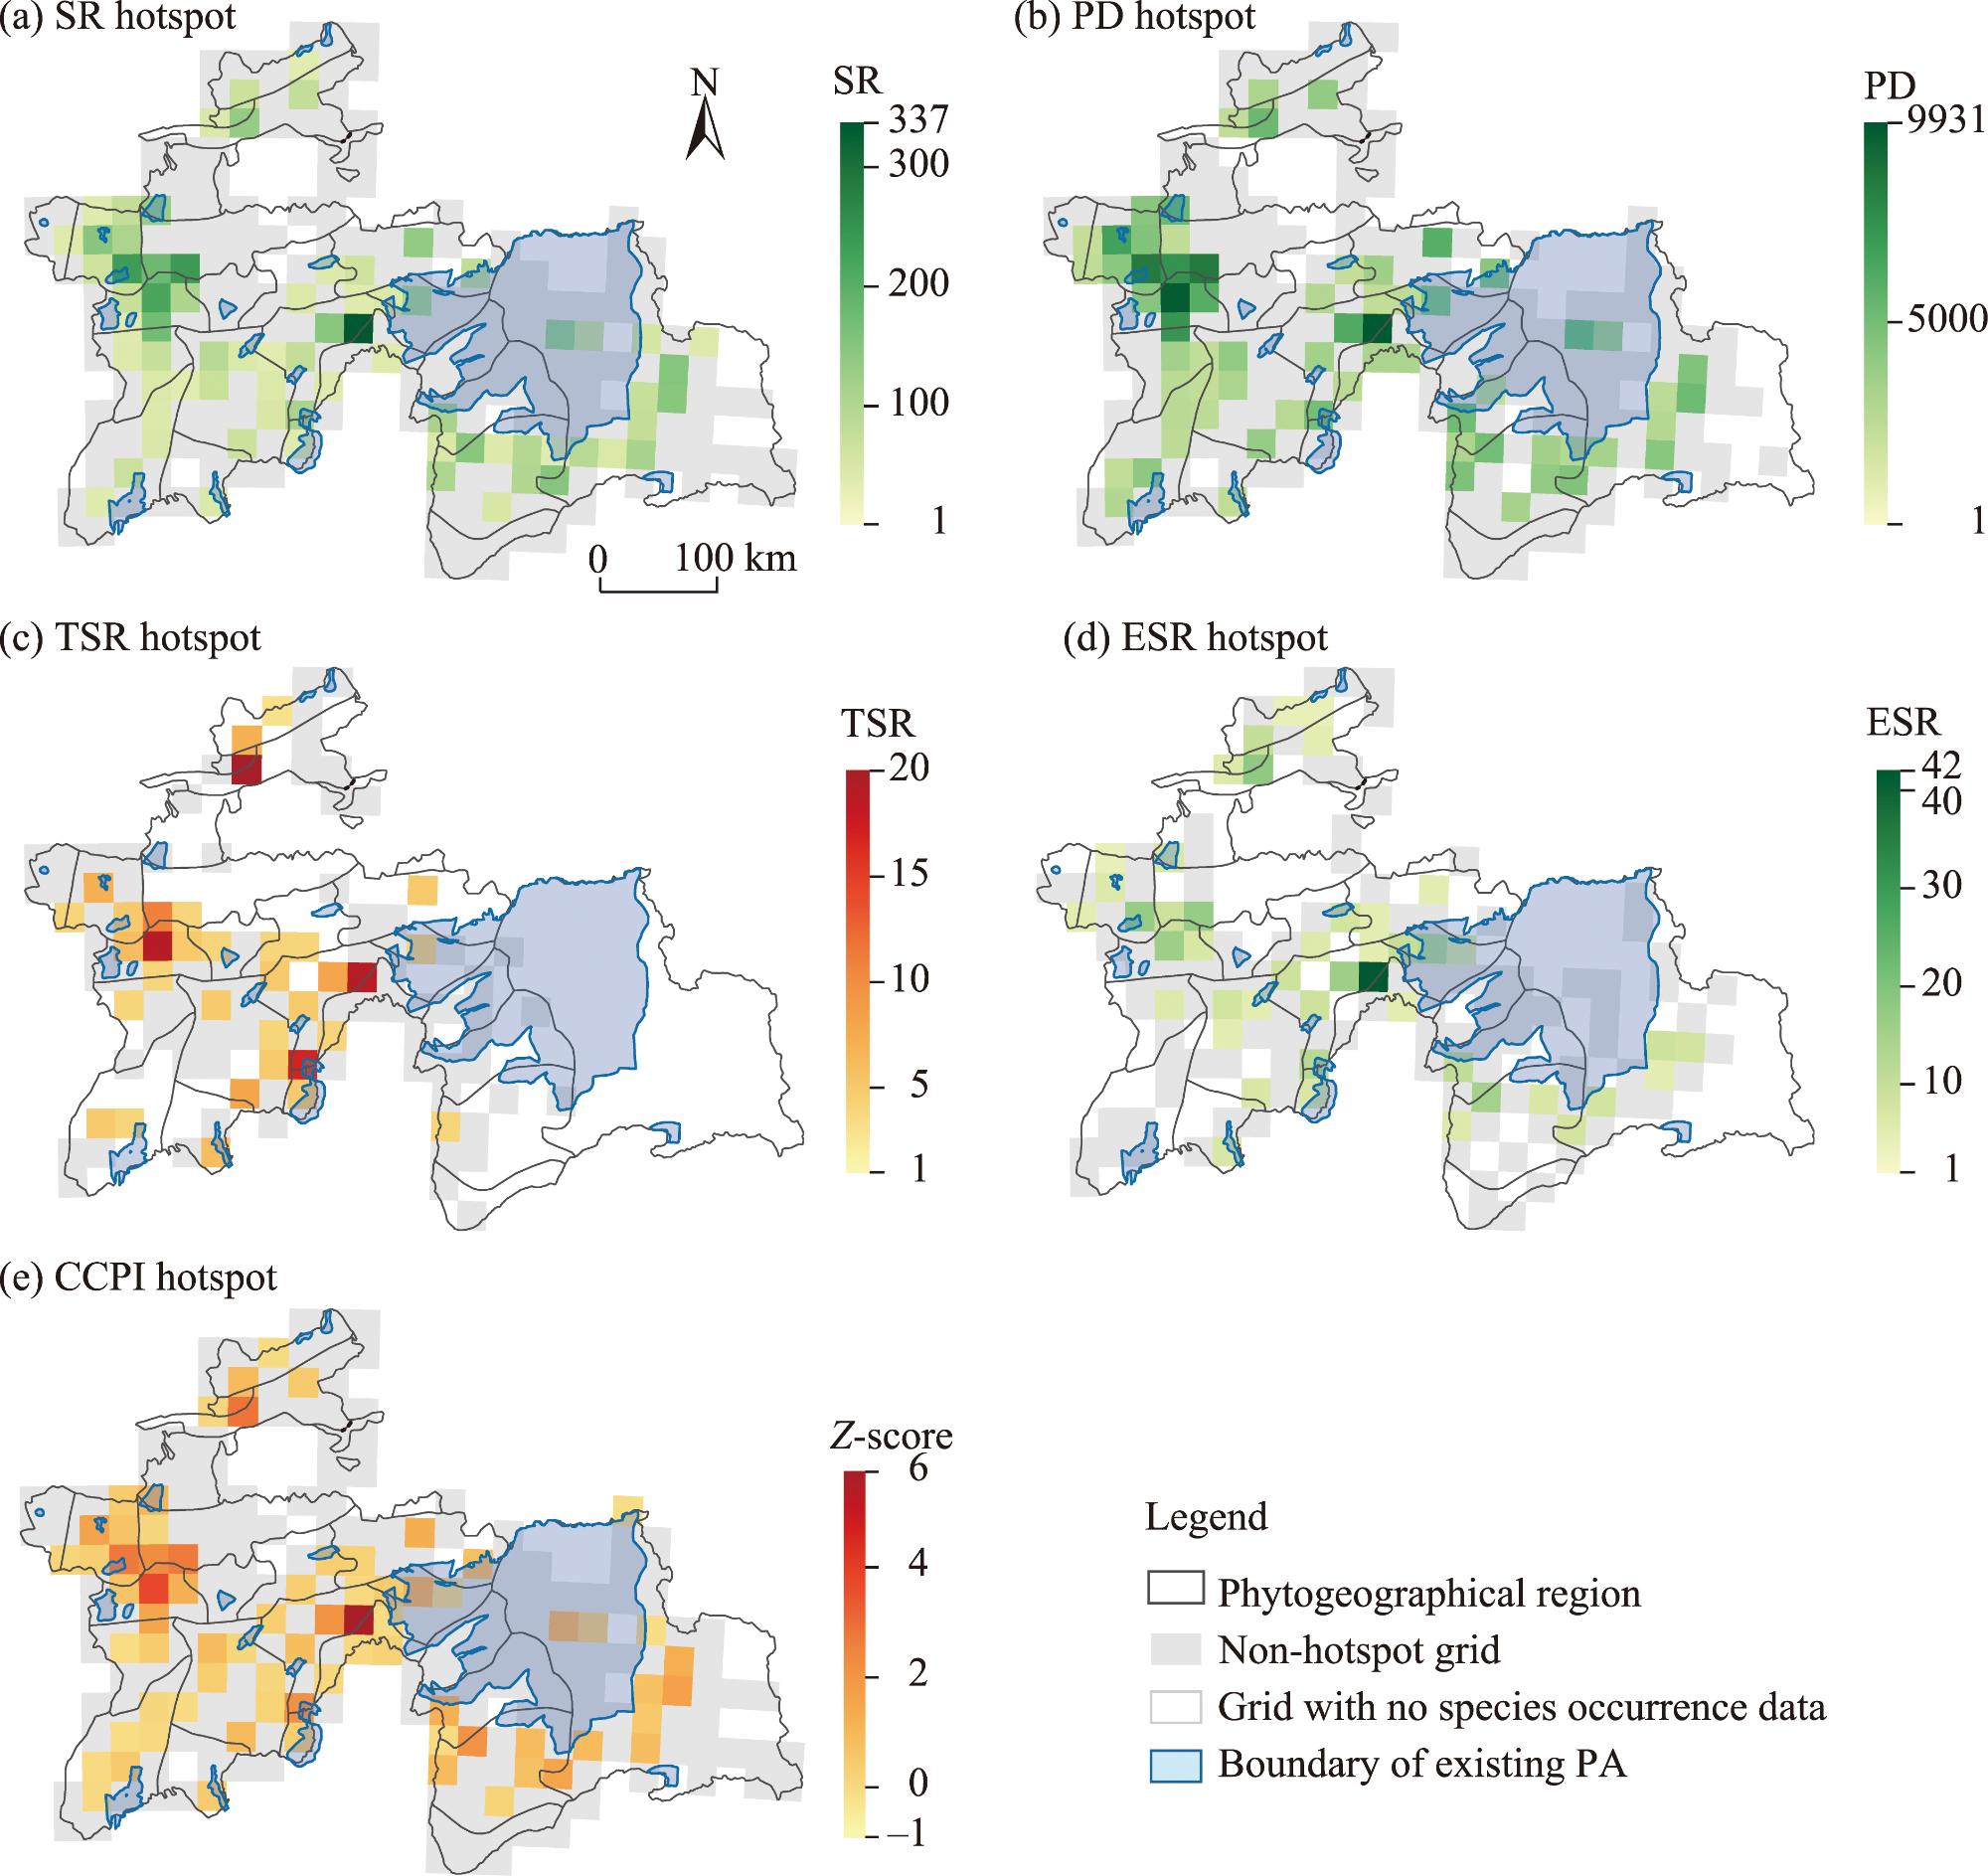
Fig. 5. Geographic distribution patterns of SR hotspot (a), PD hotspot (b), TSR hotspot (c), ESR hotspot (d), and composite conservation priority index (CCPI) hotspot (e) in Tajikistan. PA, protected area. |
Table 1 Conservation gap analysis for biodiversity hotspots of vascular plants in Tajikistan. |
| Diversity index | Total hotspot grids | Protected hotspot grids | Unprotected hotspot grids | Percentage of protection area (%) | Percentage of conservation gap area (%) |
|---|---|---|---|---|---|
| SR | 72 | 26 | 46 | 36.10 | 63.90 |
| ESR | 53 | 20 | 33 | 37.70 | 62.30 |
| TSR | 42 | 16 | 26 | 38.10 | 61.90 |
| PD | 67 | 21 | 46 | 31.30 | 68.70 |
| CCPI | 71 | 25 | 46 | 35.20 | 64.80 |
Note: SR, species richness; ESR, endemic species richness; TSR, threatened species richness; PD, phylogenetic diversity; CCPI, composite conservation priority index. Hotspot grids represent the top 30.00% of grid cells for each diversity index. Percentage of protection area and conservation gap area were calculated by overlaying hotspot grids with protected area (PA) boundary from the World Database on Protected Areas (WDPA). |
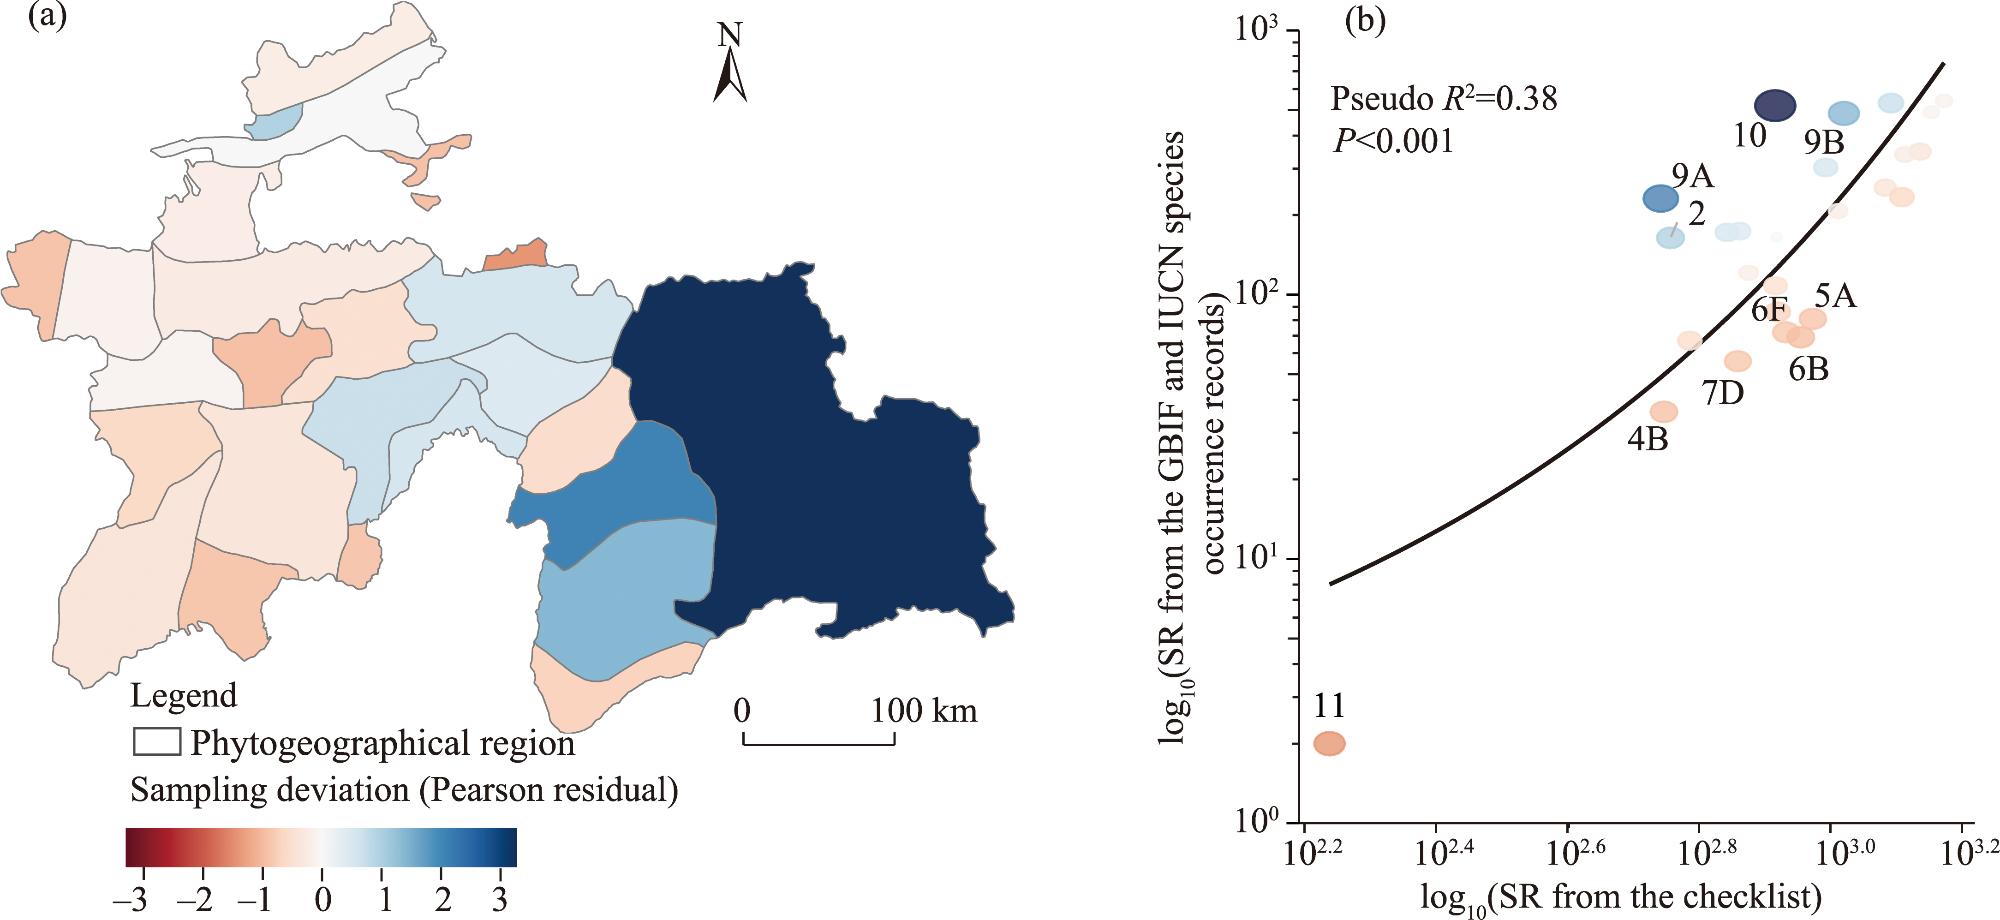
Fig. 6. Spatial distribution of sampling deviation of GBIF and IUCN species occurrence records (a) and fitted negative binomial regression curve between SR from the GBIF and IUCN species occurrence records and SR from the checklist (b) for vascular plants in Tajikistan. In Figure 6a, red region indicates under-sampled region (negative residual) where SR from the GBIF and IUCN species the occurrence record is significantly lower than SR from the checklist, while blue zone shows relatively well-sampled region (positive residual). |
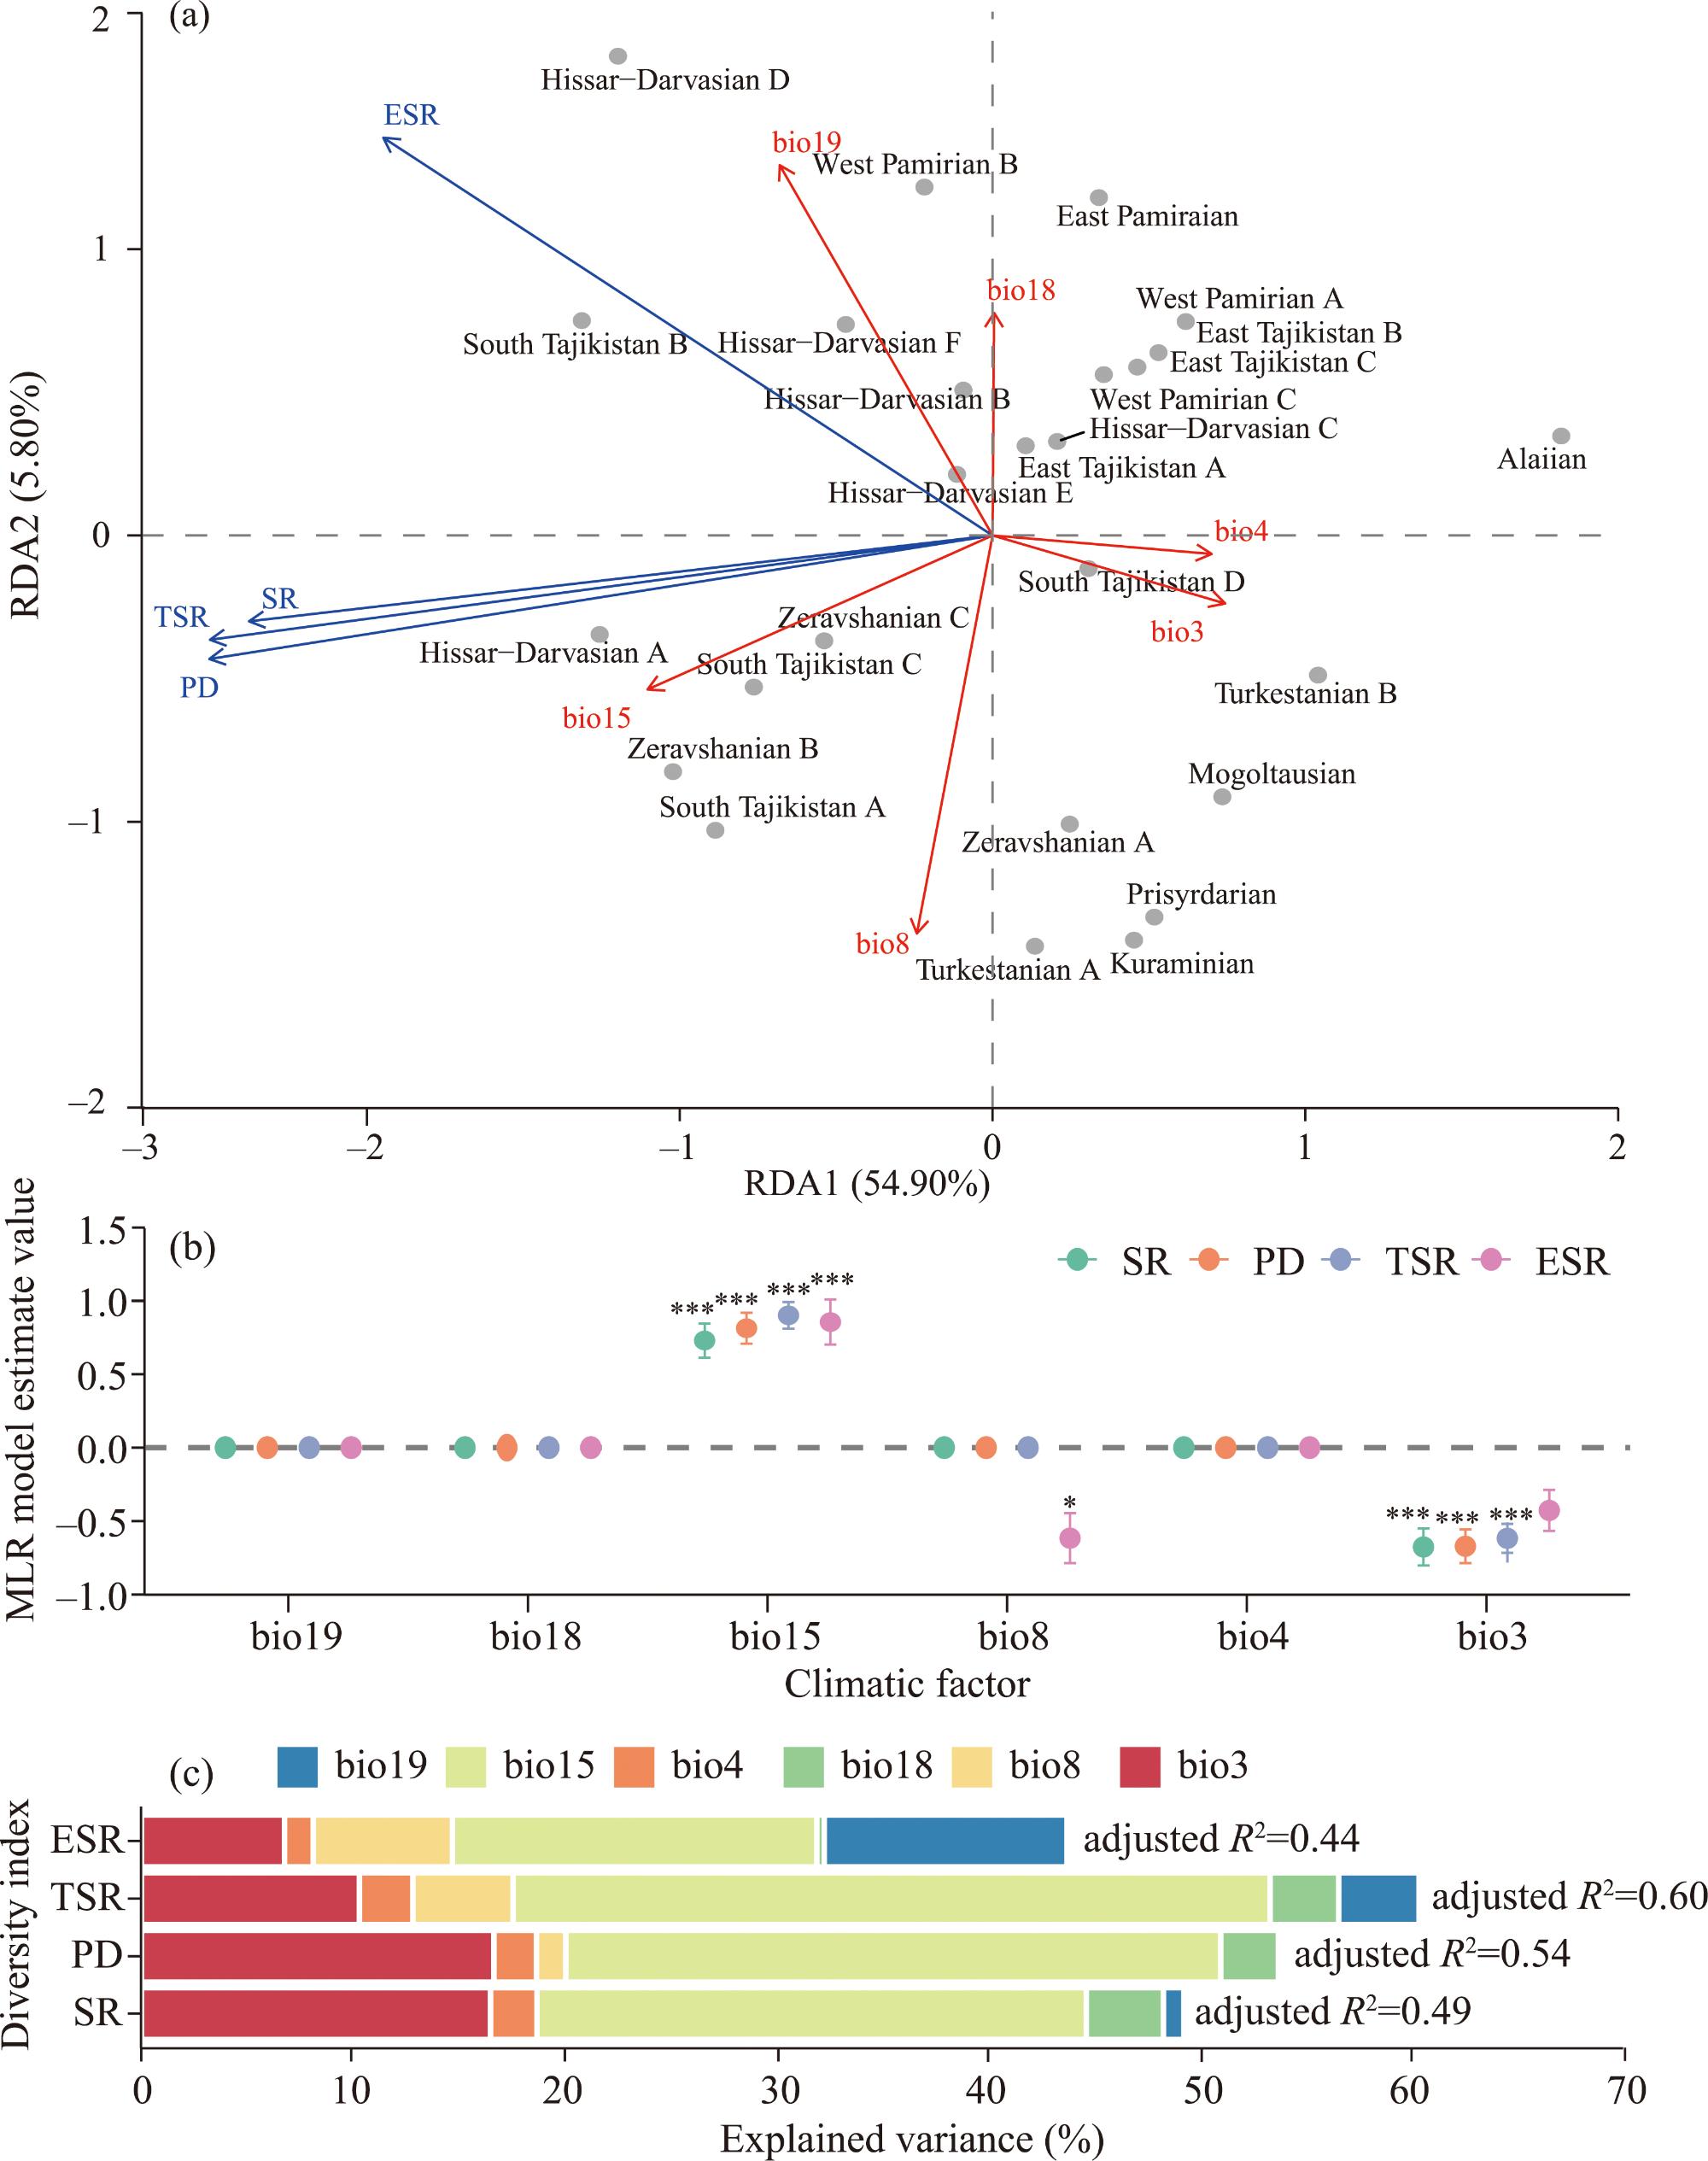
Fig. 7. Relationships among diversity index, climatic factor, and phytogeographic region for vascular plants in Tajikistan. (a), relationship among diversity index, climatic factor, and phytogeographic regions based on redundancy analysis (RDA); (b), best-fit multiple linear regression (MLR) model of diversity indices and climatic factors; (c), contribution of climatic factors to each diversity index. bio3, isothermality; bio4, temperature seasonality; bio8, mean temperature of the wettest quarter; bio15, precipitation seasonality; bio18, precipitation of the warmest quarter; bio19, precipitation of the coldest quarter. In Figure 7a, arrow length and direction indicate the strength and direction of correlations with ordination axes, respectively. Percentage in parentheses represents the proportion of the total variation explained by each axis. In Figure 7b, point represents coefficient values. Error bar indicates ±1 standard error. The vertical dashed line denotes the zero-reference line. *, P≤0.050; ***, P≤0.001. Bar length represents the percentage of independently explained variation, with different colors corresponding to different climatic factors. |
| [1] |
|
| [2] |
|
| [3] |
|
| [4] |
|
| [5] |
|
| [6] |
|
| [7] |
|
| [8] |
|
| [9] |
|
| [10] |
|
| [11] |
|
| [12] |
|
| [13] |
|
| [14] |
|
| [15] |
|
| [16] |
|
| [17] |
|
| [18] |
|
| [19] |
|
| [20] |
|
| [21] |
|
| [22] |
|
| [23] |
|
| [24] |
|
| [25] |
|
| [26] |
|
| [27] |
|
| [28] |
|
| [29] |
|
| [30] |
|
| [31] |
National Academy of Sciences of Tajikistan, 2024. The Red Book of the Republic of Tajikistan (3rd edition). Dushanbe: National Academy of Sciences of Tajikistan.
|
| [32] |
|
| [33] |
|
| [34] |
|
| [35] |
|
| [36] |
|
| [37] |
|
| [38] |
|
| [39] |
|
| [40] |
|
| [41] |
|
| [42] |
|
| [43] |
|
| [44] |
|
| [45] |
|
| [46] |
|
| [47] |
|
| [48] |
|
| [49] |
|
| [50] |
|
| [51] |
|
| [52] |
|
| [53] |
|
| [54] |
|
| [55] |
|
| [56] |
|
| [57] |
|
| [58] |
|
| [59] |
|
/
| 〈 |
|
〉 |