Full Length Article

Quantifying desertification control efficiency in a hyper-arid region: Spatiotemporal dynamics and policy synergies in Hotan Prefecture of China during 2005-2023

  • SUN Lingxiao a ,
  • LI Chunlan , a, * ,
  • YU Yang a ,
  • HE Jing a ,
  • YANG Meilin a ,
  • WANG Qian a ,
  • LIANG Xueqiong a ,
  • Ireneusz MALIK b ,
  • Małgorzata WISTUBA b
Expand
  • aState Key Laboratory of Ecological Safety and Sustainable Development in Arid Lands, Xinjiang Institute of Ecology and Geography, Chinese Academy of Sciences, Urumqi, 830011, China
  • bPolish-Chinese Centre for Environmental Research, Institute of Earth Sciences, University of Silesia in Katowice, Katowice, 40-007, Poland
* E-mail address: (LI Chunlan).

Received date: 2025-07-01

  Revised date: 2025-10-12

  Accepted date: 2025-11-13

  Online published: 2026-03-11

Abstract

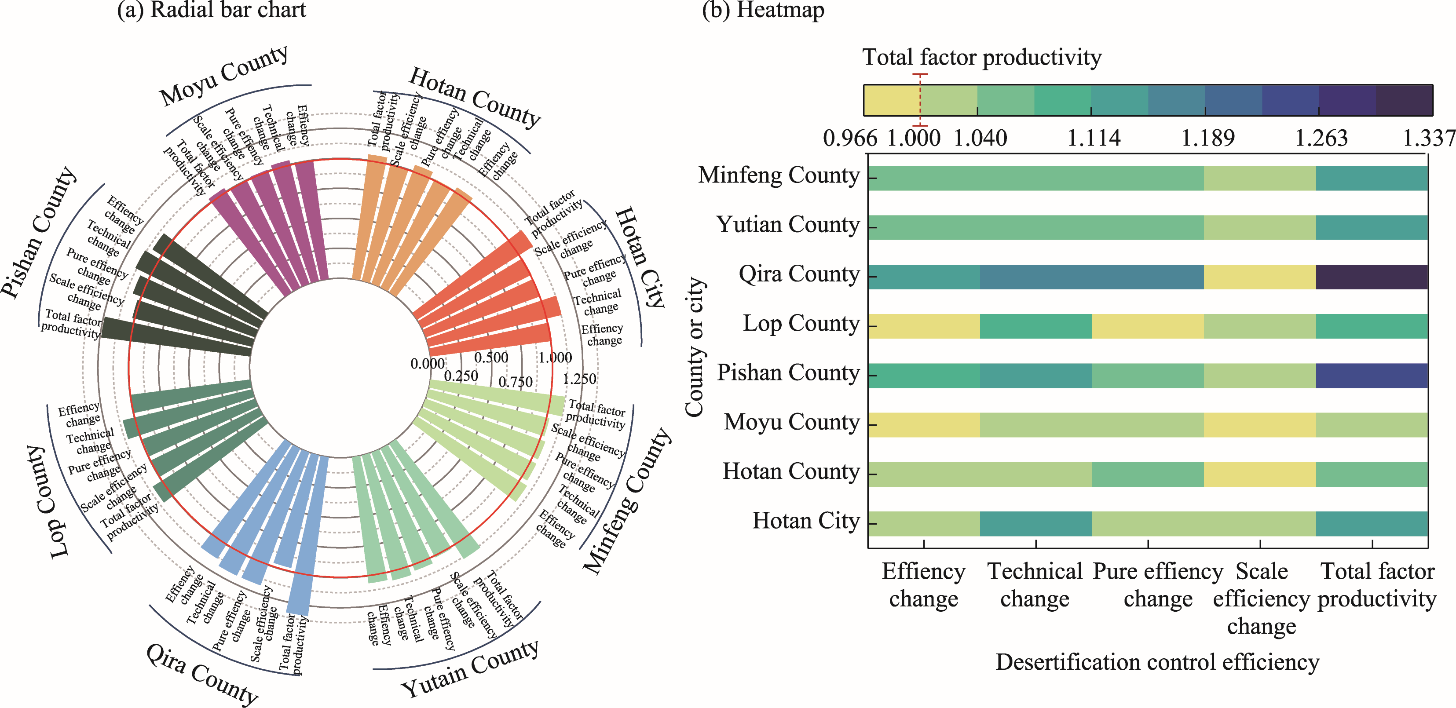
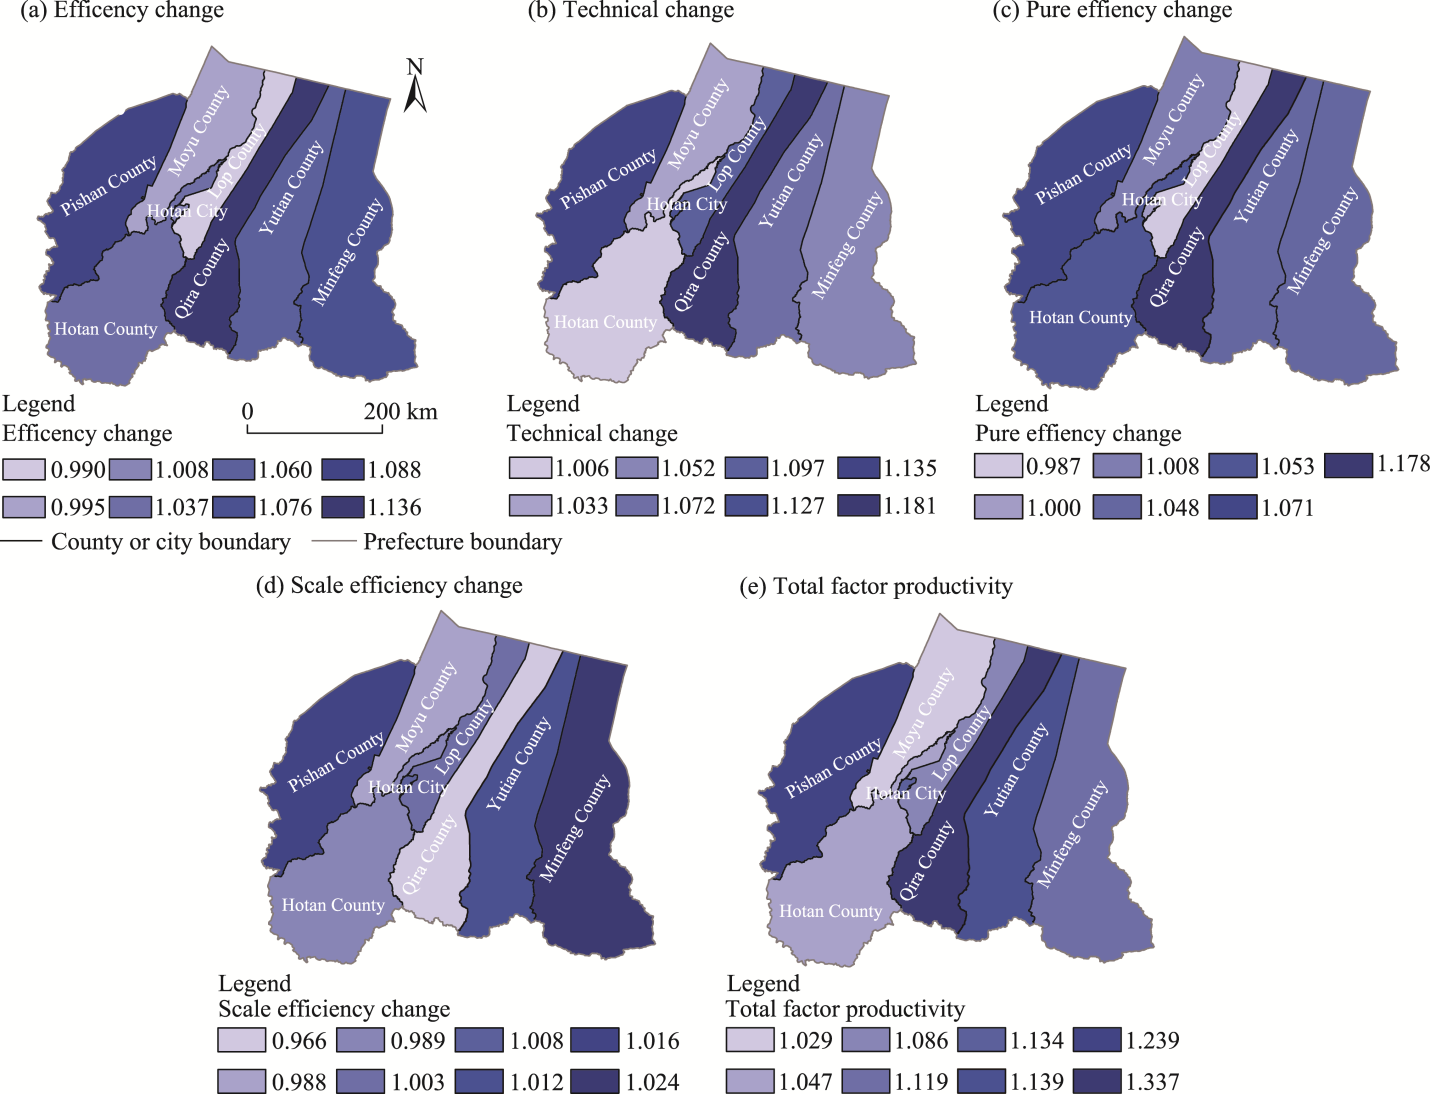
Desertification poses severe threats to socio-ecological resilience in arid regions, yet systematic quantification of desertification control efficiency remains limited. This study addressed this gap by developing an integrated Data Envelopment Analysis (DEA) Malmquist index to assess the spatiotemporal dynamics of desertification control efficiency in Hotan Prefecture (a hyper-arid region) of China from 2005 to 2023. To achieve this goal, we analyzed 5 indices spanning the total factor productivity, technical change, efficiency change, pure efficiency change, and scale efficiency change across 7 counties and 1 city in Hotan Prefecture. Results revealed that the growth rate of the total factor productivity is 12.0%, which is driven primarily by technical change and management optimization. However, significant spatiotemporal heterogeneity emerged. Temporally, rapid early gains during 2005-2010, with the total factor productivity value of 1.372, were dominated by technological progress, where technical change reached 1.291, while scale efficiency change helped sustain progress between 2010 and 2015. A recent decline in the total factor productivity to 0.987 during 2015-2023 underscored the risks associated with technological stagnation. Spatially, Qira County achieved the highest growth rate of the total factor productivity at 33.7% through dual advances in technology and management, which stands in sharp contrast to Moyu County’s stagnation, where the total factor productivity reached only 1.029, reflecting the minimal growth rate of 2.9%. Furthermore, scale expansion change proved beneficial in Pishan County but counterproductive in Qira County. Based on these findings, this study proposes targeted policy recommendations to enhance desertification control efficiency in hyper-arid regions like Hotan Prefecture. It emphasizes the importance of continuous technological innovation, particularly water-saving and adaptive techniques to counteract declining productivity. Differentiated spatial strategies are essential, with tailored interventions for high-risk northern areas and scaling successful models from higher-efficiency southern zones. Optimizing project scale based on ecological carrying capacity rather than uncontrolled expansion is urged, along with strengthening cross-regional water resource coordination. Finally, establishing a data-driven monitoring and decision-support system could enable dynamic efficiency evaluations and evidence-based policy planning. This study provides a critical methodological framework for systematically quantifying desertification control efficiency in hyper-arid regions, establishing an empirical foundation for targeted ecological governance.

Cite this article

SUN Lingxiao , LI Chunlan , YU Yang , HE Jing , YANG Meilin , WANG Qian , LIANG Xueqiong , Ireneusz MALIK , Małgorzata WISTUBA . Quantifying desertification control efficiency in a hyper-arid region: Spatiotemporal dynamics and policy synergies in Hotan Prefecture of China during 2005-2023[J]. Regional Sustainability, 2025 , 6(6) : 100275 . DOI: 10.1016/j.regsus.2025.100275

1. Introduction

Desertification represents a critical ecological crisis acknowledged globally by the international community. It constitutes a systematic process of land degradation driven by the complex interplay of natural climate change and human socio-economic activities (Kassas, 1995; Verón et al., 2006). This pervasive phenomenon now impacts a substantial proportion of the Earth’s terrestrial surface, posing continuous and severe threats to ecological security, particularly within the world’s arid, semi-arid, and dry sub-humid regions (Houérou, 1996; Becerril-Piña and Mastachi-Loza, 2021). These zones are characterized by inherent environmental sensitivity. Within them, a detrimental negative feedback loop often develops between the naturally fragile baseline conditions of the ecosystem and intensive human exploitation of land and water resources (Reynolds et al., 2007; D’Odorico et al., 2013). The consequences of this interaction are multifaceted and profound. On a fundamental level, it leads to the persistent diminishment of arable land resources and a marked decline in the productivity of rangelands and pastures. This directly translates into significant economic losses through reduced agricultural and livestock outputs, undermining livelihoods and food security (Tang et al., 2016; Haj-Amor et al., 2022; Feng et al., 2024; Lan et al., 2024).
Beyond these immediate economic impacts, desertification triggers deeper ecological disruptions at the regional scale. It frequently results in a noticeable simplification of biological community structures, meaning a loss of biodiversity and shifts towards less complex ecosystems dominated by fewer, often more resilient species (Whitford, 1997; Bestelmeyer, 2005). Crucially, this degradation weakens key ecological functions, which are essential for environmental stability. One of the most concerning consequences is the ongoing attenuation of the carbon sequestration capacity within terrestrial ecosystems (Lal et al., 2018; Zheng et al., 2024). As vegetation cover decreases and soil organic matter depletes, the land’s ability to absorb and store atmospheric carbon dioxide diminishes. A reduction in carbon storage not only contributes to the global challenge of climate change, but also fundamentally undermines the resilience and integrity of regional ecological security patterns, creating systemic risks that extend far beyond the degraded areas themselves (Lal, 2002; Wang et al., 2022a). Within China, the challenge of land degradation exhibits pronounced spatial heterogeneity. Arid and semi-arid areas of China, covering vast expanses particularly in the northern and northwestern regions, bear the brunt of desertification processes. Quantifying this impact, authoritative national monitoring data indicated that by 2019, the total area classified as desertified land reached 2.57×10⁶ km2 (Tang et al., 2016; Wang et al., 2022b; Yu et al., 2022; Ren et al., 2024). Concurrently, the extent specifically identified as sandy land (where sand is the dominant surface material) amounted to 1.69×10⁶ km2. Against the backdrop of increasing global drought and limited resources for desertification control, efforts to combat desertification in hyper-arid regions are confronted with serious challenges (Abuzaid et al., 2021; Huang and Zhai, 2023). This is particularly true in ecologically vulnerable areas like Hotan Prefecture in China, where water resources are extremely scarce. Here, the central challenge lies in how to utilize limited human, material, and financial resources with the maximum efficiency to optimize ecological benefits. Simply increasing investment is not a sustainable solution. Instead, the priority must be to enhance the efficiency of resource allocation and management, that is, to employ scientific methods to identify pathways that achieve the greatest control effect at the lowest cost. Such an approach can help optimize policy instruments, adjust project planning, and improve technical models, thereby providing a scientific basis for the long-term sustainability of ecological restoration in arid regions.
The international academic community has systematically recognized technical pathways for desertification control, which primarily involve 4 categories of interventions. Engineering stabilization methods, such as straw checkerboard barriers, effectively reduce surface wind erosion in the short term. Chemical sand-fixing agents utilizing polymer materials enhance the aggregation structure of sandy soils. Agricultural management practices, including water-saving irrigation and rotational fallowing, contribute to mitigating soil degradation. Biological restoration approaches, exemplified by natural vegetation enclosure and shelterbelt construction, have demonstrated long-term ecological benefits. However, evaluating the efficiency of implemented desertification control measures remains a critical task. Current research employs interdisciplinary approaches, integrating remote sensing and geographic information system spatial analysis (Saiko and Zonn, 2000; Guo et al., 2017; Liu et al., 2018; Silva et al., 2023), ecological modeling simulations (Wang et al., 2022c), carbon cycle models such as Carnegie-Ames-Stanford Approach (Xu et al., 2014; Zhou et al., 2015), and field monitoring (Hu et al., 2017; Khashtabeh et al., 2021; Grilli et al., 2021; Fan et al., 2023; Niu et al., 2025). Socio-economic evaluations, incorporating Cost-Benefit Analysis (CBA) and household surveys, complement technical assessments (Zhao et al., 2009; Feng et al., 2013). Furthermore, comprehensive index systems combining analytic hierarchy processes and entropy weighting methods enable multidimensional evaluation (Santini et al., 2010; Wang et al., 2015; Sanzheev et al., 2020). These integrated methodologies, synthesizing spatial data, model simulations, field validation, and socio-economic factors, establish a robust framework for scientifically evaluating desertification control efficiency.
In evaluating the efficiency of ecological governance projects, researchers commonly employ a variety of methodologies, including CBA (Li et al., 2022b), Ecological Footprint Method (Matustik and Koci, 2021), and Life Cycle Assessment (Rigamonti and Mancini, 2021). While CBA can quantify costs and benefits in monetary terms for marketed goods and services, it often fails to accurately capture the value of non-market ecological services—such as carbon sequestration, oxygen release, and windbreak and sand fixation—generated by desertification control efforts (Feuillette et al., 2016; Lin et al., 2023). This limitation may result in partial or biased evaluations. The Ecological Footprint Method, focusing on the balance between ecological capacity and consumption demand, does not directly reflect management efficiency or resource allocation effectiveness (Hoekstra, 2017; Zhang et al., 2025). Although Life Cycle Assessment provides a comprehensive analysis of environmental impacts, its complex procedures and high data requirements hinder its application in long-term, multi-dimensional dynamic efficiency assessment (Li et al., 2024a). Despite these advanced methodologies, significant research gaps persist. There is a disconnection between the technical quantification of ecological improvements and their comprehensive economic valuation within an efficiency analysis framework.
Given these limitations, there is a pressing need for an evaluation method that can integrate multiple inputs and outputs without requiring assumptions about the production function. The Data Envelopment Analysis (DEA) emerges as a suitable alternative due to its non-parametric nature and flexibility in handling complex systems. The DEA is a non-parametric frontier efficiency evaluation method, offering distinct advantages in handling multi-input and multi-output problems, making it particularly suitable for assessing complex systems. One major strength of the DEA is that it does not require assumptions regarding the functional form of the production process, thereby avoiding model misspecification (Shu et al., 2024; Sun et al., 2025). Furthermore, it can integrate multiple inputs (e.g., capital, labor, and policy support) and multiple outputs (e.g., increased vegetation coverage, reduced desertification area, and enhanced ecological service value) to compute relative efficiency scores of decision-making units against a best-practice frontier, rather than absolute values (Li et al., 2024b; Lozano and Borrego-Marín, 2024). This feature makes the DEA highly appropriate for evaluating management performance under multiple objectives.
In recent years, the DEA and its extended models, such as the Malmquist index, have been increasingly applied in the fields of ecological efficiency, environmental governance, and sustainability assessment, demonstrating both practicality and scientific rigor. Accordingly, this study adopted the DEA Malmquist index to provide a more comprehensive and scientifically grounded analysis of the spatiotemporal dynamics of desertification control efficiency in Hotan Prefecture, a representative hyper-arid region.
By analyzing 5 key indicators from Hotan Prefecture during 2005-2023, including the total factor productivity, technical change, efficiency change, pure efficiency change, and scale efficiency change, this study deconstructed the spatiotemporal variations of desertification control and the total factor productivity through 2 dimensions: technical efficiency change and technological progress. Notably, the primary innovation of this study lies in its integration of an ecological service value assessment system with the DEA Malmquist index, along with the development of a tailored input-output indicator framework designed to evaluate desertification control efficiency. In terms of the research subjects, this study focused on a typical area of extreme aridity in China, i.e., Hotan Prefecture. This study provides a detailed case for evaluating the efficiency of ecological governance under high stress natural conditions, which holds significant reference value for similar environmental regions. The findings not only quantify marginal benefit trends in Hotan’s desertification control over a long term, but also identify inefficiencies through projection analysis, offering decision-making insights for optimizing social-ecological resilience in arid zones. This research can provide dual implications for coordinating human-land relationships in drylands and advancing the United Nation Sustainable Development Goal (SDG) 15.3 on land degradation neutrality.

2. Materials and methods

2.1. Study area

Hotan Prefecture, situated within the hyper-arid core of the Tarim Basin in Xinjiang Uygur Autonomous Region, China, serves as a starkly representative case study of the natural conditions predisposing areas to severe desertification. This region endures an extreme lack of moisture, evidenced by an exceptionally low mean annual precipitation consistently recorded at less than 35 mm. Surface cover is overwhelmingly dominated by sandy land; and national land survey results confirm that sandy land constitutes approximately 52.8% of the total land area in Hotan Prefecture, equating to approximately 0.13×10⁶ km2 (Wei et al., 2021; Cao et al., 2024). These data provide an objective baseline reflecting the intensity of land degradation through the specific metrics of desertified and sandy land extent during 2005-2023.
Vitally, the trajectory of land cover change in regions like Hotan Prefecture is not solely determined by harsh natural conditions. The accelerating pace of urbanization, a trend clearly reflected in the staged rate statistics from China’s latest national population census, introduces powerful anthropogenic forces. This urbanization, coupled with sustained population growth and the expansion of agricultural reclamation activities into marginal lands, exerts immense pressure on the fragile landscape (Li et al., 2012; Liu et al., 2024). Consequently, observable changes in land cover dynamics increasingly bear the distinct signature of human disturbance. The powerful convergence of this extreme natural aridity with the escalating demands of socio-economic development creates a potent and often destructive synergy. This unique combination of intense environmental stress and human pressure makes Hotan Prefecture an exceptionally valuable and critical empirical research zone. It offers unparalleled opportunities to investigate, understand, and quantify the intricate feedback mechanisms operating between diverse human activities and the complex physical and biological processes driving desertification. Understanding these dynamics is paramount for developing effective mitigation and adaptation strategies, both locally and for similar vulnerable ecosystems worldwide (Figs. 1 and 2).
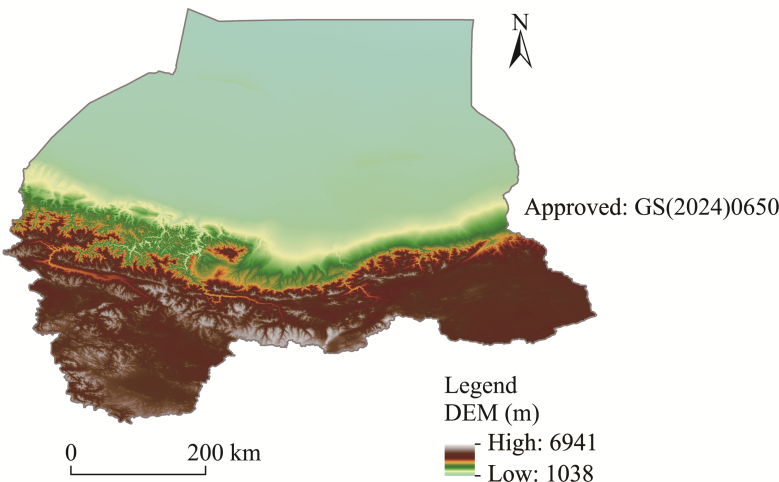
Fig. 1. Overview of the study area based on digital elevation model (DEM). Note that the figure is based on the standard map (GS(2024)0650) of the Map Service System (http://bzdt.ch.mnr.gov.cn/download.html) marked by the Ministry of Natural Resources of the People’s Republic of China, and the boundary of the standard map has not been modified.
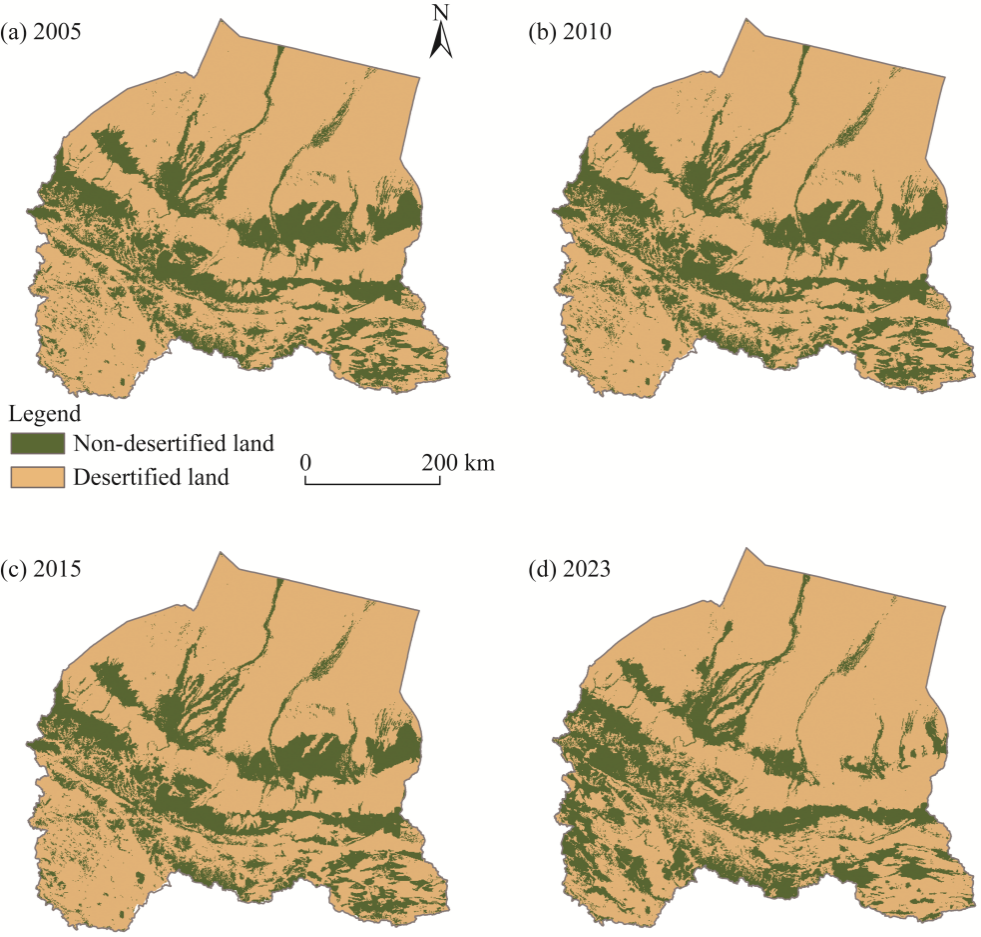
Fig. 2. Spatial changes of desertification in Hotan Prefecture in 2005 (a), 2010 (b), 2015 (c), and 2023 (d).

2.2. Data Envelopment Analysis (DEA) Malmquist index

The DEA Malmquist index, initially proposed by mathematician Malmquist in 1953 (Malmquist, 1953) as an efficiency measurement tool, was later refined by Fare et al. (1989) to evaluate the total factor productivity across different time periods (Chen and Ali, 2004; Firsova and Chernyshova, 2020). This enhanced index objectively quantifies the dynamic relationships among pure efficiency change, scale efficiency change, and technological change (Kong et al., 2021; Cheng et al., 2022). In recent years, the DEA Malmquist index has been widely adopted across industries for productivity analysis and operational efficiency assessment. The fundamental principle of the output-oriented DEA Malmquist index is outlined below:
${M}_{o}({X}^{t},{Y}^{t},{X}^{s},{Y}^{s})={({M}_{o}^{t}\times {M}_{o}^{s})}^{\frac{1}{2}}={\left[\frac{{D}_{o}^{t}\left({X}^{s},{Y}^{s}\right)}{{D}_{o}^{t}\left({X}^{t},{Y}^{t}\right)}\times \frac{{D}_{o}^{s}\left({X}^{s},{Y}^{s}\right)}{{D}_{o}^{s}\left({X}^{t},{Y}^{t}\right)}\right]}^{\frac{1}{2}}$
where M stands for the DEA Malmquist index; o explicitly denotes that the model is output-oriented; t and s represent 2 distinct time periods, which may be consecutive or non-consecutive; D represents the distance function, which is the fundamental building block of the DEA and measures the efficiency of the Decision Making Units (DMUs); Xt and Yt denote the input and output vectors for period t, respectively; Xs and Ys denote the input and output vectors for period s, respectively; Dt o(Xt,Yt) and Ds o(Xs,Ys) represent the single-period output distance functions for periods t and s, respectively; and Dt o(Xs,Ys) and Ds o(Xt,Yt) denote the cross-period output distance functions for periods t and s, respectively. Although Equation 1 forms the theoretical basis of the DEA Malmquist index, its practical application requires decomposition under varying returns to scale assumptions, as follows:
Constant Returns to Scale (CRS): under the CRS assumption, the DEA Malmquist index is decomposed into the product of efficiency change and technical change, transforming Equation 1 into:
${M}_{o}\left({X}^{t},{Y}^{t},{X}^{s},{Y}^{s}\right)=\frac{{D}_{o}^{s}\left({X}^{s},{Y}^{s}\right)}{{D}_{o}^{t}\left({X}^{t},{Y}^{t}\right)}\times {\left[\frac{{D}_{o}^{t}\left({X}^{s},{Y}^{s}\right)}{{D}_{o}^{s}\left({X}^{s},{Y}^{s}\right)}\times \frac{{D}_{o}^{t}\left({X}^{t},{Y}^{t}\right)}{{D}_{o}^{s}\left({X}^{t},{Y}^{t}\right)}\right]}^{\frac{1}{2}}$
Variable Returns to Scale (VRS): under the VRS assumption, efficiency change is further divided into pure efficiency change and scale efficiency change, modifying Equation 2 to:
${M}_{o}\left({X}^{t},{Y}^{t},{X}^{s},{Y}^{s}\right)=\frac{{D}_{o}^{s}\left(\left.{X}^{s},{Y}^{s}\right|\text{VRS}\right)}{{D}_{o}^{t}\left(\left.{X}^{t},{Y}^{t}\right|\text{VRS}\right)}\times \left[\frac{{D}_{o}^{s}\left(\left.{X}^{s},{Y}^{s}\right|\text{CRS}\right)}{{D}_{o}^{s}\left(\left.{X}^{s},{Y}^{s}\right|\text{VRS}\right)}\times \frac{{D}_{o}^{t}\left(\left.{X}^{t},{Y}^{t}\right|\text{VRS}\right)}{{D}_{o}^{t}\left(\left.{X}^{t},{Y}^{t}\right|\text{CRS}\right)}\right]\times {\left[\frac{{D}_{o}^{t}\left({X}^{s},{Y}^{s}\right)}{{D}_{o}^{s}\left({X}^{s},{Y}^{s}\right)}\times \frac{{D}_{o}^{t}\left({X}^{t},{Y}^{t}\right)}{{D}_{o}^{s}\left({X}^{t},{Y}^{t}\right)}\right]}^{\frac{1}{2}}$
In summary, the DEA Malmquist index can be expressed as follows:
$\begin{array}{l}\text{Total factor productivity}=\text{efficiency change}\times \text{technical change}=\\ \text{pure efficiency change}\times \text{scale efficiency change}\times \text{technical change}\end{array}$
Based on the principles of the DEA Malmquist index, this method measures productivity across different sectors and evaluates the efficiency of various tasks. Therefore, with appropriate indicators selected, the DEA Malmquist index is suitable for assessing desertification control efficiency. The index components are interpreted detailedly.
The total factor productivity reflects the overall desertification control efficiency for each region. Total factor productivity value>1.000 indicates improved desertification control efficiency over the period, while the total factor productivity<1.000 signifies a decline in desertification control efficiency.
Technical change measure shifts in the technological production frontier for desertification control over time. Technical change value>1.000 indicates technological progress during the period, whereas a technical change value<1.000 suggests technological regression.
Efficiency change represents a change in technical efficiency of desertification control practices over time. Efficiency change value>1.000 signifies enhanced relative efficiency, while efficiency change value<1.000 indicates reduced relative efficiency.
Pure efficiency change assesses the impact of management practices on desertification control efficiency. Pure efficiency change value>1.000 indicates that management improvements contributed to efficiency gains. Conversely, pure efficiency change value<1.000 suggests that management shortcomings led to efficiency losses.
Scale efficiency change reflects the discrepancy between the desertification control efficiency of a decision-making unit and the theoretically optimal scale efficiency. Scale efficiency change value>1.000 implies that the unit’s efforts have consistently moved towards optimal efficiency over the long term. Scale efficiency change value<1.000 indicates that its efforts deviated from optimal efficiency during the study period.

2.3. Selection of evaluation variables for desertification control efficiency in Hotan Prefecture

Applying the DEA Malmquist index to assess desertification control efficiency requires selecting variables based on the principles of objectivity, representativeness, and feasibility. These indicators must also reflect the specific characteristics of Hotan Prefecture and its desertification context. The indicator system is constructed as follows: (1) inputs—factors positively correlated with desertification intensity, meaning factors that potentially exacerbate desertification; and (2) outputs—factors negatively correlated with desertification intensity, meaning factors that mitigate the worsening of desertification. This framework establishes the indicator system for evaluating desertification control efficiency in Hotan Prefecture, as detailed in Table 1.
Table 1 Indicator system for evaluating desertification control efficiency.
Data Envelopment
Analysis (DEA) Malmquist index item
Variable Unit Relationship with desertification control efficiency
Inputs Population persons Positive
Chemical fertilizer application t Positive
Soil erosion area hm2 Positive
Desertified land area hm2 Positive
Outputs Afforestation area on barren mountains/sandy land hm2 Negative
Year-end closed-off mountain/sandy land forestation area hm2 Negative
Forest and grassland area hm2 Negative
Vegetation coverage % Negative
The evaluation indicator system comprises 4 input items and 4 output items. For inputs, population was selected because increased population leads to intensified human activities and greater demand for resources such as food and timber, exacerbating land exploitation and environmental degradation. Chemical fertilizer application assesses potential soil contamination risks; and excessive use of chemical fertilizer disrupts soil nutrient balance, deteriorates physical properties, and reduces fertility, thereby accelerating land degradation. Soil erosion area represents a key driver of desertification in arid regions, primarily through wind erosion (the dominant factor), water erosion, and freeze-thaw erosion. Desertified land area serves as a direct measure of desertification severity in Hotan Prefecture, which can be quantified using remote sensing data on land-use changes across years.
Among outputs, afforestation area on barren mountains/sandy land and year-end closed-off mountain/sandy land forestation area reflect effective ecological conservation measures and critical indicators of desertification control efficiency. Similarly, forest and grassland area and vegetation coverage positively correlate with control efficiency. Enhanced vegetation coverage significantly reduces surface sand mobility, particularly through recent protection and restoration of oasis-desert transition zones, where expanded forest and grassland area demonstrates tangible mitigation outcomes.
To comply with the fundamental rule of thumb in the DEA modeling that the total number of input and output variables should not exceed half the number of DMUs to ensure discriminant power, this study employed 95 township-level administrative regions within Hotan Prefecture as the DMUs. This approach effectively avoids the issue of an excessive proportion of units being evaluated as efficient due to an insufficient sample size. Following the efficiency calculation at the township level, the results will be aggregated to the county or city level by calculating the mean values for each county or city. This aggregation is conducted to facilitate a clearer and more concise discussion of the spatiotemporal patterns and trends observed at a broader administrative scale, thereby enhancing the interpretability of the findings without compromising the statistical rigor of the initial model.

2.4. Data sources

Population, chemical fertilizer application, afforestation area on barren mountains/sandy land, and year-end closed-off mountain/sandy land forestation area were obtained from the Hotan Prefecture Statistical Yearbook (HTBS, 2006, 2011, 2016, 2024). Soil erosion area originates from the “Spatial Distribution Data of Soil Erosion in China”, which is compiled by the Resource and Environmental Science Data Platform (https://www.resdc.cn/data.aspx?DATAID=259). Desertified land and forest and grassland areas were derived through analysis of the “Remote Sensing Monitoring Data of Current Land Use Status” (Xu et al., 2018). Vegetation coverage rate was calculated using the “Spatial Distribution Dataset of 1 km Normalized Difference Vegetation Index (NDVI) During Growing Season in China” (Xu, 2018). The data range of 8 variables covered years of 2005, 2010, 2015, and 2023.

3. Results

3.1. Time series changes of desertification control efficiency in Hotan Prefecture

Utilizing the DEA Malmquist index to analyze input-output indicators for desertification control efficiency in Hotan Prefecture, this study showed the dynamic evolution of the total factor productivity and its decomposition components from 2005 to 2023 (Table 2). These results clearly revealed fluctuations in desertification control efficiency across distinct periods and their underlying driving factors.
Table 2 Desertification control efficiency in Hotan Prefecture from 2005 to 2023.
Period Efficiency change Technical change Pure efficiency change Scale efficiency change Total factor productivity
2005-2010 1.063 1.291 1.079 0.985 1.372
2010-2015 1.027 1.010 0.986 1.042 1.037
2015-2023 1.030 0.958 1.057 0.974 0.987
2005-2023 1.040 1.077 1.040 1.000 1.120
As presented in Table 2, this study witnessed the most rapid improvement in desertification control efficiency within Hotan Prefecture during 2005-2010. The total factor productivity reached 1.372, with the growth rate of 37.2%. Analysis of the drivers showed that technical change (1.291) played the decisive role, with the growth rate of 29.1%. This significant advancement suggested breakthroughs in the application, innovation, or adoption of desertification control technologies. Concurrently, efficiency change (1.063) also improved, with the growth rate of 6.3%, reflecting enhanced overall resource allocation and management efficiency. Further decomposition of efficiency change revealed that pure efficiency change (1.079) increases markedly, with the growth rate of 7.9%, signifying improvements in management decision-making, organizational coordination, and operational execution. However, scale efficiency change (0.985) emerged as a relative constraint, with the decline rate of 1.5%. Despite notable progress in management and technology, the scale or coverage of control projects may not have reached optimal levels, suggesting potential diseconomies of scale. This finding underscores the need for more strategic planning and effective expansion of control efforts.
The period 2010-2015 saw a moderation in efficiency growth compared to the previous 5 a (2005-2010), yet the total factor productivity showed a positive development increase (1.037), with the growth rate of 3.7%. Technical change (1.010) was marginal, with the growth rate of 1.0%, showing a significant reduction in contribution. The primary driver of efficiency gains shifted to improvements in efficiency change (1.027), with the growth rate of 2.7%. Notably, the internal components of the efficiency change diverged. Pure efficiency change (0.986) showed a slight decline, with the decline rate of 1.4%, indicating minor setbacks or bottlenecks in micro-level management and operational efficiency. This was effectively counterbalanced by a strong performance in scale efficiency change (1.042), with the growth rate of 4.2%. The substantial scale efficiency gain demonstrates a successful expansion in the coverage and scale of control projects during this period, making scale effects a crucial factor sustaining efficiency growth.
Between 2015 and 2023, desertification control efficiency in Hotan Prefecture experienced a slight decline for the first time. The total factor productivity was 0.987, with the decline rate of 1.3%. This setback was primarily attributable to a significant decrease in technical change (0.958), with the decline rate of 4.2%. This suggested that existing technological advantages may not have been adequately sustained or updated, or that the adoption of new technologies encountered obstacles, hindering efficiency gains. In stark contrast, pure efficiency change (1.057) achieved its highest growth rate within the period, with the growth rate of 5.7%, demonstrating substantial improvements in management refinement, process optimization, and institutional strengthening. However, scale efficiency change declined again (0.974), with the decline rate of 2.6%, indicating that the scale or scope of control efforts may have contracted, or its expansion was suboptimal, failing to realize potential scale benefits. Consequently, the lack of technological progress led to an overall efficiency decrease despite management gains.
During 2005-2023, desertification control efficiency in Hotan Prefecture showed a positive upward trend. The cumulative total factor productivity reached 1.120, reflecting a significant overall efficiency gain (12.0%). This long-term progress was jointly driven by technical change (1.077 with the growth rate of 7.7%) and efficiency change (1.040 with the growth rate of 4.0%), signifying sustained technological improvement and optimization. A growth in efficiency change stemmed primarily from a stable increase in pure efficiency change (1.040), with the growth rate of 4.0%, highlighting the foundational role of enhanced management capacity. A noteworthy finding is that the long-term scale efficiency change was exactly 1.000. This equilibrium indicates that the scale of control efforts neither significantly boosted nor persistently impeded the overall efficiency growth. In summary, management and technology stand as the 2 key drivers underpinning the substantive progress in desertification control efficiency of Hotan Prefecture during 2005-2023.

3.2. Comparison of desertification control efficiency in each county or city of Hotan Prefecture

Analysis using the DEA Malmquist index on county- or city-level panel data (2005-2023) revealed that desertification control efficiency, measured by the total factor productivity, increased in 7 counties and 1 city of Hotan Prefecture (the total factor productivity>1.000). However, significant regional disparities existed in the extent of improvement (Fig. 3).
Fig. 3. Comparison of the total factor productivity by radial bar chart (a) and heatmap (b) in each county or city of Hotan Prefecture. The red circle in Figure 3a represents the value of 1.000.
Growth rates followed a distinct three-tier pattern: Qira County (the total factor productivity=1.337 and the growth rate=33.7%) and Pishan County (the total factor productivity=1.239 and the growth rate=23.9%) formed a high-growth cluster, substantially exceeding the average increase rate of 12.0% in Hotan Prefecture. Yutian County (the total factor productivity=1.139 and the growth rate of 13.9%), Hotan City (the total factor productivity=1.134 and the growth rate=13.4%), and Minfeng County (the total factor productivity=1.119 and the growth rate=11.9%) comprised a moderate-growth tier. Conversely, growth was comparatively slow in Lop County (the total factor productivity=1.086 and the growth rate of 8.6%), Hotan County (the total factor productivity=1.047 and the growth rate=4.7%), and Moyu County (the total factor productivity=1.029 and the growth rate=2.9%), with the increase rates below 10.0%.
Technical change was the primary driver of desertification control efficiency differences in Hotan Prefecture. Specifically, Qira County (technical change=1.181 and the growth rate of 18.1%), Pishan County (technical change=1.135 and the growth rate=13.5%), and Hotan City (technical change=1.127 and the growth rate=12.7%) led efficiency gains through substantial technological upgrades, where technology contributed over 50.0% to their total factor productivity growth. In contrast, Hotan County (technical change=1.006 and the growth rate=0.6%) showed negligible technological advancement, and Moyu County (technical change=1.033 and the growth rate of 3.3%) lagged behind the regional average (7.7%), indicating significant deficiencies in technology application. Pure efficiency change also exhibited pronounced spatial variation. While management (pure efficiency change) improved in all counties except Lop County (pure efficiency change=0.987 and the decline rate of 1.3%), progress was particularly notable in Qira County (pure efficiency change=1.178 and the growth rate=17.8%), Pishan County (pure efficiency change=1.071 and the growth rate=7.1%), and Hotan County (pure efficiency change=1.053 and the growth rate=5.3%). Management improvements in Qira County alone accounted for 53.0% of the total factor productivity gain in Hotan Prefecture.
Scale efficiency change diverged in Hotan Prefecture. Specifically, Minfeng County (scale efficiency change=1.024 and the growth rate=2.4%) and Pishan County (scale efficiency change=1.016 and the growth rate=1.6%) achieved positive effects through scale expansion. Conversely, Qira County (scale efficiency change=0.966 and the decline rate=3.4%), Moyu County (scale efficiency change=0.988 and the decline rate=1.2%), and Hotan County (scale efficiency change=0.989 and the decline rate=1.1%) experienced scale contraction. Crucially, scale changes did not dictate the overall efficiency outcomes. Despite the largest decline rate of scale efficiency change (3.4%), Qira County achieved the highest growth rate of the total factor productivity (33.7%) through strong improvements in both technology (the growth rate of technical change at 18.1%) and management (the growth rate of pure efficiency change at 17.8%). In contrast, Moyu County’s smaller reduction rate of scale efficiency change (1.2%) resulted in the minimal growth rate of the total factor productivity (2.9%) due to limited progress in technology (the growth rate of technical change was 3.3%) and management (the growth rate of pure efficiency change was 0.8%). This demonstrates that technological innovation and management optimization are the core drivers of effective desertification control. Scale expansion requires adequate technological and managerial capacity as prerequisites, and indiscriminate scaling risks may lead to the loss of scale benefits.

3.3. Spatial variations in desertification control efficiency in each county or city of Hotan Prefecture

Figure 4a reveals a north-south divergence in desertification control efficiency. Northern high-latitude counties of Hotan Prefecture including Moyu County (0.995) and Lop County (0.990) showed a decline in desertification control efficiency, while Qira County (1.136), Yutian County (1.060), and Minfeng County (1.076) formed an efficient corridor. Hotan County (1.037) in the southern low-latitude zone of Hotan Prefecture emerged as an isolated high-efficiency point.
Fig. 4. Spatial variations of efficiency change (a), technical change (b), pure efficiency change (c), scale efficiency change (d), and total factor productivity (e) in each county or city of Hotan Prefecture.
Technical change exhibited a distinct eastward gradient (Fig. 4b). Pishan County (1.135) and Hotan City (1.127) constituted secondary technological highlands. Values gradually decreased eastward through Yutian County (1.072) and Minfeng County (1.052), peaking at Qira County (1.181). This forms a twin-peak pattern with Pishan County and Qira County as dual technological frontiers, while Hotan County (1.006) became a pronounced technological depression.
Pure efficiency change demonstrated higher values in the east Hotan Prefecture and moderate levels in the west (Fig. 4c). Qira County (1.178) formed a prominent peak, surrounded by secondary high zones including Yutian County (1.048) and Minfeng County (1.048). Western and central counties clustered near the baseline (1.000), with only Lop County (0.987) showing minor decline.
Scale efficiency change was higher in the western region of Hotan Prefecture and lower in the eastern region (Fig. 4d). Pishan County (1.016) and Qira County (0.966) represented opposing poles of scale expansion and contraction. Notably, Qira County, the highest total factor productivity performer, exhibited a decline in scale efficiency change (0.966). Spatially, the high-technology county (Qira County) contrasted sharply with the low-efficiency county (Moyu County). Hotan City showed technology-driven characteristics, with the high technical change of 1.127 but marginal efficiency change of 1.008.
The total factor productivity showed marked regional disparities (Fig. 4e). Pishan County (1.239) and Qira County (1.337) formed distinct high-value cores, with Qira County exceeding the regional average by 36.0%. Central counties created a continuous low-value belt including Moyu County (1.029), Hotan County (1.047), and Lop County (1.086), Moyu County being the regional minimum. Hotan City (1.134) emerged as a relative high point within this central depression, though still below the eastern/western cores.

4. Discussion

4.1. Temporal evolution of desertification control efficiency

Results based on the DEA Malmquist index indicated that from 2005 to 2023, the total factor productivity of desertification control efficiency in Hotan Prefecture exhibits a distinct dynamic of initial increase followed by a decline. This fluctuation is closely linked to the combined effects of evolving control strategies, technological inputs, and changes in the external environment across different periods.
During 2005-2010, the total factor productivity showed significant growth, primarily driven by technical change. This phase coincided with the intensive implementation of several major national ecological projects in Hotan Prefecture, such as the Three-North Shelterbelt Forest Program and the Grain for Green Program (Suo and Cao, 2021; Zhai et al., 2023). The introduction of new technologies, materials, and management models significantly enhanced the output efficiency of control efforts. Although scale efficiency change experienced a slight decline, an improvement in pure efficiency change indicated the enhancement of capabilities in resource allocation and organizational implementation.
During 2010-2015, the growth rate of the total factor productivity slowed, with a notable reduction in the contribution of technical change. Efficiency gains during this stage were largely attributable to the increase of scale efficiency change, suggesting that efficiency maintenance relies more on the expansion of project coverage rather than technological innovation. This may signal the onset of diminishing marginal returns from the existing technological models.
Between 2015 and 2023, the total factor productivity experienced a slight decrease, mainly due to a decline in technical change. On one hand, this may reflect that the existing technological framework has entered a mature stage without sufficient innovation or adaptation to emerging environmental pressures, such as further water scarcity and pest outbreaks (Yang et al., 2021; Zhao, 2024). On the other hand, although pure efficiency change reached its highest level during the study period, indicating continued improvements in micro-level management, scale efficiency change declined again. This suggests a possible contraction in project implementation scale or a failure to achieve optimal economies of scale in later stages. Additionally, increased frequency of extreme climate events and growing population pressures may have further complicated ecological restoration efforts.
In summary, changes in the total factor productivity and its decompositions demonstrate that sustained technological innovation and adaptation are crucial for maintaining desertification control efficiency. Once technological progress stagnates, even improved management efficiency cannot fully offset the negative effect of technological lag. These findings underscore the need to emphasize technological innovation and iteration, particularly the development of water-saving and adaptive technologies under increasing water constraints, while consolidating managerial efficiency. Rational planning of project scale is also essential to avoid inefficiencies caused by imprudent expansion or contraction.

4.2. Spatial heterogeneity in desertification control efficiency and its determining factors

The spatial variation in desertification control efficiency across Hotan Prefecture is shaped by the interplay of natural geographical conditions and socio-economic factors. From a natural geography perspective, the northern counties of Hotan Prefecture, such as Moyu County and Lop County, are located close to the southern fringe of the Taklimakan Desert. These areas experience intense sandstorm activity and possess fragile ecological conditions, resulting in greater natural pressure and higher difficulty in combating desertification (Kelong et al., 2011; Abbas et al., 2021). These challenges likely contribute to the decline of efficiency change in Moyu County (0.995) and Lop County (0.990). In contrast, the lower-latitude southern areas benefit from the influence of the Kunlun Mountains, which bring relatively higher precipitation. The mountain ecosystems enhance water conservation, providing more stable ecological barriers and water supply to the oases (Wang et al., 2018; Lu et al., 2023). These conditions offer a more favorable natural environment for desertification control, helping explain why Hotan County emerges as a distinct high-efficiency cluster. Its location within the piedmont oasis zone provides superior combinations of water and soil resources.
In terms of socio-economic factors, population distribution and agricultural intensity also significantly affect desertification control efficiency. Although northern oases were established earlier and could support relatively dense populations, their agricultural practices, especially water-intensive irrigation, place high pressure on water resources (Guo et al., 2016). This likely competes with ecological water needs and constrains improvements in desertification control efficiency. By comparison, central and southern oases may possess advantages in agricultural structure, water-use efficiency, or the implementation of ecological policies. These regions may have invested more extensively in water-saving irrigation infrastructure or adopted more ecologically oriented industrial adjustments. Moreover, key ecological projects such as those targeting desertification control, afforestation, and grassland restoration, may vary spatially in policy coverage and implementation priority (Cai et al., 2024; Liu et al., 2024). Southern counties and city of Hotan Prefecture might have received earlier and more comprehensive benefits from intensive ecological management projects, yielding advantages in operational efficiency and economies of scale.
In summary, the north-south divergence in desertification control efficiency in Hotan Prefecture reflects the combined effects of harsh natural conditions and high anthropogenic pressure in the north, as opposed to more favorable natural settings and effective ecological policies and management strategies in the south.

4.3. Implications in regional and global contexts

This study establishes significant connections with existing studies of desertification control and expanded upon them through methodological innovation and contextualized empirical analysis. Methodologically, we advanced beyond traditional approaches that depend on single indicator (e.g., NDVI) (Mutti et al., 2019; Wang et al., 2021) or static evaluation models (such as entropy-weighted technique for order preference by similarity to an ideal solution) (Shakerian et al., 2017). Instead, we have integrated the DEA Malmquist index into a dynamic efficiency assessment framework, thereby achieving a more comprehensive evaluation. A key innovation is the incorporation of implicit ecological benefits such as windbreak and sand fixation services and carbon sequestration into productivity measurements, overcoming previous over-reliance on explicit outputs like restored land area (Mao et al., 2018; Araujo et al., 2024). This approach offers a more accurate quantification of the total factor productivity dynamics under multi-measure synergies. For example, our finding showed that technical change contributes more substantially than efficiency change during 2005-2010, which aligns with observations from technology-driven interventions in the eastern part of the Tarim Basin (Bai et al., 2021), while providing new evidence for optimizing resource allocation strategies.
At the regional level, the marked successes in Qira County and Pishan County demonstrated the effectiveness of a technology-and-management dual-driven model. This resonates with successful cases in the Sahara Desert that emphasize context-specific technology adoption with community participation (Haj-Amor et al., 2022). Conversely, our analysis newly identified an imbalance in Hotan City, where high technological advancement is coupled with limited managerial improvement, highlighting a need for more integrated policy approaches.
Placing these results in a broader global context and comparing them with the Aral Sea Basin (a well-documented case of ecological tragedy caused by desertification and water mismanagement) underscore the strategic relevance of our findings. While both regions are inland arid zones where water scarcity and agricultural irrigation are major drivers of degradation, their outcomes diverged fundamentally due to governance structures. The Aral Sea Basin suffers from transboundary conflicts and fragmented policies, leading to a tragedy of the common (Vinogradov and Langford, 2001; Zhiltsov et al., 2018), whereas Hotan Prefecture has benefited from China’s coordinated institutional approach, enabling integrated basin management and large-scale ecological programs like the Three-North Shelterbelt Forest Program (Li et al., 2022a). This contrast highlights the critical importance of adaptive governance and scientific planning in avoiding systemic ecological collapse.
The core contribution of this study lies in its pioneering quantification of dynamic productivity evolution in desertification control under integrated measures. By revealing the stage-specific dominance of technological and managerial factors and situating these within both regional and international contexts, we can establish a transferable diagnosis optimization framework aimed at enhancing social ecological resilience in arid zones worldwide.

4.4. Policy pathways

This study yields several concrete policy implications for enhancing desertification control efficiency in hyper-arid regions such as Hotan Prefecture, with potential relevance to other ecologically vulnerable areas globally.
First, technological iteration and adaptive innovation should be prioritized. The stagnation of technical change was identified as the primary cause of a recent decline in the total factor productivity, underscoring that the benefits of initial technological adoption diminish over time without continuous innovation. It is recommended to establish dedicated funding for developing and promoting water-saving and drought-resistant technologies, such as high-efficiency drip irrigation, novel bio-based sand-fixation materials, and stress-tolerant plant species, to address tightening water constraints. Furthermore, a systematic technology monitoring and evaluation mechanism should be introduced to regularly assess the effectiveness of existing interventions, phase out obsolete techniques, and facilitate the adoption of more adaptive solutions.
Second, differentiated spatial governance strategies should be implemented. The significant spatial divergence in efficiency, where the northern counties of Hotan Prefecture experienced declines while the southern counties of Hotan Prefecture formed a high-efficiency corridor, calls for region-specific interventions. In high-risk northern regions of Hotan Prefecture such as Moyu County and Lop County, policies should emphasize ecological compensation and risk mitigation, including increasing fiscal transfers to offset economic constraints imposed by conservation activities and the deployment of pioneer windbreak and sand-stabilization projects. By contrast, high-performing southern regions of Hotan Prefecture such as Qira County and Yutian County should serve as demonstration zones where successful technological and managerial models are systematically summarized and scaled up. A county-specific policy approach is advised to tailor interventions based on specific local shortcomings, whether they are technological or managerial in nature.
Third, project scale optimization should emphasize quality over mere expansion. Fluctuations in scale efficiency indicated that neither unchecked expansion nor abrupt contraction of project areas leads to sustainable efficiency gains. Ecological planning should, therefore, shift from pursuing scale to maximizing efficiency. Pre-project assessments, particularly the evaluation of water resource carrying capacity and CBA, should be mandatory to determine economically optimal project scales. Resources ought to be directed toward intensive and refined management of existing projects rather than uncontrolled reclamation of new land.
Fourth, regional coordination and integrated watershed management must be strengthened. The comparative analysis with the Aral Sea Basin underscores the vital importance of effective governance and cross-jurisdictional coordination. Hotan Prefecture’s relative success hinges on its coordinated institutional framework, yet further strengthening is needed to address internal disparities. Establishing cross-county or city ecological compensation mechanisms and water rights trading markets can create economic incentives for water-saving practices and technological upgrading. Additionally, reinforcing the authority of Integrated Water Resource Management (IWRM) institutions is crucial to balancing water use across upstream, midstream, and downstream sectors, securing ecological base flows, and preventing agricultural overuse from encroaching on ecological needs.
Finally, a data-driven monitoring and decision-support system should be constructed. The efficiency of the DEA Malmquist index in this study demonstrates the value of quantitative efficiency evaluation in guiding policy. It is recommended that efficiency assessments can be incorporated into the routine appraisal system of desertification control projects, with regular reporting at annual or 5-a intervals. Moreover, a Decision-Support System integrating remote sensing, meteorological, hydrological, and socio-economic data should be developed to simulate efficiency outcomes under different policy scenarios. Such a system would provide real-time, visualizable evidence to support scientific decision-making and avoid subjective or arbitrary planning.
By adopting these evidence-based recommendations, policy-makers can enhance the sustainability and impact of desertification control efforts not only in Hotan Prefecture but also in other arid regions facing similar environmental and governance challenges.

4.5. Research limitations and future directions

This study has several methodological limitations that suggest avenues for future research. Although the classical DEA Malmquist index is well-established and transparent, it does not integrate recent methodological advances such as the Global and Biennial Malmquist indices, which offer improved intertemporal comparability and resolve linear infeasibility problems (Karagiannis and Ravanos, 2024; Guo and Ye, 2025). These more advanced models are capable of delivering stronger and more accurate measurements of the total factor productivity. The reason for not adopting these approaches in the current study lies in their more demanding data requirements, particularly in terms of time span and data quality. Given the limited sample size available, applying such models could introduce additional estimation uncertainties. Then, the DEA Malmquist index currently does not incorporate undesirable outputs, such as carbon emissions potentially generated during the implementation of desertification control projects. The exclusion of such negative outputs may lead to an overestimation of the true ecological efficiency. This limitation arises primarily due to the unavailability of consistent and reliable township-level carbon emission data across the study period. Future studies should prioritize the construction of comprehensive environmental accounts that include undesirable outputs. Employing models capable of handling such data, like the Slack-Based Measure (Yang et al., 2018; Yan et al., 2019) or Directional Distance Function frameworks (Zhang and Choi, 2014; Gerami et al., 2024), would provide a more nuanced and accurate assessment of sustainability performance, ultimately leading to more robust policy recommendations. Thus, the classical model was employed to establish a foundational and reproducible benchmark assessment of desertification control efficiency in Hotan Prefecture. We strongly recommend that future research prioritizes the use of these advanced methodologies when data conditions allow, in order to enable a more comprehensive evaluation of environmental governance efficiency.

5. Conclusions

This study applied an integrated DEA Malmquist index to quantitatively evaluate the spatiotemporal dynamics of desertification control efficiency in Hotan Prefecture from 2005 to 2023. The results showed a 12.0% increase in the total factor productivity over the study period, mainly driven by technological progress and improved management. Over time, the development evolves through 2 phases: a first period of significant technology-led growth from 2005 to 2010, and then a period where scale efficiency change helped sustain the progress. However, a decline in the total factor productivity after 2015 highlighted the risks of technological stagnation. Spatially, Qira County achieved the highest growth rate of the total factor productivity, which is attributed to effective integration of technology and management, while Moyu County lagged due to limited technological renewal. These findings emphasize that effective desertification control requires more than simply expanding project scale, and it demands region-specific strategies that combine technical innovation and tailored governance. Methodologically, this study contributes to the field by integrating implicit ecological services into efficiency evaluation, offering a more comprehensive alternative to conventional area-based metrics.
The empirical results provide a clear basis for policy interventions. The post-2015 decline in the total factor productivity underscored that initial gains from large-scale projects are not sustainable without continuous innovation and adaptive management. Furthermore, significant spatial variation in efficiency between northern and southern counties or city of Hotan Prefecture indicated that uniform policy approaches are unlikely to succeed. For example, Qira County’s success arose from simultaneous advances in technology and management, whereas Moyu County’s stagnation reflected a lack of technological updating. These patterns suggest that effective policies should combine technical upgrades with managerial improvements and make adjustments according to local conditions. Variations in scale efficiency also indicated that project size must be aligned with local environmental and managerial capacity.
Based on the findings of this study, this study proposed 4 targeted policy recommendations to enhance desertification control efficiency in Hotan Prefecture and other similar arid regions. First, promoting a synergistic approach between technological innovation and management optimization is essential, particularly through establishing innovative funds and training programs in technologically lagging areas. Second, implementing spatially targeted governance strategies is needed, such as designating high-efficiency zones as demonstration areas while providing ecological compensation and reinforced infrastructure in high-risk regions. Third, project scale should be optimized through rigorous pre-project assessments including water resource carrying capacity and CBA to ensure ecological and economic feasibility. Fourth, cross-regional coordination and evidence-based policy-making should be enhanced via integrated basin institutions and decision-support systems. These recommendations are grounded in empirical results and aim to offer scalable solutions for sustainable desertification control in hyper-arid regions.

Authorship contribution statement

SUN Lingxiao: formal analysis, funding acquisition, methodology, software, writing - original draft, and writing - review & editing; LI Chunlan: conceptualization and validation; YU Yang: project administration; HE Jing: data curation; YANG Meilin: investigation; WANG Qian: resources; LIANG Xueqiong: visualization; Ireneusz MALIK: supervision; and Małgorzata WISTUBA: supervision. All authors approved the manuscript.

Declaration of conflict of interest

YU Yang is a Young Editorial Board member of Regional Sustainability and was not involved in the editorial review or the decision to publish this article; and Ireneusz MALIK is an Editorial Board member of Regional Sustainability and was not involved in the editorial review or the decision to publish this article. All authors declare that there are no competing interests.

Acknowledgments

This research was funded by the National Key Research and Development Program of China (2023YFF0805603).
[1]
Abbas, A., Jin, L.L., He, Q., et al., 2021. Temporal and spatial variations of the air temperature in the Taklamakan Desert and surrounding areas. Theor. Appl. Climatol. 144, 873-884.

[2]
Abuzaid, A.S., AbdelRahman, M.A.E., Fadl, M.E., et al., 2021. Land degradation vulnerability mapping in a newly-reclaimed desert oasis in a hyper-arid agro-ecosystem using AHP and geospatial techniques. Agronomy. 11(7), 1426, doi: 10.3390/agronomy11071426.

[3]
Araujo, A.S.F., Medeiros, E.V.D., Costa, D.P.D., et al., 2024. From desertification to restoration in the Brazilian semiarid region: Unveiling the potential of land restoration on soil microbial properties. J. Environ. Manage. 351, 119746, doi: 10.1016/j.jenvman.2023.119746.

[4]
Bai, J., Li, J.L., Bao, A.M., et al., 2021. Spatial-temporal variations of ecological vulnerability in the Tarim River Basin, Northwest China. J. Arid Land. 13(8), 814-834.

DOI

[5]
Becerril-Piña, R., Mastachi-Loza, C.A., 2021. Desertification:Causes and Countermeasures. Cham: Springer.

[6]
Bestelmeyer, B.T., 2005. Does desertification diminish biodiversity? Enhancement of ant diversity by shrub invasion in south-western USA. Divers. Distrib. 11(1), 45-55.

DOI

[7]
Cai, Y.M., Wu, J.X., Yimiti, T., et al., 2024. The landscape altered the interaction between vegetation and climate in the desert oasis of Hotan River Basin, Xinjiang, China. Ecol. Model. 491, 110687, doi: 10.1016/j.ecolmodel.2024.110687.

[8]
Cao, X., Cui, M., Xi, L., et al., 2024. Spatial-temporal process of land use/land cover and desertification in the Circum-Tarim Basin during 1990-2020. Land. 13(6), 735, doi: 10.3390/land13060735.

[9]
Chen, Y., Ali, A.I., 2004. DEA Malmquist productivity measure: New insights with an application to computer industry. Eur. J. Oper. Res. 159(1), 239-249.

DOI

[10]
Cheng, L.F., Song, S., Xie, Y.F., 2022. Evaluation of water resources utilization efficiency in Guangdong Province based on the DEA-Malmquist model. Front. Environ. Sci. 10, 819693, doi: 10.3389/fenvs.2022.819693.

[11]
D’Odorico, P., Bhattachan, A., Davis, K.F., et al., 2013. Global desertification: Drivers and feedbacks. Adv. Water Resour. 51, 326-344.

[12]
Fan, J.Q., Xu, Y., Zhang, Y.F., 2023. Evaluating land restoration based on the land cover in the Horqin Sandy Land, China. Environ. Sci. Pollut. Res. 30(38), 88417-88430.

DOI

[13]
Fare, R., Grosskopf, S., Lovell, C.K., et al., 1989. Multilateral productivity comparisons when some outputs are undesirable: a nonparametric approach. Rev. Econ. Stat. 71(1), doi: doi.org/10.2307/1928055.

[14]
Feng, D.D., Jiang, Y.F., Long, H.L., et al., 2024. Spatio-temporal patterns and correlation effects of regional rurality and poverty governance change: A case study of the rocky desertification area of Yunnan-Guangxi-Guizhou, China. Habitat Int. 146, 103044, doi: 10.1016/j.habitatint.2024.103044.

[15]
Feng, Q., Liu, W., Xi, H.Y., 2013. Comprehensive evaluation and indicator system of land desertification in the Heihe River Basin. Nat. Hazards. 65(3), 1573-1588.

DOI

[16]
Feuillette, S., Levrel, H., Boeuf, B., et al., 2016. The use of cost-benefit analysis in environmental policies: Some issues raised by the Water Framework Directive implementation in France. Environ. Sci. Policy. 57, 79-85.

[17]
Firsova, A., Chernyshova, G., 2020. Efficiency analysis of regional innovation development based on DEA Malmquist index. Information. 11(6), 294, doi: 10.3390/info11060294.

[18]
Gerami, J., Mozaffari, M.R., Wanke, P., et al., 2024. Fuzzy cost, revenue efficiency assessment and target setting in fuzzy DEA: a fuzzy directional distance function approach. J. Model. Manag. 19(1), 240-287.

DOI

[19]
Grilli, E., Carvalho, S.C.P., Chiti, T., et al., 2021. Critical range of soil organic carbon in southern Europe lands under desertification risk. J. Environ. Manage. 287, 112285, doi: 10.1016/j.jenvman.2021.112285.

[20]
Guo, H.W., Ling, H.B., Xu, H.L., et al., 2016. Study of suitable oasis scales based on water resource availability in an arid region of China: a case study of Hotan River Basin. Environ. Earth Sci. 75(11), 984, doi: 10.1007/s12665-016-5772-5.

[21]
Guo, Q., Fu, B.H., Shi, P.L., et al., 2017. Satellite monitoring the spatial-temporal dynamics of desertification in response to climate change and human activities across the Ordos Plateau, China. Remote Sens. 9(6), 525, doi: 10.3390/rs9060525.

[22]
Guo, R., Ye, M., 2025. Input-output efficiency, productivity dynamics, and determinants in western China’s higher education: A three-stage DEA, global Malmquist index, and Tobit model approach. PLoS One. 20(6), e0325901, doi: 10.1371/journal.pone.0325901.

[23]
Haj-Amor, Z., Araya, T., Kim, D.G., et al., 2022. Soil salinity and its associated effects on soil microorganisms, greenhouse gas emissions, crop yield, biodiversity and desertification: A review. Sci. Total Environ. 843, doi: 10.1016/j.scitotenv.2022.156946.

[24]
Hoekstra, A.Y., 2017. Water footprint assessment: Evolvement of a new research field. Water Resour. Manag. 31, 3061-3081.

[25]
Houérou, H.N.L., 1996. Climate change, drought and desertification. J. Arid. Environ. 34(2), 133-185.

DOI

[26]
HTBS (Hotan Bureau of Statistics), 2006. Hotan Statistical Yearbook. Beijing: China Statistics Press.

[27]
HTBS, 2011. Hotan Statistical Yearbook. Beijing: China Statistics Press.

[28]
HTBS, 2016. Hotan Statistical Yearbook. Beijing: China Statistics Press.

[29]
HTBS, 2024. Hotan Statistical Yearbook. Beijing: China Statistics Press.

[30]
Hu, Y.F., Jiang, S.L., Yuan, S., et al., 2017. Changes in soil organic carbon and its active fractions in different desertification stages of alpine-cold grassland in the eastern Qinghai-Tibet Plateau. Environ. Earth Sci. 76(9), 348, doi: 10.1007/s12665-017-6684-8.

[31]
Huang, M.T., Zhai, P.M., 2023. Desertification dynamics in China’s drylands under climate change. Adv. Clim. Chang. Res. 14(3), 429-436.

[32]
Karagiannis, G., Ravanos, P., 2024. Analyzing changes in EU social inclusion using the global Malmquist productivity index. Int. Trans. Oper. Res. 32(5), 2798-2818.

DOI

[33]
Kassas, M., 1995. Desertification: a general review. J. Arid. Environ. 30(2), 115-128.

DOI

[34]
Kelong, T., Wang, X.F., Gao, H.J., 2011. Analysis of ecological effects of comprehensive treatment in the Tarim River Basin using remote sensing data. Mining Science and Technology (China). 21(4), 519-524.

DOI

[35]
Khashtabeh, R., Akbari, M., Kolahi, M., et al., 2021. Assessing the effects of desertification control projects using socio-economic indicators in the arid regions of eastern Iran. Environ. Dev. Sustain. 23(7), 10455-10469.

DOI

[36]
Kong, M., Wang, X., Wu, Q., 2021. The development efficiency of China’s innovative industrial clusters-based on the DEA-Malmquist model. Arab. J. Geosci. 14(7), 638, doi: 10.1007/s12517-021-06927-5.

[37]
Lal, R., 2002. Soil carbon sequestration in China through agricultural intensification, and restoration of degraded and desertified ecosystems. Land Degrad. Dev. 13(6), 469-478.

DOI

[38]
Lal, R., Smith, P., Jungkunst, H.F., et al., 2018. The carbon sequestration potential of terrestrial ecosystems. J. Soil Water Conserv. 73(6), 145-152.

[39]
Lan, T.L., Lai, Y.M., Gao, J.Q., et al., 2024. The changing permafrost environment under desertification and the heat transfer mechanism in the Qinghai-Tibetan Plateau. J. Environ. Manage. 367, 122055, doi: 10.1016/j.jenvman.2024.122055.

[40]
Li, C., Zhang, S.Q., Cui, M.Y., et al., 2022a. Improved vegetation ecological quality of the Three-North Shelterbelt Project Region of China during 2000-2020 as evidenced from multiple remotely sensed indicators. Remote Sens. 14(22), 5708, doi: 10.3390/rs14225708.

[41]
Li, J., Sun, W.H., Lichtfouse, E., et al., 2024a. Life cycle assessment of biochar for sustainable agricultural application: A review. Sci. Total Environ. 951, 175448, doi: 10.1016/j.scitotenv.2024.175448.

[42]
Li, J., Wu, H.C., Zhu, C., et al., 2024b. Evaluating and analyzing renewable energy performance in OECD countries under uncertainty: A robust DEA approach with common weights. Appl. Energy. 375, 124115, doi: 10.1016/j.apenergy.2024.124115.

[43]
Li, M.Q., Liu, S.L., Wang, F.F., et al., 2022b. Cost-benefit analysis of ecological restoration based on land use scenario simulation and ecosystem service on the Qinghai-Tibet Plateau. Glob. Ecol. Conserv. 34, e02006, doi: 10.1016/j.gecco.2022.e02006.

[44]
Li, X.M., Zhang, X.L., Du, H.R., et al., 2012. Spatial effect of mineral resources exploitation on urbanization: A case study of Tarim River Basin, Xinjiang, China. Chin. Geogr. Sci. 22(5), 590-601.

DOI

[45]
Lin, Y.H., Chen, Q.M., Huang, F.M., et al., 2023. Identifying ecological risk and cost-benefit value for supporting habitat restoration: a case study from Sansha Bay, southeast China. Ecol. Process. 12, 20, doi: 10.1186/s13717-023-00432-1.

[46]
Liu, L., Xue, J., Mao, D.L., et al., 2024. An adaptive cycle framework for navigating sustainability of oasis socio-ecological system: The case of Hotan region in Xinjiang, China. Ecol. Indic. 167, 112556, doi: 10.1016/j.ecolind.2024.112556.

[47]
Liu, Q.F., Zhao, Y.Y., Zhang, X.F., et al., 2018. Spatiotemporal patterns of desertification dynamics and desertification effects on ecosystem services in the Mu Us Desert in China. Sustainability. 10(3), 589, doi: 10.3390/su10030589.

[48]
Lozano, S., Borrego-Marín, M.M., 2024. A metafrontier network DEA approach for water usage efficiency assessment in the light of SDG target 6.4. Environ. Sci. Policy. 160, 103857, doi: 10.1016/j.envsci.2024.103857.

[49]
Lu, H.T., Zhao, R.F., Zhao, L., et al., 2023. A contrarian growth: The spatiotemporal dynamics of open-surface water bodies on the northern slope of Kunlun Mountains. Ecol. Indic. 157, 111249, doi: 10.1016/j.ecolind.2023.111249.

[50]
Malmquist, S., 1953. Index numbers and indifference surfaces. Trabajos De Estadistica. 4, 209-242.

[51]
Mao, D.H., Wang, Z.M., Wu, B.F., et al., 2018. Land degradation and restoration in the arid and semiarid zones of China: Quantified evidence and implications from satellites. Land Degrad. Dev. 29(11), 3841-3851.

DOI

[52]
Matustik, J., Koci, V., 2021. What is a footprint? A conceptual analysis of environmental footprint indicators. J. Clean Prod. 285, 124833, doi: 10.1016/j.jclepro.2020.124833.

[53]
Mutti, P.R., Lúcio, P.S., Dubreuil, V., et al., 2019. NDVI time series stochastic models for the forecast of vegetation dynamics over desertification hotspots. Int. J. Remote Sens. 41(7), 2759-2788.

DOI

[54]
Niu, X.T., Tian, M.R., Feng, C.Y., et al., 2025. Soil quality changes in the Horqin sandy area under different ecological restoration patterns. Sci Rep. 15, 8949, doi: 10.1038/s41598-025-93405-7.

[55]
Ren, Y., Zhang, B., Chen, X.D., et al., 2024. Analysis of spatial-temporal patterns and driving mechanisms of land desertification in China. Sci. Total Environ. 909, 168429, doi: 10.1016/j.scitotenv.2023.168429.

[56]
Reynolds, J.F., Smith, D.M.S., Lambin, E.F., et al., 2007. Global desertification: Building a science for dryland development. Science. 316(5826), 847-851.

DOI PMID

[57]
Rigamonti, L., Mancini, E., 2021. Life cycle assessment and circularity indicators. The International Journal of Life Cycle Assessment. 26(10), 1937-1942.

DOI

[58]
Saiko, T.A., Zonn, I.S., 2000. Irrigation expansion and dynamics of desertification in the Circum-Aral region of Central Asia. Appl. Geogr. 20(4), 349-367.

DOI

[59]
Santini, M., Caccamo, G., Laurenti, A., et al., 2010. A multi-component GIS framework for desertification risk assessment by an integrated index. Appl. Geogr. 30(3), 394-415.

DOI

[60]
Sanzheev, E.D., Mikheeva, A.S., Osodoev, P.V., et al., 2020. Theoretical approaches and practical assessment of socio-economic effects of desertification in Mongolia. Int. J. Environ. Res. Public Health. 17(11), 4068, doi: 10.3390/ijerph17114068.

[61]
Shakerian, N., Zehtabian, G., Chahooki, M.A.Z., et al., 2017. Determine the most important criteria and indicators that influence land degradation and desertification. Journal of Range and Watershed Management. 70(2), 385-398.

[62]
Shu, T.H., Liao, X., Yang, S., et al., 2024. Towards sustainability: Evaluating energy efficiency with a super-efficiency SBM-DEA model across 168 economies. Appl. Energy. 376, 124254, doi: 10.1016/j.apenergy.2024.124254.

[63]
Silva, B.F.D., Rodrigues, R.Z.D.S., Heiskanen, J., et al., 2023. Evaluating the temporal patterns of land use and precipitation under desertification in the semi-arid region of Brazil. Ecol. Inform. 77, 102192, doi: 10.1016/j.ecoinf.2023.102192.

[64]
Sun, L.X., Yu, Y., He, J., et al., 2025. Vulnerability assessment of social-ecological systems in arid regions: A cross-efficiency modified DEA model with entropy weight aggregation. Ecol. Indic. 179, 114149, doi: 10.1016/j.ecolind.2025.114149.

[65]
Suo, X.H., Cao, S.X., 2021. China’s Three North Shelter Forest Program: cost-benefit analysis and policy implications. Environment, Development and Sustainability. 23(10), 14605-14618.

DOI

[66]
Tang, Z.S., An, H., Deng, L., et al., 2016. Effect of desertification on productivity in a desert steppe. Sci Rep. 6, 27839, doi: 10.1038/srep27839.

[67]
Verón, S.R., Paruelo, J.M., Oesterheld, M., 2006. Assessing desertification. J. Arid. Environ. 66(4), 751-763.

DOI

[68]
Vinogradov, S., Langford, V.P.E., 2001. Managing transboundary water resources in the Aral Sea Basin: in search of a solution. International Journal of Global Environmental Issues. 1(3-4), 345-362.

DOI

[69]
Wang, D.Y., Li, Z.W., Zeng, G.M., et al., 2018. Evaluation of regionalization of soil and water conservation in China. Sustainability. 10(9), 3320, doi: 10.3390/su10093320.

[70]
Wang, L., Wu, X.Q., Guo, J.B., et al., 2022a. Spatial-temporal pattern of vegetation carbon sequestration and its response to rocky desertification control measures in a karst area, in Guangxi Province, China. Land Degrad. Dev. 34(3), 665-681.

DOI

[71]
Wang,, T., Chen, G.T., Zhao, H.L., et al., 2022b. Aeolian desertification status and its control in China. In: Li, R., Napier, T.L., El-Swaify, S.A., (eds.). Global Degradation of Soil and Water Resources. Singapore: Springer, 199-220.

[72]
Wang, X.Y., Li, Y.Q., Wang, X.Y., et al., 2021. Temporal and spatial variations in NDVI and analysis of the driving factors in the desertified areas of northern China from 1998 to 2015. Front. Environ. Sci. 9, 633020, doi: 10.3389/fenvs.2021.633020.

[73]
Wang, Y.F., Zhang, J.Q., Guo, E.L., et al., 2015. Fuzzy comprehensive evaluation-based disaster risk assessment of desertification in Horqin Sand Land, China. Int. J. Environ. Res. Public Health. 12(2), 1703-1725.

DOI

[74]
Wang, Y.Y., Xiao, Y., Xie, G.D., et al., 2022c. Evaluation of Qinghai-Tibet Plateau wind erosion prevention service based on RWEQ model. Sustainability. 14(8), 4635, doi: 10.3390/su14084635.

[75]
Wei, W., Guo, Z.C., Shi, P.J., et al., 2021. Spatiotemporal changes of land desertification sensitivity in northwest China from 2000 to 2017. J. Geogr. Sci. 31, 46-68.

[76]
Whitford, W.G., 1997. Desertification and animal biodiversity in the desert grasslands of North America. J. Arid. Environ. 37(4), 709-720.

DOI

[77]
Xu, D.Y., Li, C.L., Song, X., et al., 2014. The dynamics of desertification in the farming-pastoral region of North China over the past 10 years and their relationship to climate change and human activity. Catena. 123, 11-22.

[78]
Xu, X.L., 2018. Spatial Distribution Dataset of 1 km Vegetation Index (NDVI) during Growing Season in China. [2025-05-11]. http://www.resdata.com.cn/DataProduct/Detail/84 (in Chinese).

[79]
Xu, X.L., Liu, J.Y., Zhang, S.W., et al., 2018. China Multi-period Land Use Remote Sensing Monitoring Dataset (CNLUCC). [2025-05-11]. https://www.resdc.cn/DOI/doi.aspx?DOIid=54&WebShieldSessionVerify=93I3lejiItnkUs9jHTwS (in Chinese).

[80]
Yan, D., Kong, Y., Ye, B., et al., 2019. Spatial variation of energy efficiency based on a Super-Slack-Based Measure: Evidence from 104 resource-based cities. J. Clean Prod. 240, 117669, doi: 10.1016/j.jclepro.2019.117669.

[81]
Yang, T., Chen, W., Zhou, K.L., et al., 2018. Regional energy efficiency evaluation in China: A super efficiency slack-based measure model with undesirable outputs. J. Clean Prod. 198, 859-866.

[82]
Yang, Y.M., Long, A.H., Zhang, J., et al., 2021. An evapotranspiration model for arid land to estimate water loss in Hotan River Basin. In: 2021 IEEE International Geoscience and Remote Sensing Symposium IGARSS. Brussels: IEEE.

[83]
Yu, X., Lei, J.Q., Gao, X., 2022. An over review of desertification in Xinjiang, Northwest China. J. Arid Land. 14(11), 1181-1195.

DOI

[84]
Zhai, J.J., Wang, L., Liu, Y., et al., 2023. Assessing the effects of China’s Three-North Shelter Forest Program over 40 years. Sci. Total Environ. 857, 159354, doi: 10.1016/j.scitotenv.2022.159354.

[85]
Zhang, L.Y., Sun, L.X., Yu, Y., et al., 2025. Analyzing water footprint and water resources sustainability in China’s arid Northwest with Bayesian network. Ecol. Indic. 177, 113792, doi: 10.1016/j.ecolind.2025.113792.

[86]
Zhang, N., Choi, Y., 2014. A note on the evolution of directional distance function and its development in energy and environmental studies 1997-2013. Renew. Sust. Energ. Rev. 33, 50-59.

DOI

[87]
Zhao, H.L., He, Y.H., Zhou, R.L., et al., 2009. Effects of desertification on soil organic C and N content in sandy farmland and grassland of Inner Mongolia. Catena. 77(3), 187-191.

DOI

[88]
Zhao, Q., 2024. Evaluation and obstacle degree analysis of sustainable utilization of water resources in Hotan area. Pol. J. Environ. Stud. 33(2), 1925-1935.

[89]
Zheng, W., Guo, X.B., Zhou, P., et al., 2024. Vegetation restoration enhancing soil carbon sequestration in karst rocky desertification ecosystems: A meta-analysis. J. Environ. Manage. 370, 122530, doi: 10.1016/j.jenvman.2024.122530.

[90]
Zhiltsov,, S.S., Zonn, I.S., Grishin, O.E., et al., 2018. Transboundary rivers in central Asia:Cooperation and conflicts among countries. In: Zhiltsov, S.S., Zonn, I.S., Kostianoy, A.G., (eds.). Water Resources in Central Asia: International Context. Cham: Springer, 61-80.

[91]
Zhou, W., Gang, C.C., Zhou, F.C., et al., 2015. Quantitative assessment of the individual contribution of climate and human factors to desertification in northwest China using net primary productivity as an indicator. Ecol. Indic. 48, 560-569.

Outlines

/