
Characteristics and drivers of the soil multifunctionality under different land use and land cover types in the drylands of China
Received date: 2024-01-28
Revised date: 2024-06-16
Accepted date: 2024-08-23
Online published: 2025-08-14
The drylands of China cover approximately 6.6×10⁶ km2 and are home to approximately 5.8×10⁸ people, providing important ecosystem services for human survival and development. However, dryland ecosystems are extremely fragile and sensitive to external environmental changes. Land use and land cover (LULC) changes significantly impact soil structure and function, thus affecting the soil multifunctionality (SMF). However, the effect of LULC changes on the SMF in the drylands of China has rarely been reported. In this study, we investigated the characteristics of the SMF changes based on soil data in the 1980s from the National Tibetan Plateau Data Center. We explored the drivers of the SMF changes under different LULC types (including forest, grassland, shrubland, and desert) and used structural equation modeling to explore the main driver of the SMF changes. The results showed that the SMF under the four LULC types decreased in the following descending order: forest, grassland, shrubland, and desert. The main driver of the SMF changes under different LULC types was mean annual temperature (MAT). In addition to MAT, pH in forest, soil moisture (SM) and soil biodiversity index in grassland, SM in shrubland, and aridity index in desert are crucial factors for the SMF changes. Therefore, the SMF in the drylands of China is regulated mainly by MAT and pH, and comprehensive assessments of the SMF in drylands need to be performed regarding LULC changes. The results are beneficial for evaluating the SMF among different LULC types and predicting the SMF under global climate change.
SONG Boyi , ZHANG Shihang , LU Yongxing , GUO Hao , GUO Xing , WANG Mingming , ZHANG Yuanming , ZHOU Xiaobing , ZHUANG Weiwei . Characteristics and drivers of the soil multifunctionality under different land use and land cover types in the drylands of China[J]. Regional Sustainability, 2024 , 5(3) : 100162 . DOI: 10.1016/j.regsus.2024.100162
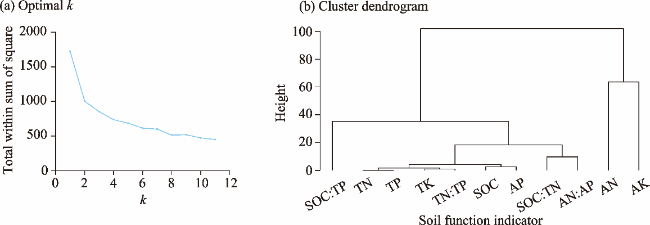
Fig. 1. Clustering diagram of soil function indicators. (a), determining the optimal number of clusters (k); (b), a dendrogram of soil function indicators showing four main clusters. SOC, soil organic carbon; TN, total nitrogen; TP, total phosphorus; TK, total potassium; AN, available nitrogen; AP, available phosphorus; AK, available potassium. |
Table 1 Correlations between soil function indicators and the soil multifunctionality (SMF). |
| Soil organic carbon (SOC) | Total nitrogen (TN) | Total phosphorus (TP) | Total potassium (TK) | SOC:TN | SOC:TP | TN: TP | Available nitrogen (AN) | Available phosphorus (AP) | Available potassium (AK) | AN:AP | |
|---|---|---|---|---|---|---|---|---|---|---|---|
| MF1 | 0.82** | 0.96** | 0.56** | 0.69** | 0.91** | 0.43* | 0.53** | 0.78** | 0.57** | 0.59** | 0.77** |
| MF2 | 0.77** | 0.83** | 0.61** | 0.75** | 0.84** | 0.51** | 0.55** | 0.66** | 0.76** | 0.62** | 0.90** |
Note: MF1, the SMF obtained via the averaging method; MF2, the SMF obtained via the multiple-threshold method; *, P<0.05; **, P<0.01. |
Table 2 Descriptive statistics of soil factors, vegetation, and climate factors in the drylands of China under different LULC types. |
| LULC type | Parameter | SOC (g/kg) | TN (g/kg) | TP (g/kg) | TK (g/kg) | AN (mg/kg) | AP (mg/kg) | AK (mg/kg) | pH | NDVI | MAP (mm) | MAT (°C) | AI |
|---|---|---|---|---|---|---|---|---|---|---|---|---|---|
| Forest | Mean | 8.12 | 0.41 | 0.53 | 2.01 | 190.16 | 8.53 | 157.41 | 6.71 | 0.36 | 550.12 | 7.09 | 0.41 |
| Min | 5.53 | 0.26 | 0.33 | 1.72 | 83.34 | 4.59 | 49.36 | 4.41 | 0.31 | 125.16 | -4.33 | 0.28 | |
| Max | 27.27 | 1.08 | 0.69 | 2.65 | 518.69 | 15.01 | 277.13 | 8.51 | 0.41 | 985.71 | 15.33 | 0.65 | |
| SD | 5.99 | 1.12 | 0.42 | 0.25 | 143.29 | 4.13 | 69.89 | 0.92 | 0.11 | 238.84 | 5.99 | 0.11 | |
| CV | 0.74 | 2.73 | 0.79 | 0.12 | 0.75 | 0.48 | 0.44 | 0.14 | 0.31 | 0.43 | 0.84 | 0.27 | |
| Grassland | Mean | 8.05 | 0.43 | 0.59 | 2.12 | 188.72 | 8.72 | 147.39 | 6.06 | 0.28 | 514.77 | 6.44 | 0.33 |
| Min | 4.98 | 0.17 | 0.29 | 1.17 | 79.88 | 5.51 | 54.12 | 3.70 | 0.22 | 110.98 | -5.13 | 0.18 | |
| Max | 22.18 | 1.12 | 0.77 | 2.71 | 534.90 | 14.98 | 285.56 | 8.81 | 0.34 | 996.75 | 16.12 | 0.59 | |
| SD | 6.16 | 0.93 | 0.37 | 0.27 | 161.25 | 4.04 | 71.18 | 1.01 | 0.10 | 229.26 | 4.57 | 0.13 | |
| CV | 0.77 | 2.16 | 0.63 | 0.13 | 0.85 | 0.46 | 0.48 | 0.17 | 0.36 | 0.45 | 0.71 | 0.39 | |
| Shrubland | Mean | 6.61 | 0.38 | 0.47 | 1.88 | 175.16 | 6.83 | 162.38 | 7.05 | 0.25 | 389.41 | 6.18 | 0.45 |
| Min | 4.45 | 0.29 | 0.31 | 1.53 | 66.37 | 13.37 | 55.36 | 4.92 | 0.17 | 155.74 | -4.49 | 0.22 | |
| Max | 25.69 | 0.92 | 0.65 | 2.77 | 451.13 | 15.07 | 343.39 | 8.63 | 0.28 | 885.14 | 14.54 | 0.61 | |
| SD | 5.28 | 0.96 | 0.49 | 0.23 | 144.57 | 3.98 | 62.58 | 0.79 | 0.08 | 213..63 | 3.93 | 0.16 | |
| CV | 0.80 | 2.53 | 1.04 | 0.12 | 0.83 | 0.58 | 0.39 | 0.11 | 0.32 | 0.55 | 0.64 | 0.36 | |
| Desert | Mean | 2.18 | 0.13 | 0.32 | 1.84 | 25.19 | 5.11 | 144.72 | 8.13 | 0.04 | 120.15 | 3.61 | 0.13 |
| Min | 0.15 | 0.02 | 0.23 | 1.68 | 10.02 | 1.35 | 42.11 | 6.99 | 0.01 | 7.87 | -11.00 | 0.01 | |
| Max | 6.93 | 0.52 | 0.41 | 2.53 | 87.55 | 7.78 | 205.95 | 9.00 | 0.08 | 212.36 | 19.93 | 0.22 | |
| SD | 2.58 | 0.58 | 0.22 | 0.19 | 58.14 | 3.93 | 59.96 | 0.35 | 0.02 | 189.16 | 6.89 | 0.09 | |
| CV | 1.18 | 4.46 | 0.69 | 0.10 | 2.31 | 0.77 | 0.41 | 0.04 | 0.50 | 1.57 | 1.91 | 0.69 |
Note: LULC, land use and land cover; NDVI, normalized difference vegetation index; MAP, mean annual precipitation; MAT, mean annual temperature; AI, aridity index; Min, minimum; Max, maximum; SD, standard deviation; CV, coefficient of variation. |
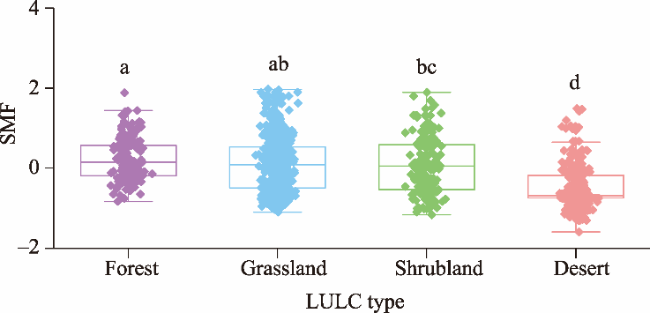
Fig. 2. Soil multifunctionality (SMF) in the drylands of China under different land use and land cover (LULC) types. The dot represents the data value; the top, middle, and bottom lines of the box represent the upper quartile, median, and lower quartile, respectively; the upper whisker represents the upper quartile+1.5IQR (interquartile range); and the lower whisker represents the lower quartile-1.5IQR. Different lowercase letters indicate significant differences among different LULC types at P<0.05 level. |
Table 3 Correlations between the SMF and environmental factors under different LULC types. |
| LULC type | NDVI | pH | SM | SBI | MAT | AI |
|---|---|---|---|---|---|---|
| Forest | 0.356*** | -0.297** | 0.145 | 0.279** | -0.682** | 0.243** |
| Grassland | 0.214** | 0.143 | 0.347** | 0.326** | -0.650*** | 0.399*** |
| Shrubland | 0.150 | -0.432*** | 0.480*** | 0.381*** | -0.428*** | 0.117 |
| Desert | 0.091 | -0.386*** | 0.231** | 0.469*** | -0.368*** | 0.586*** |
Note: SM, soil moisture; SBI, soil biodiversity index. *, **, *** indicate significant differences at P<0.05, P<0.01, and P<0.001 levels, respectively. |
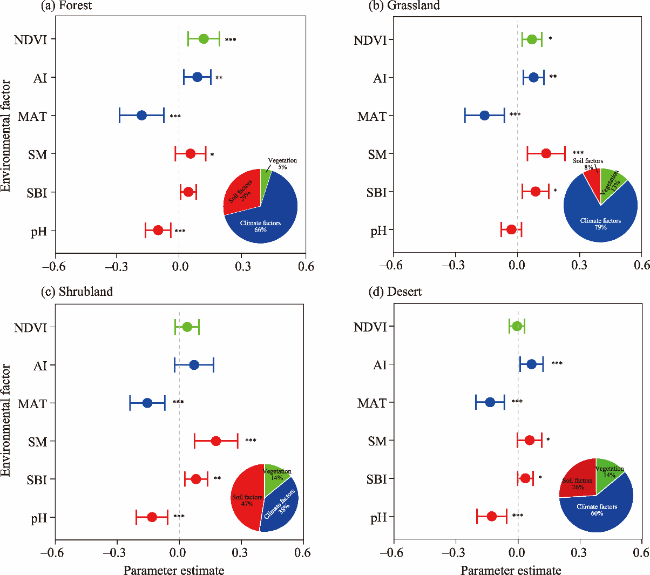
Fig. 3. Impacts of climate factors (MAT and AI), soil factors (pH, SM, and SBI), and vegetation (NDVI) on the SMF under different LULC types. (a), forest; (b), grassland; (c), shrubland; (d), desert. The pie chart reflects the relative importance of climate factors, soil factors, and vegetation to the SMF. NDVI, normalized difference vegetation index; AI, aridity index; MAT, mean annual temperature; SM, soil moisture; SBI, soil biodiversity index; *, P<0.05; **, P<0.01; ***, P<0.001. Error bar represents the standard deviation. |
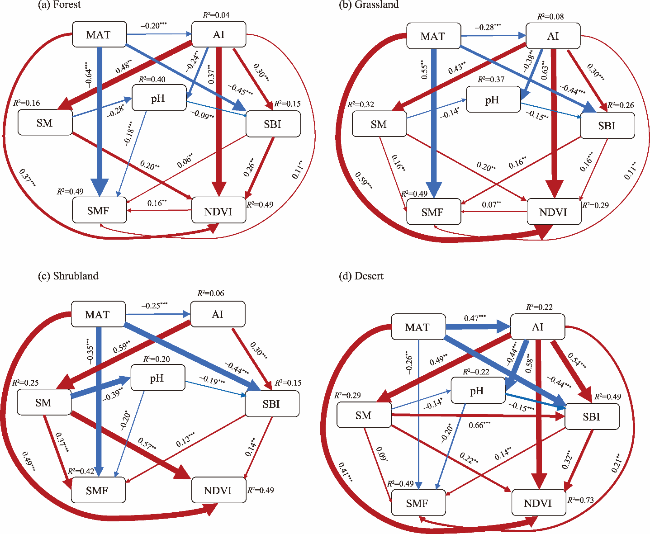
Fig. 4. Structural equation modeling (SEM) showing the impacts of climate factors, soil factors, and vegetation on the SMF under different LULC types. (a), forest; (b), grassland; (c), shrubland; (d), desert. The red and blue lines indicate positive and negative relationships, respectively. The thickness of the line is proportional to the size of the normalized path coefficient and indicates the strength of the relationship. The arrow represents the direction of the effect. The value on the arrow indicates the effect size. *, P<0.05; **, P<0.01; ***, P<0.001. |
| [1] |
|
| [2] |
|
| [3] |
|
| [4] |
|
| [5] |
|
| [6] |
|
| [7] |
|
| [8] |
|
| [9] |
|
| [10] |
|
| [11] |
|
| [12] |
|
| [13] |
|
| [14] |
|
| [15] |
|
| [16] |
|
| [17] |
|
| [18] |
|
| [19] |
|
| [20] |
|
| [21] |
|
| [22] |
|
| [23] |
|
| [24] |
|
| [25] |
|
| [26] |
|
| [27] |
|
| [28] |
|
| [29] |
|
| [30] |
|
| [31] |
|
| [32] |
|
| [33] |
|
| [34] |
|
| [35] |
|
| [36] |
|
| [37] |
|
| [38] |
|
| [39] |
|
| [40] |
|
| [41] |
|
| [42] |
|
| [43] |
|
| [44] |
|
| [45] |
|
| [46] |
|
| [47] |
|
| [48] |
|
| [49] |
|
| [50] |
|
| [51] |
|
| [52] |
|
| [53] |
|
| [54] |
|
| [55] |
|
| [56] |
|
| [57] |
|
| [58] |
|
| [59] |
|
| [60] |
|
| [61] |
|
| [62] |
|
| [63] |
|
| [64] |
|
| [65] |
|
| [66] |
|
| [67] |
|
| [68] |
|
| [69] |
|
| [70] |
|
| [71] |
|
| [72] |
|
| [73] |
|
| [74] |
|
| [75] |
|
| [76] |
|
| [77] |
|
| [78] |
|
| [79] |
|
| [80] |
|
| [81] |
|
| [82] |
|
| [83] |
|
| [84] |
|
| [85] |
|
| [86] |
|
| [87] |
|
| [88] |
|
| [89] |
|
| [90] |
|
| [91] |
|
| [92] |
|
| [93] |
|
| [94] |
|
| [95] |
|
| [96] |
|
| [97] |
|
| [98] |
|
| [99] |
|
/
| 〈 |
|
〉 |